Download to read offline

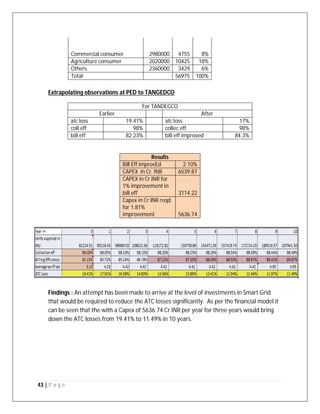
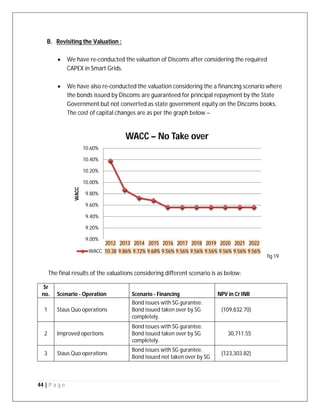


The research report analyzes the financial state of Indian state distribution companies (discoms) and the impact of a Rs 1.9 lakh crore financial restructuring package and smart grid technology on their viability. It highlights ongoing challenges, including rising operational losses, the gap between average costs and revenue, and integration of smart grid solutions as a sustainable strategy. The report also evaluates the effectiveness of various initiatives and reforms undertaken to improve the financial performance and operational efficiency of discoms.


