As expected 5470-5480 once again emerges as a crucial ress zone in the last session as spot index posted marginal losses backed by the weak global cues. At current juncture domestic indices found some strong ress near to 5500 zone. Any successful closing for at least two consecutive days will break this shackle and we might see some more upside near to 5600 though we still intact on our previous view of 5340-5350 as a major support zone on closing basis. Hence traders and investors are advise to maintain cautiously optimistic approach and use ‘Buy on Dip ‘ strategy for the upcoming sessions.
The document is a market report listing future levels for various indices and stocks traded on Indian exchanges. It provides information such as the open interest, change in open interest from the previous day, percentage change in open and closing prices, and support and resistance levels for each underlying asset. The report indicates overall declines in most indices and stocks over the past day, with the Nifty down 1.29% and Banknifty down 1.48%. It lists detailed pricing data and analysis for over 100 individual stocks and indices trading in futures markets in India.
The document appears to be a listing of future levels for various indices and stocks on the Indian market. It provides information such as the open interest, change in open interest from the previous day, and price changes for various stocks and indices. The table suggests that the overall market was up on the day of September 15th, with the Nifty index rising 0.85% and Bank Nifty rising 0.45%, while some individual stocks showed both gains and losses.
The document appears to be a market report that provides data on changes in open interest and closing prices for various stocks and indices for the futures market. It includes data such as the lot size, open interest as of February 9th, change in open interest, percentage change in open interest, change in closing price, support and resistance levels, and closing prices as of February 9th for various underlyings like Nifty, Banknifty, stocks etc. The report is dated February 10th and provides this data for planning or analysis purposes in the futures market.
The document provides quarterly financial results for PNB, UCO Bank, and City Union Bank. For PNB, revenue saw a marginal increase for the quarter ended September 2013 while profit declined 52.56%. UCO Bank reported a 5.92% rise in revenue and a remarkable 285.88% increase in net profit for the quarter. City Union Bank's revenue grew 20.48% while net profit growth was modest at 4.89% for the quarter.
The revenue and profits of India Cements declined in the quarter ended September 2013 compared to the same period last year. The net loss for the quarter was Rs. 225.30 million versus a net profit of Rs. 490.80 million last year. Operating profit also decreased from Rs. 2082.30 million to Rs. 1119.00 million.
In contrast, Tech Mahindra saw significant growth in the September 2013 quarter over the corresponding period last year. Total revenue increased 175.64% to Rs. 41562.40 million. Net profit rose sharply by 298.83% to Rs. 6386.40 million. Operating profit also grew from Rs. 2352.80 million to Rs. 8989
The revenue of Indraprastha Gas zoomed 18.11% for the quarter ended September 2013 compared to the same period last year. However, the Net Profit registered a slight decline of 6.51%. Glaxo Consumer Healthcare witnessed an 18.23% growth in revenue but Net Profit grew only 14.3% for the quarter. BHEL's sales declined 14.93% for the quarter while Net Profit fell sharply by 64.22% compared to the corresponding quarter of the previous year. Operating profit also decreased for BHEL.
This document provides key support and resistance levels for various stock indexes and individual stocks along with their open interest, change in open interest, and closing price information as of November 5, 2013. It lists Nifty, Bank Nifty, CNXIT, and various individual stock futures with their lot size, open interest, change in open interest, support levels 1 and 2 (S1 and S2), resistance levels 1 and 2 (R1 and R2), and closing price on November 5.
- Nifty futures closed at 6298.80 on Tuesday, at a premium of 45.65 points over the spot closing of 6253.15. Nifty December 2013 futures ended at a premium of 92.05 points over the spot closing.
- The put call ratio for Nifty options was 1.31, indicating higher open interest in put options. The put call ratio for Bank Nifty options was 0.97.
- For the upcoming session, the market seems bullish. However, 6317 and 6343 could act as crucial resistance levels, while 6210 and 6170 may serve as near-term support levels.
- The document provides key support and resistance levels for various stocks and indices based on their open interest as of October 30, 2013, the day before expiry. It notes the change in open interest and closing price for each underlying from the previous day. Support levels 1 and 2 (S1, S2) and resistance levels 1 and 2 (R1, R2) are given.
- Open interest increased for Nifty futures but decreased for Bank Nifty and CNXIT futures. Several individual stocks saw significant decreases in open interest, including Adani Power, Hindalco, HDIL, and JSW Steel, while open interest grew for IndusInd Bank, HDFC, and Kotak Bank.
-
The Nifty futures closed at 6,255, up 0.5% from the previous day's close. Trading volumes declined across most derivative products. Put call ratios for both Nifty and Bank Nifty options were above 1, indicating greater open interest for put options. The report provides closing prices and open interest figures for various stocks. It also outlines the most actively traded call and put options, and recommends a bearish options strategy for Nifty.
This document provides key support and resistance levels for futures contracts of various stocks trading on Indian exchanges, based on their open interest and closing price on October 29, 2013. It lists over 50 stocks, along with their lot size, open interest, change in open interest from the previous day, support and resistance levels, and closing price. The expiry date for the contracts is October 31, 2013.
The document is a daily derivative report that provides the following key information:
- Nifty futures closed at 6231.10, a premium of 10.20 points over the spot closing of 6220.90. Open interest on Nifty October futures contracted by 1.3 million units to 12.82 million units.
- Several stock futures like Tata Steel, Yes Bank, DLF, and ICICI Bank traded at discounts to their spot closing prices.
- Put call ratios for Nifty and Bank Nifty options were 1.66 and 1.27 respectively, indicating higher put open interest.
- Total futures and options turnover increased 94.24% compared to the previous day, with gains
This document provides key support and resistance levels for various stock futures contracts expiring on October 31, 2013. It lists underlying stocks, their lot size, open interest, change in open interest, percentage change in open interest and closing price from October 28, 2013. It also provides support levels S1 and S2 and resistance levels R1 and R2 for each stock future contract based on technical analysis.
This document provides key support and resistance levels for various stock indexes and futures as of October 25, 2013. It lists underlying assets, their lot size, open interest, changes in open interest, support and resistance levels, and closing prices from the previous day. The expiry date for the futures contracts is October 31, 2013. It contains this information for indexes like Nifty, Bank Nifty, CNXIT and over 50 stock futures.
The document is a daily derivatives report that provides key information on the NIFTY futures market. Some of the key details included in the summary are:
- NIFTY futures closed at 6,141, down 19.45 points (0.32%) from the previous day's close.
- Total futures and options volume declined 21.02% compared to the previous day.
- The put call ratio for Nifty and Bank Nifty options was 1.45 and 1.08 respectively, indicating higher put open interest.
- Most active stock futures like DLF, ITC, Yes Bank and Tata Steel were trading at premiums between 0.25-2.90 points compared to their spot prices
- Nifty futures closed at 6177.00 on Thursday, at a premium of 12.65 points over the spot closing of 6164.35. Nifty November 2013 futures ended at 6227.05, at a premium of 62.70 points over the spot closing.
- Trading volumes increased for index futures (10.78%), index options (10.21%) and decreased for stock futures (-6.60%) and stock options (-11.76%).
- Key support and resistance levels for Nifty are seen at 6105/6032 and 6235/6280 respectively.
This document provides a summary of futures trading data for various stocks and indices for the expiry date of 31st October 2013. It lists the underlying asset, lot size, open interest, change in open interest, support and resistance levels, and closing price from 23rd October 2013. Key details include an overall increase in open interest for Nifty futures of 6.54% and Bank Nifty futures of 4.06%, while open interest decreased for CNXIT futures by 7.9%. Support and resistance levels are provided to indicate possible price movement ranges.
Nifty futures closed lower at 6,178.35 points, down 0.39% from the previous day's close. Trading volumes increased across all derivative segments. Put call ratios for both Nifty and Bank Nifty options were above 1, indicating greater open interest in put options. Most active calls and puts were seen in the 6,100-6,300 strike price range for the October 31 expiry. The report provides an outlook for Nifty, noting key resistance and support levels. It also includes a sample options strategy for Nifty and a tracker of previous strategies.
Nifty futures closed lower at 6,178.35 points, down 0.39% from the previous day's close. Trading volumes increased across all derivative segments. Put call ratios for both Nifty and Bank Nifty options indicate a bearish sentiment. Most active calls and puts were seen in the 6,100-6,300 strike prices for the October 31 expiry. The report provides an outlook for Nifty, noting key resistance and support levels. It also includes the most and least active stocks by change in open interest. Strategies tracked show profits booked from positions in Nifty futures and options.
This document provides key support and resistance levels for various stock indexes and futures as of October 22, 2013. It lists underlying assets, their lot sizes, open interest levels and changes, and support and resistance price levels. The expiry date for futures contracts is October 31, 2013. Overall, open interest increased for many indexes and stocks compared to the previous day.
- The document provides key support and resistance levels for various stocks and indices in the futures and options market. It lists the underlying, lot size, open interest, change in open interest, closing price and support and resistance levels for each stock.
- The highest changes in open interest were seen in Federal Bank (44.72%), IDFC (10.08%), and Cairn India (10.99%) while the largest falls were in HDFCBank (-2.22%) and LIC Housing Finance (-1.49%).
- The expiry date for the futures and options contracts is 31st October 2013.
- The Nifty futures closed at 6236.00 on Monday, a premium of 31.05 points over the spot closing of 6,204.95.
- Put call ratios for Nifty and Bank Nifty options were 1.59 and 1.06 respectively, indicating higher put open interest.
- Total futures and options turnover decreased by 17.43% on Monday compared to the previous day, with index options seeing the largest fall of 19.52%.
The Nifty futures closed at 6045.85, up 2.37% from the previous day. Trading volumes increased across various derivative segments like index futures, stock futures, index options and stock options. The put call ratios for Nifty and Bank Nifty options were 1.56 and 1 respectively. Open interest increased for several stocks as their prices declined, while open interest rose for some stocks when their prices increased. Overall open interest increased most for sectors like construction, finance, IT and pharmaceuticals. The document provides analysis of most actively traded stock options and calls and puts on the Nifty. It also includes a proposed options strategy and tracker of past strategies.
13 Jun 24 ILC Retirement Income Summit - slides.pptxILC- UK
ILC's Retirement Income Summit was hosted by M&G and supported by Canada Life. The event brought together key policymakers, influencers and experts to help identify policy priorities for the next Government and ensure more of us have access to a decent income in retirement.
Contributors included:
Jo Blanden, Professor in Economics, University of Surrey
Clive Bolton, CEO, Life Insurance M&G Plc
Jim Boyd, CEO, Equity Release Council
Molly Broome, Economist, Resolution Foundation
Nida Broughton, Co-Director of Economic Policy, Behavioural Insights Team
Jonathan Cribb, Associate Director and Head of Retirement, Savings, and Ageing, Institute for Fiscal Studies
Joanna Elson CBE, Chief Executive Officer, Independent Age
Tom Evans, Managing Director of Retirement, Canada Life
Steve Groves, Chair, Key Retirement Group
Tish Hanifan, Founder and Joint Chair of the Society of Later life Advisers
Sue Lewis, ILC Trustee
Siobhan Lough, Senior Consultant, Hymans Robertson
Mick McAteer, Co-Director, The Financial Inclusion Centre
Stuart McDonald MBE, Head of Longevity and Democratic Insights, LCP
Anusha Mittal, Managing Director, Individual Life and Pensions, M&G Life
Shelley Morris, Senior Project Manager, Living Pension, Living Wage Foundation
Sarah O'Grady, Journalist
Will Sherlock, Head of External Relations, M&G Plc
Daniela Silcock, Head of Policy Research, Pensions Policy Institute
David Sinclair, Chief Executive, ILC
Jordi Skilbeck, Senior Policy Advisor, Pensions and Lifetime Savings Association
Rt Hon Sir Stephen Timms, former Chair, Work & Pensions Committee
Nigel Waterson, ILC Trustee
Jackie Wells, Strategy and Policy Consultant, ILC Strategic Advisory Board
The revenue and profits of India Cements declined in the quarter ended September 2013 compared to the same period last year. The net loss for the quarter was Rs. 225.30 million versus a net profit of Rs. 490.80 million last year. Operating profit also decreased from Rs. 2082.30 million to Rs. 1119.00 million.
In contrast, Tech Mahindra saw significant growth in the September 2013 quarter over the corresponding period last year. Total revenue increased 175.64% to Rs. 41562.40 million. Net profit rose sharply by 298.83% to Rs. 6386.40 million. Operating profit also grew from Rs. 2352.80 million to Rs. 8989
The revenue of Indraprastha Gas zoomed 18.11% for the quarter ended September 2013 compared to the same period last year. However, the Net Profit registered a slight decline of 6.51%. Glaxo Consumer Healthcare witnessed an 18.23% growth in revenue but Net Profit grew only 14.3% for the quarter. BHEL's sales declined 14.93% for the quarter while Net Profit fell sharply by 64.22% compared to the corresponding quarter of the previous year. Operating profit also decreased for BHEL.
This document provides key support and resistance levels for various stock indexes and individual stocks along with their open interest, change in open interest, and closing price information as of November 5, 2013. It lists Nifty, Bank Nifty, CNXIT, and various individual stock futures with their lot size, open interest, change in open interest, support levels 1 and 2 (S1 and S2), resistance levels 1 and 2 (R1 and R2), and closing price on November 5.
- Nifty futures closed at 6298.80 on Tuesday, at a premium of 45.65 points over the spot closing of 6253.15. Nifty December 2013 futures ended at a premium of 92.05 points over the spot closing.
- The put call ratio for Nifty options was 1.31, indicating higher open interest in put options. The put call ratio for Bank Nifty options was 0.97.
- For the upcoming session, the market seems bullish. However, 6317 and 6343 could act as crucial resistance levels, while 6210 and 6170 may serve as near-term support levels.
- The document provides key support and resistance levels for various stocks and indices based on their open interest as of October 30, 2013, the day before expiry. It notes the change in open interest and closing price for each underlying from the previous day. Support levels 1 and 2 (S1, S2) and resistance levels 1 and 2 (R1, R2) are given.
- Open interest increased for Nifty futures but decreased for Bank Nifty and CNXIT futures. Several individual stocks saw significant decreases in open interest, including Adani Power, Hindalco, HDIL, and JSW Steel, while open interest grew for IndusInd Bank, HDFC, and Kotak Bank.
-
The Nifty futures closed at 6,255, up 0.5% from the previous day's close. Trading volumes declined across most derivative products. Put call ratios for both Nifty and Bank Nifty options were above 1, indicating greater open interest for put options. The report provides closing prices and open interest figures for various stocks. It also outlines the most actively traded call and put options, and recommends a bearish options strategy for Nifty.
This document provides key support and resistance levels for futures contracts of various stocks trading on Indian exchanges, based on their open interest and closing price on October 29, 2013. It lists over 50 stocks, along with their lot size, open interest, change in open interest from the previous day, support and resistance levels, and closing price. The expiry date for the contracts is October 31, 2013.
The document is a daily derivative report that provides the following key information:
- Nifty futures closed at 6231.10, a premium of 10.20 points over the spot closing of 6220.90. Open interest on Nifty October futures contracted by 1.3 million units to 12.82 million units.
- Several stock futures like Tata Steel, Yes Bank, DLF, and ICICI Bank traded at discounts to their spot closing prices.
- Put call ratios for Nifty and Bank Nifty options were 1.66 and 1.27 respectively, indicating higher put open interest.
- Total futures and options turnover increased 94.24% compared to the previous day, with gains
This document provides key support and resistance levels for various stock futures contracts expiring on October 31, 2013. It lists underlying stocks, their lot size, open interest, change in open interest, percentage change in open interest and closing price from October 28, 2013. It also provides support levels S1 and S2 and resistance levels R1 and R2 for each stock future contract based on technical analysis.
This document provides key support and resistance levels for various stock indexes and futures as of October 25, 2013. It lists underlying assets, their lot size, open interest, changes in open interest, support and resistance levels, and closing prices from the previous day. The expiry date for the futures contracts is October 31, 2013. It contains this information for indexes like Nifty, Bank Nifty, CNXIT and over 50 stock futures.
The document is a daily derivatives report that provides key information on the NIFTY futures market. Some of the key details included in the summary are:
- NIFTY futures closed at 6,141, down 19.45 points (0.32%) from the previous day's close.
- Total futures and options volume declined 21.02% compared to the previous day.
- The put call ratio for Nifty and Bank Nifty options was 1.45 and 1.08 respectively, indicating higher put open interest.
- Most active stock futures like DLF, ITC, Yes Bank and Tata Steel were trading at premiums between 0.25-2.90 points compared to their spot prices
- Nifty futures closed at 6177.00 on Thursday, at a premium of 12.65 points over the spot closing of 6164.35. Nifty November 2013 futures ended at 6227.05, at a premium of 62.70 points over the spot closing.
- Trading volumes increased for index futures (10.78%), index options (10.21%) and decreased for stock futures (-6.60%) and stock options (-11.76%).
- Key support and resistance levels for Nifty are seen at 6105/6032 and 6235/6280 respectively.
This document provides a summary of futures trading data for various stocks and indices for the expiry date of 31st October 2013. It lists the underlying asset, lot size, open interest, change in open interest, support and resistance levels, and closing price from 23rd October 2013. Key details include an overall increase in open interest for Nifty futures of 6.54% and Bank Nifty futures of 4.06%, while open interest decreased for CNXIT futures by 7.9%. Support and resistance levels are provided to indicate possible price movement ranges.
Nifty futures closed lower at 6,178.35 points, down 0.39% from the previous day's close. Trading volumes increased across all derivative segments. Put call ratios for both Nifty and Bank Nifty options were above 1, indicating greater open interest in put options. Most active calls and puts were seen in the 6,100-6,300 strike price range for the October 31 expiry. The report provides an outlook for Nifty, noting key resistance and support levels. It also includes a sample options strategy for Nifty and a tracker of previous strategies.
Nifty futures closed lower at 6,178.35 points, down 0.39% from the previous day's close. Trading volumes increased across all derivative segments. Put call ratios for both Nifty and Bank Nifty options indicate a bearish sentiment. Most active calls and puts were seen in the 6,100-6,300 strike prices for the October 31 expiry. The report provides an outlook for Nifty, noting key resistance and support levels. It also includes the most and least active stocks by change in open interest. Strategies tracked show profits booked from positions in Nifty futures and options.
This document provides key support and resistance levels for various stock indexes and futures as of October 22, 2013. It lists underlying assets, their lot sizes, open interest levels and changes, and support and resistance price levels. The expiry date for futures contracts is October 31, 2013. Overall, open interest increased for many indexes and stocks compared to the previous day.
- The document provides key support and resistance levels for various stocks and indices in the futures and options market. It lists the underlying, lot size, open interest, change in open interest, closing price and support and resistance levels for each stock.
- The highest changes in open interest were seen in Federal Bank (44.72%), IDFC (10.08%), and Cairn India (10.99%) while the largest falls were in HDFCBank (-2.22%) and LIC Housing Finance (-1.49%).
- The expiry date for the futures and options contracts is 31st October 2013.
- The Nifty futures closed at 6236.00 on Monday, a premium of 31.05 points over the spot closing of 6,204.95.
- Put call ratios for Nifty and Bank Nifty options were 1.59 and 1.06 respectively, indicating higher put open interest.
- Total futures and options turnover decreased by 17.43% on Monday compared to the previous day, with index options seeing the largest fall of 19.52%.
The Nifty futures closed at 6045.85, up 2.37% from the previous day. Trading volumes increased across various derivative segments like index futures, stock futures, index options and stock options. The put call ratios for Nifty and Bank Nifty options were 1.56 and 1 respectively. Open interest increased for several stocks as their prices declined, while open interest rose for some stocks when their prices increased. Overall open interest increased most for sectors like construction, finance, IT and pharmaceuticals. The document provides analysis of most actively traded stock options and calls and puts on the Nifty. It also includes a proposed options strategy and tracker of past strategies.
More from Mansukh Investment & Trading Solutions (20)
13 Jun 24 ILC Retirement Income Summit - slides.pptxILC- UK
ILC's Retirement Income Summit was hosted by M&G and supported by Canada Life. The event brought together key policymakers, influencers and experts to help identify policy priorities for the next Government and ensure more of us have access to a decent income in retirement.
Contributors included:
Jo Blanden, Professor in Economics, University of Surrey
Clive Bolton, CEO, Life Insurance M&G Plc
Jim Boyd, CEO, Equity Release Council
Molly Broome, Economist, Resolution Foundation
Nida Broughton, Co-Director of Economic Policy, Behavioural Insights Team
Jonathan Cribb, Associate Director and Head of Retirement, Savings, and Ageing, Institute for Fiscal Studies
Joanna Elson CBE, Chief Executive Officer, Independent Age
Tom Evans, Managing Director of Retirement, Canada Life
Steve Groves, Chair, Key Retirement Group
Tish Hanifan, Founder and Joint Chair of the Society of Later life Advisers
Sue Lewis, ILC Trustee
Siobhan Lough, Senior Consultant, Hymans Robertson
Mick McAteer, Co-Director, The Financial Inclusion Centre
Stuart McDonald MBE, Head of Longevity and Democratic Insights, LCP
Anusha Mittal, Managing Director, Individual Life and Pensions, M&G Life
Shelley Morris, Senior Project Manager, Living Pension, Living Wage Foundation
Sarah O'Grady, Journalist
Will Sherlock, Head of External Relations, M&G Plc
Daniela Silcock, Head of Policy Research, Pensions Policy Institute
David Sinclair, Chief Executive, ILC
Jordi Skilbeck, Senior Policy Advisor, Pensions and Lifetime Savings Association
Rt Hon Sir Stephen Timms, former Chair, Work & Pensions Committee
Nigel Waterson, ILC Trustee
Jackie Wells, Strategy and Policy Consultant, ILC Strategic Advisory Board
What Lessons Can New Investors Learn from Newman Leech’s Success?Newman Leech
Newman Leech's success in the real estate industry is based on key lessons and principles, offering practical advice for new investors and serving as a blueprint for building a successful career.
“Amidst Tempered Optimism” Main economic trends in May 2024 based on the results of the New Monthly Enterprises Survey, #NRES
On 12 June 2024 the Institute for Economic Research and Policy Consulting (IER) held an online event “Economic Trends from a Business Perspective (May 2024)”.
During the event, the results of the 25-th monthly survey of business executives “Ukrainian Business during the war”, which was conducted in May 2024, were presented.
The field stage of the 25-th wave lasted from May 20 to May 31, 2024. In May, 532 companies were surveyed.
The enterprise managers compared the work results in May 2024 with April, assessed the indicators at the time of the survey (May 2024), and gave forecasts for the next two, three, or six months, depending on the question. In certain issues (where indicated), the work results were compared with the pre-war period (before February 24, 2022).
✅ More survey results in the presentation.
✅ Video presentation: https://youtu.be/4ZvsSKd1MzE
Report on Stock Market Outlook by Mansukh Investment 17 Aug,2010
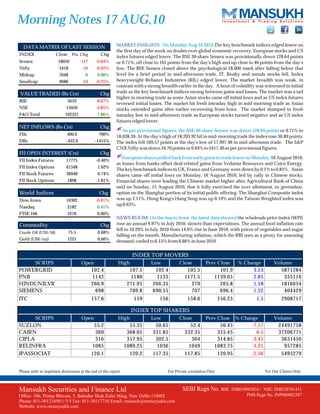
1. Morning Notes 17 AUG,10
MARKET INSIGHTS: On Monday Aug 16 2010,The key benchmark indices edged lower on
DATA MATRIX OF LAST SESSION
the first day of the week on doubts over global economic recovery. European stocks and US
INDEX Close Pts. Chg Chg
index futures edged lower. The BSE 30-share Sensex was provisionally down 128.64 points
Sensex 18050 -117 -0.64% or 0.71%, off close to 165 points from the day's high and up close to 40 points from the day's
Nifty 5418 -34 -0.62% low. The BSE Sensex closed above the psychological 18,000 mark after falling below that
Midcap 7648 6 0.08% level for a brief period in mid-afternoon trade. IT, Realty and metals stocks fell. Index
Smallcap 9686 -24 -0.25% heavyweight Reliance Industries (RIL) edged lower. The market breadth was weak, in
contrast with a strong breadth earlier in the day. A bout of volatility was witnessed in initial
VALUE TRADED (Rs Crs) Chg trade as the key benchmark indices swung between gains and losses. The market was a tad
higher in morning trade as some Asian stocks came off initial lows and as US index futures
BSE 5619 -8.07%
reversed initial losses. The market hit fresh intraday high in mid-morning trade as Asian
NSE 15959 -3.85% stocks extended gains after earlier recovering from lows. The market slumped to fresh
F&O Total 102321 7.86% intraday low in mid-afternoon trade as European stocks turned negative and as US index
futures edged lower.
NET INFLOWS (Rs Crs) Chg
As per provisional figures, the BSE 30-share Sensex was down 128.64 points or 0.71% to
FIIs 400.0 700%
18,038.39. At the day's high of 18,203.92 hit in mid-morning trade the index rose 36.89 points.
DIIs -433.9 -1415% The index fell 169.57 points at the day's low of 17,997.46 in mid-afternoon trade. The S&P
CNX Nifty was down 34.70 points or 0.64% to 5417.40 as per provisional figures.
FII OPEN INTEREST (Crs) Chg
European shares pulled back from early gains to trade lower on Monday, 16 August 2010,
FII Index Futures 17775 -0.40%
as losses from banks offset deal-related gains from Vedanta Resources and Cairn Energy.
FII Index Options 61548 1.62%
The key benchmark indices in UK, France and Germany were down by 0.1% to 0.85%. Asian
FII Stock Futures 36948 0.74% shares came off initial lows on Monday, 16 August 2010, led by rally in Chinese stocks.
FII Stock Options 1898 -1.81% Financial shares were leading the Chinese market higher after Agricultural Bank of China
said on Sunday, 15 August 2010, that it fully exercised the over allotment, or greenshoe,
World Indices Chg option on the Shanghai portion of its initial public offering. The Shanghai Composite index
Dow Jones 10302 -0.01% was up 2.11%. Hong Kong's Hang Seng was up 0.19% and the Taiwan Weighted index was
up 0.63%.
Nasdaq 2182 0.41%
FTSE 100 5276 0.00%
NEWS ROOM: On the macro front, the latest data showed the wholesale price index (WPI)
Commodity Chg rose an annual 9.97% in July 2010, slower than expectations. The annual food inflation rate
fell to 10.29% in July 2010 from 14.6% rise in June 2010, with prices of vegetables and sugar
Crude Oil (US$/bl) 75.5 0.68%
falling on the month. Manufacturing inflation, which the RBI uses as a proxy for assessing
Gold (US$/oz) 1225 0.66% demand, cooled to 6.15% from 6.66% in June 2010.
INDEX TOP MOVERS
SCRIPS Open High Low Close Prev Close % Change Volume
POWERGRID 102.4 107.5 102.4 105.5 101.9 3.53 5871284
PNB 1142 1180 1133 1171.5 1139.05 2.85 355116
HINDUNILVR 266.9 271.95 266.35 270 265.8 1.58 1816654
SIEMENS 698 709.8 690.55 707 696.4 1.52 404429
ITC 157.6 159 156 158.6 156.25 1.5 2908717
INDEX TOP SHAKERS
SCRIPS Open High Low Close Prev Close % Change Volume
SUZLON 55.2 55.35 50.65 52.4 56.45 -7.17 24491758
CAIRN 360 368.05 331.85 332.35 355.45 -6.5 37206771
CIPLA 316 317.95 302.5 304 314.85 -3.45 3631450
RELINFRA 1085 1089.25 1036 1049 1083.75 -3.21 957285
JPASSOCIAT 120.1 120.2 117.35 117.85 120.95 -2.56 5495279
Please refer to important disclosures at the end of this report For Private circulation Only For Our Clients Only
Mansukh Securities and Finance Ltd SEBI Regn No. BSE: INB010985834 / NSE: INB230781431
Office: 306, Pratap Bhavan, 5, Bahadur Shah Zafar Marg, New Delhi-110002 PMS Regn No. INP000002387
Phone: 011-30123450/1/3/5 Fax: 011-30117710 Email: research@moneysukh.com
Website: www.moneysukh.com
2. Morning Notes
MARKET OUTLOOK- CAUTIOUSLY OPTIMISTIC
TODAY'S MARKET LEVELS
Index Support 2 Support 1 Previous Close Resistance 1 Resistance 2 Trend
SENSEX 17660 17830 18050 18235 18485 Rangebound
NIFTY 5345 5380 5418 5475 5520 Rangebound
TECHNICAL VIEW: As expected 5470-5480 once again emerges as a crucial ress zone in the last session as spot index
posted marginal losses backed by the weak global cues. At current juncture domestic indices found some strong ress near to
5500 zone. Any successful closing for at least two consecutive days will break this shackle and we might see some more upside
near to 5600 though we still intact on our previous view of 5340-5350 as a major support zone on closing basis. Hence traders
and investors are advise to maintain cautiously optimistic approach and use ‘Buy on Dip ‘ strategy for the upcoming sessions.
HAPPY TRADING....
Index Support 2 Support 1 Previous Close Resistance 1 Resistance 2 Trend
BANK NIFTY 10220 10520 10677 10880 10965 Rangebound
Please refer to important disclosures at the end of this report For Private circulation Only For Our Clients Only
Mansukh Securities and Finance Ltd SEBI RegnRegnBSE: INB010985834 / NSE: INB230781431
SEBI No. No. BSE: INB010985834 / NSE: INB230781431
Mansukh Securities and Finance Ltd
Office: 306, Pratap Bhavan, 5, Bahadur Shah Zafar Marg, New Delhi-110002
PMS Regn No. INP000002387
Phone: 011-30123450/1/3/5 Fax:Bahadur Shah Zafar Marg, New Delhi-110002
Office: 306, Pratap Bhavan, 5, 011-30117710 Email: research@moneysukh.com
Website:011-30123450/1/3/5 Fax: 011-30117710 Email: research@moneysukh.com
Phone: www.moneysukh.com
Website: www.moneysukh.com
3. Morning Notes
INTRA DAY TECHNICAL RECOMMENDATIONS
Scrip CMP Buy Near Stop Loss Target 1 Target 2 Trend
BAJAJ HIND 122.95 120 118 123 125 Rangebound
Scrip CMP Buy Near Stop Loss Target 1 Target 2 Trend
NRC 10.8 10.5 10 11 11.5 Rangebound
Mansukh Securities and Finance Ltd SEBI Regn No. BSE: INB010985834 / NSE: INB230781431
Office: 306, Pratap Bhavan, 5, Bahadur Shah Zafar Marg, New Delhi-110002 PMS Regn No. INP000002387
Phone: 011-30123450/1/3/5 Fax: 011-30117710 Email: research@moneysukh.com
Website: www.moneysukh.com
4. Morning Notes
INTRA DAY TECHNICAL RECOMMENDATIONS
Scrip CMP Buy Near Stop Loss Target 1 Target 2 Trend
PRAJ 79.5 78.5 77 80 81 Rangebound
Scrip CMP Sell Near Stop Loss Target 1 Target 2 Trend
GAMMON I 197.1 200 205 195 193 Rangebound
Please refer to important disclosures at the end of this report For Private circulation Only For Our Clients Only
Mansukh Securities and Finance Ltd SEBI Regn No. BSE: INB010985834 / NSE: INB230781431
Office: 306, Pratap Bhavan, 5, Bahadur Shah Zafar Marg, New Delhi-110002 PMS Regn No. INP000002387
Phone: 011-30123450/1/3/5 Fax: 011-30117710 Email: research@moneysukh.com
Website: www.moneysukh.com
5. Morning Notes
Research Desk Phone: 011-30211872/73 Email: research@moneysukh.com
NAME DESIGNATION E-MAIL
Varun Gupta Head - Research varungupta@moneysukh.com
Pashupati Nath Jha Research Analyst pashupatinathjha@moneysukh.com
Vikram Singh Research Analyst vikram_research@moneysukh.com
For more copies or other information, please send your query at research@moneysukh.com
Note: Please refer our Derivative Report for recommendation on OPTION STRATEGIES.
Additional Information with respect to the securities referred in our derivative calls is uploaded on our website.
Please note that our technical calls are totally independent of our fundamental calls
Technical Trends calls are based on momentum, Investors/Traders are requested to observe following discipline to take maximum advantage of the
products
-Entry/exit will be on the basis of price or time priority
-Use strict stop loss at 15% from your average acquisition price
This report is prepared for the exclusive use of Mansukh Group clients only and should not be reproduced, recirculated,published in any media, website
or otherwise, in any form or manner, in part or as a whole, without the express consent in writing of Mansukh Securities and Finance Ltd. Any
unauthorized use, disclosure or public dissemination of information contained herein is prohibited.
This data sheet is for private circulation only and the said document does not constitute an offer to buy or sell any securities mentioned herein. While
utmost care has been taken in preparing the above, we claim no responsibility for its accuracy. We shall not be liable for any direct or indirect losses
arising from the use thereof and the investors are requested to use the information contained herein at their own risk.
Please refer to important disclosures at the end of this report For Private circulation Only For Our Clients Only
Mansukh Securities and Finance Ltd SEBI Regn No. BSE: INB010985834 / NSE: INB230781431
Office: 306, Pratap Bhavan, 5, Bahadur Shah Zafar Marg, New Delhi-110002 PMS Regn No. INP000002387
Phone: 011-30123450/1/3/5 Fax: 011-30117710 Email: research@moneysukh.com
Website: www.moneysukh.com