
Recommended
Recommended
More Related Content
What's hot
What's hot (11)
Viewers also liked
Viewers also liked (20)
Similar to Regression.Doc Rini
Similar to Regression.Doc Rini (20)
More from guestbed2c6
Recently uploaded
Recently uploaded (20)
Regression.Doc Rini
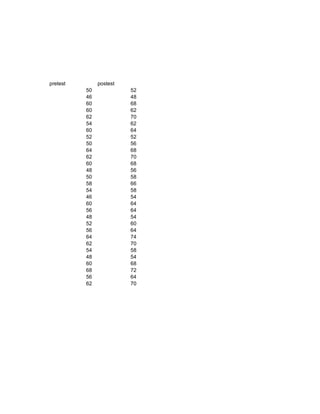
- 1. pretest postest 50 52 46 48 60 68 60 62 62 70 54 62 60 64 52 52 50 56 64 68 62 70 60 68 48 56 50 58 58 66 54 58 46 54 60 64 56 64 48 54 52 60 56 64 64 74 62 70 54 58 48 54 60 68 68 72 56 64 62 70
- 2. Regression Descriptive Statistics Mean Std. Deviation N pretest 56.0667 6.04542 30 posttest 62.2667 6.92289 30
- 3. Correlations pretest posttest Pearson Correlation pretest 1.000 .932 posttest .932 1.000 Sig. (1-tailed) pretest . .000 posttest .000 . N pretest 30 30 posttest 30 30 Variables Entered/Removedb Variables Variables Model Entered Removed Method 1 posttesta . Enter a. All requested variables entered. b. Dependent Variable: pretest Model Summaryb Adjusted Std. Error of Model R R Square R Square the Estimate 1 .932a .869 .864 2.22614 a. Predictors: (Constant), posttest b. Dependent Variable: pretest output spss tersebut memiliki nilai koefisien determinasi yang sudah di sesuaikan (adjustd R square) 0,864 artinya 86,4% fariabel independent nilai posttest di jelaskan oleh variable independen nilai pretest dan sisanya 13,6%(100-86,9% di jelaskan oleh variable lain di luar variable yang di gunakan. ANOVAb Sum of Model Squares df Mean Square F Sig. 1 Regression 921.108 1 921.108 185.869 .000a Residual 138.759 28 4.956 Total 1059.867 29 a. Predictors: (Constant), FISIKA b. Dependent Variable: KIMIA
- 4. ANOVAb Sum of Model Squares df Mean Square F Sig. 1 Regression 921.108 1 921.108 185.869 .000a Residual 138.759 28 4.956 Total 1059.867 29 a. Predictors: (Constant), posttest b. Dependent Variable: pretest Coefficientsa Unstandardized Standardized Coefficients Coefficients Model B Std. Error Beta t Sig. 1 (Constant) 5.376 3.740 1.437 .162 posttest .814 .060 .932 13.633 .000 a. Dependent Variable: pretest Residuals Statisticsa Minimum Maximum Mean Std. Deviation N Predicted Value 44.4524 65.6186 56.0667 5.63581 30 Std. Predicted Value -2.061 1.695 .000 1.000 30 Standard Error of .407 .944 .560 .134 30 Predicted Value Adjusted Predicted Value 44.1132 65.8655 56.0508 5.66925 30 Residual -3.33691 4.29125 .00000 2.18742 30 Std. Residual -1.499 1.928 .000 .983 30 Stud. Residual -1.565 2.042 .003 1.019 30 Deleted Residual -3.63697 4.81714 .01583 2.35572 30 Stud. Deleted Residual -1.609 2.174 .016 1.046 30 Mahal. Distance .001 4.247 .967 .981 30 Cook's Distance .001 .256 .039 .059 30 Centered Leverage Value .000 .146 .033 .034 30 a. Dependent Variable: pretest Charts
- 5. Normal P-P Plot of Regression Standardized Residual Dependent Variable: pretest 1.0 0.8 Expected Cum Prob 0.6 0.4 0.2 0.0 0.0 0.2 0.4 0.6 0.8 1.0 Observed Cum Prob
- 6. Scatterplot Dependent Variable: pretest Regression Studentized Residual 2 1 0 -1 -2 -2 -1 0 1 2 Regression Standardized Predicted Value