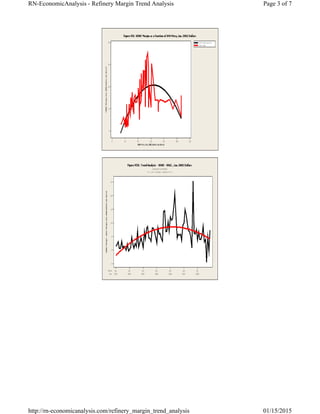
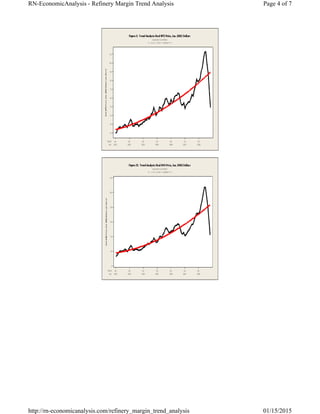
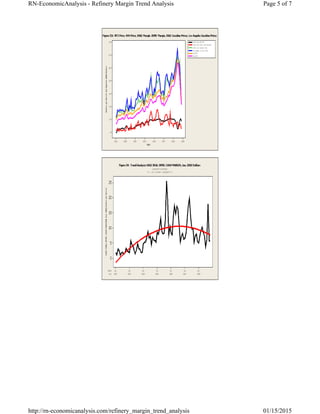
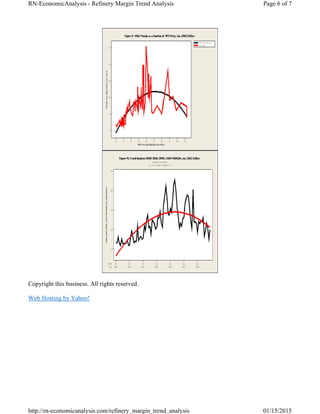
RN-EconomicAnalysis
robert@rn-economicanalysis.com
 Home
 Valuation Rules of Thumb
 Economic Obsolescence
 Refinery Margin Trend Analysis
 Petroleum and Natural Gas Trends
 Coal, Oil, and Gas Comparison
 Contact Us
Refinery Margin Trend Analysis
Refinery Margin Trends: Used an index of refinery profitability published monthly in the Oil & Gas
Journal. (The definitions of and explanations of these indices can be obtained from the Oil & Gas
Journal, Muse, Stancil & Co. Refining Margins.)
The indices are based on "typical" refinery sizes and configurations for each region. They do not reflect
changes in refinery utilization rates. This look at profitability is not intended to look at actual refinery
profitability but more at the relative trends.
US Gulf Coast (USGC) and the US West Coast (USWC) margins and crude oil prices were used to
illustrate how profitability varied between regions and how rising crude oil prices influenced refinery
profitability.
Cash margins and oil prices beginning in January 2002 through November 2008 were used in this
analysis. These dollar amounts were adjusted for general price inflation by applying the GDP Price
Deflator. All values were adjusted to first quarter 2002 prices.
Crude Oil Prices, Product Prices, and Margins
Figure I, above, is a trend analysis of the West Texas Intermediate (WTI) price history adjusted to
January 2002 prices. This trend for the period is clearly upward and is representative of crude oil prices
on the Gulf Coast.
Figure II shows the Alaskan North Slope (ANS) crude prices which also has a clear upward time trend
and is representative of crude oil prices on the West Coast.
As a comparison, Figure III shows margins, oil prices, and conventional gasoline prices together. Crude
prices were continuing upward while the margins had begun a downward trend through August of 2008.
After that month, crude prices began to fall rapidly as the world economy slipped into a severe
Page 1 of 7RN-EconomicAnalysis - Refinery Margin Trend Analysis
01/15/2015http://rn-economicanalysis.com/refinery_margin_trend_analysis
recession. The demand for products declined, reducing margins for refining which lead to a decline in
crude oil demand and thus, crude oil prices. A comparison of the crude oil prices relative to product
prices showed that crude oil prices began declining just after gasoline prices did. The margins are still
downward trending. This does not take into account decreases in overall volume. Only margin per
barrel is represented here. This represents margins/profitability if operating at the same throughput all
of the time. A decrease in refinery utilization rate would decrease profitability even more.
Figure IV Shows the margin trend for the USGC. The trend peaked sometime in 2006 and has been
tending downward since. Figure V shows the margin correlated with crude oil price. This correlation
shows that the margin began to decline when oil prices were above 70 dollars per barrel. This
correlation is not even close to perfect because it ignores other variables which are acting on margin, but
because the oil price has been in an increasing trend since 2002, the relationship has hints of
significance. Now that we are in a recession, such a relationship may not be as evident.
Figure VI shows the USEC trend for margins. This trend also reversed in 2006. Figure VII shows the
margin declining after crude oil prices passed 60 dollars per barrel. The same comments made about the
USGC trends apply here.
Figure VIII shows that the divergence of the USGC and USWC margins ceased around 2006 with the
two continuing to converge as the recession continues on.
I will point out again that these trends are based on a margin index. Any index must have fixed
parameters which in the real world are not fixed. An index measures what the affect of changes in some
parameters would be on a variable assuming all other parametrs are held constant. It is like taking
partial derivatives or differentials. What is the effect if a given variable is changed given that all others
are held constant? This is the kind of question an index answers.
The Consumer Price Index, for instance, measures the effect of price changes on consumers given a
fixed set of products and services purchased. This is actually not the total affect on consumers as in the
real world people change the mix of what they consume as the relative prices of the mixture changes.
The margin index assumes constancy when what is constant in the index may change due to changes in
the costs and prices being varied.
Page 2 of 7RN-EconomicAnalysis - Refinery Margin Trend Analysis
01/15/2015http://rn-economicanalysis.com/refinery_margin_trend_analysis
Page 3 of 7RN-EconomicAnalysis - Refinery Margin Trend Analysis
01/15/2015http://rn-economicanalysis.com/refinery_margin_trend_analysis
Page 4 of 7RN-EconomicAnalysis - Refinery Margin Trend Analysis
01/15/2015http://rn-economicanalysis.com/refinery_margin_trend_analysis
Page 5 of 7RN-EconomicAnalysis - Refinery Margin Trend Analysis
01/15/2015http://rn-economicanalysis.com/refinery_margin_trend_analysis
Copyright this business. All rights reserved.
Web Hosting by Yahoo!
Page 6 of 7RN-EconomicAnalysis - Refinery Margin Trend Analysis
01/15/2015http://rn-economicanalysis.com/refinery_margin_trend_analysis
robert@rn-economicanalysis.com
close



Page 7 of 7RN-EconomicAnalysis - Refinery Margin Trend Analysis
01/15/2015http://rn-economicanalysis.com/refinery_margin_trend_analysis

Refinery margin trend_analysis

  • 1.
    RN-EconomicAnalysis robert@rn-economicanalysis.com  Home  ValuationRules of Thumb  Economic Obsolescence  Refinery Margin Trend Analysis  Petroleum and Natural Gas Trends  Coal, Oil, and Gas Comparison  Contact Us Refinery Margin Trend Analysis Refinery Margin Trend Analysis Refinery Margin Trends: Used an index of refinery profitability published monthly in the Oil & Gas Journal. (The definitions of and explanations of these indices can be obtained from the Oil & Gas Journal, Muse, Stancil & Co. Refining Margins.) The indices are based on "typical" refinery sizes and configurations for each region. They do not reflect changes in refinery utilization rates. This look at profitability is not intended to look at actual refinery profitability but more at the relative trends. US Gulf Coast (USGC) and the US West Coast (USWC) margins and crude oil prices were used to illustrate how profitability varied between regions and how rising crude oil prices influenced refinery profitability. Cash margins and oil prices beginning in January 2002 through November 2008 were used in this analysis. These dollar amounts were adjusted for general price inflation by applying the GDP Price Deflator. All values were adjusted to first quarter 2002 prices. Crude Oil Prices, Product Prices, and Margins Figure I, above, is a trend analysis of the West Texas Intermediate (WTI) price history adjusted to January 2002 prices. This trend for the period is clearly upward and is representative of crude oil prices on the Gulf Coast. Figure II shows the Alaskan North Slope (ANS) crude prices which also has a clear upward time trend and is representative of crude oil prices on the West Coast. As a comparison, Figure III shows margins, oil prices, and conventional gasoline prices together. Crude prices were continuing upward while the margins had begun a downward trend through August of 2008. After that month, crude prices began to fall rapidly as the world economy slipped into a severe Page 1 of 7RN-EconomicAnalysis - Refinery Margin Trend Analysis 01/15/2015http://rn-economicanalysis.com/refinery_margin_trend_analysis
  • 2.
    recession. The demandfor products declined, reducing margins for refining which lead to a decline in crude oil demand and thus, crude oil prices. A comparison of the crude oil prices relative to product prices showed that crude oil prices began declining just after gasoline prices did. The margins are still downward trending. This does not take into account decreases in overall volume. Only margin per barrel is represented here. This represents margins/profitability if operating at the same throughput all of the time. A decrease in refinery utilization rate would decrease profitability even more. Figure IV Shows the margin trend for the USGC. The trend peaked sometime in 2006 and has been tending downward since. Figure V shows the margin correlated with crude oil price. This correlation shows that the margin began to decline when oil prices were above 70 dollars per barrel. This correlation is not even close to perfect because it ignores other variables which are acting on margin, but because the oil price has been in an increasing trend since 2002, the relationship has hints of significance. Now that we are in a recession, such a relationship may not be as evident. Figure VI shows the USEC trend for margins. This trend also reversed in 2006. Figure VII shows the margin declining after crude oil prices passed 60 dollars per barrel. The same comments made about the USGC trends apply here. Figure VIII shows that the divergence of the USGC and USWC margins ceased around 2006 with the two continuing to converge as the recession continues on. I will point out again that these trends are based on a margin index. Any index must have fixed parameters which in the real world are not fixed. An index measures what the affect of changes in some parameters would be on a variable assuming all other parametrs are held constant. It is like taking partial derivatives or differentials. What is the effect if a given variable is changed given that all others are held constant? This is the kind of question an index answers. The Consumer Price Index, for instance, measures the effect of price changes on consumers given a fixed set of products and services purchased. This is actually not the total affect on consumers as in the real world people change the mix of what they consume as the relative prices of the mixture changes. The margin index assumes constancy when what is constant in the index may change due to changes in the costs and prices being varied. Page 2 of 7RN-EconomicAnalysis - Refinery Margin Trend Analysis 01/15/2015http://rn-economicanalysis.com/refinery_margin_trend_analysis
  • 3.
    Page 3 of7RN-EconomicAnalysis - Refinery Margin Trend Analysis 01/15/2015http://rn-economicanalysis.com/refinery_margin_trend_analysis
  • 4.
    Page 4 of7RN-EconomicAnalysis - Refinery Margin Trend Analysis 01/15/2015http://rn-economicanalysis.com/refinery_margin_trend_analysis
  • 5.
    Page 5 of7RN-EconomicAnalysis - Refinery Margin Trend Analysis 01/15/2015http://rn-economicanalysis.com/refinery_margin_trend_analysis
  • 6.
    Copyright this business.All rights reserved. Web Hosting by Yahoo! Page 6 of 7RN-EconomicAnalysis - Refinery Margin Trend Analysis 01/15/2015http://rn-economicanalysis.com/refinery_margin_trend_analysis
  • 7.
    robert@rn-economicanalysis.com close    Page 7 of7RN-EconomicAnalysis - Refinery Margin Trend Analysis 01/15/2015http://rn-economicanalysis.com/refinery_margin_trend_analysis