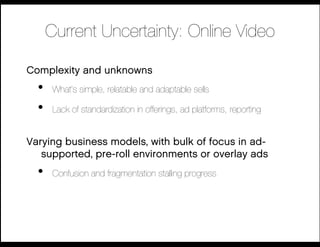
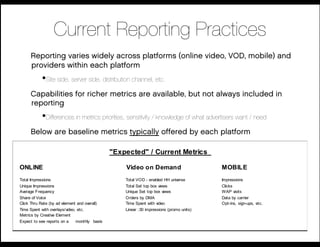
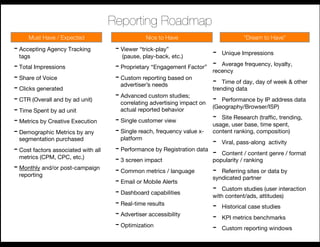
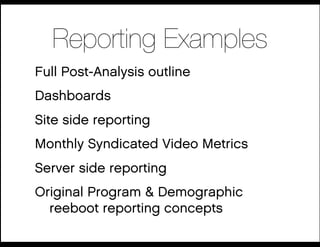
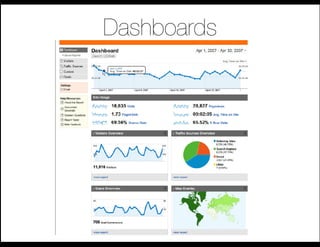
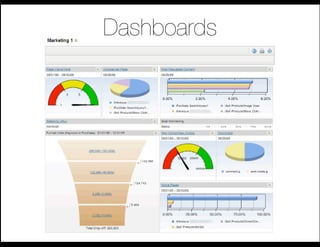
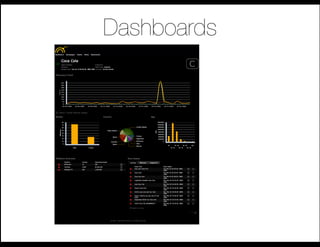
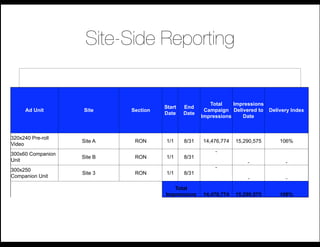
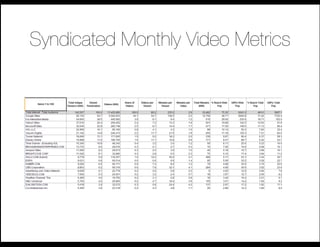
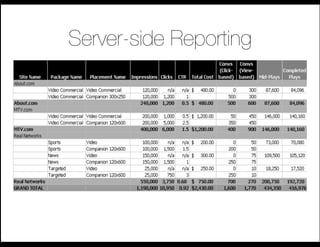
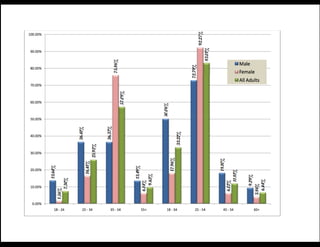
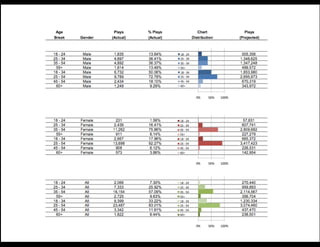
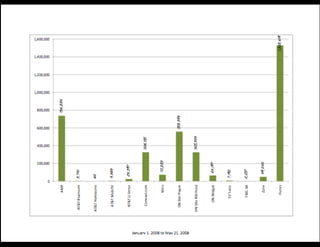
what is analytics?!
9.26.08: an integrated media view of online video measurement.!
agenda
A bird's eye view of the state of emerging media and online
advertising analytics, a pov on gaps and long term needs, and
best-in-class components to consider:

Online and Emerging Media Resources:
Access to a team of ad agency /media professionals with extensive experience across
digital ad campaign strategy, audience-demographic analytics, online-ad tracking and
optimization, TV broadcast buying, and VOD-emerging media vendor management.

Initial Market Assessment:            !
Reporting of the "state of the industry" with an overview of current tracking and analytic
practices. Providing a written top-line to discuss observational point-of-view


Reporting examples where possible, but focus will be downloading you on the media/
 client POV and needs.
Four Uses, One Priority
  Audience Demographic Insight, Validation For Sales Development


 PROOF OF CAMPAIGN PERFORMANCE"
   FOR SPONSORSHIP PROSPECTS"


       Program Optimization for Production Teams"
               Existing Shows, Future Development


 Distributor Performance and Audience Delivery Tracking
what do we need to do?
                     scale for future

                  set the bar higher

      help people “see” the insights

reduce tracking/planning complexity
how do we succeed !

with media people?
make them the hero
give them a solution
what are they living with?
Managed Chaos 


Time is short, workloads high, focus limited
  •    10-20 new companies cold calling digital buyers every day

  •    Communications plans replacing media plans and messaging
       strategies

  •    Balance of turn-key solutions when cookie-cutter, re-purposed
       work will not cut it

  •    Agency roles/points of contact vary by shop and perspectives/
       factors vary by person
Pressured Environment

Clients pressuring agencies
  •    Use data-driven targeting to minimize waste and accountability in
       results to optimize 

  •    Thinking “reach and frequency”, knowing something’s missing...
       Agencies seeking engagement metrics

  •    18-month CMO and commoditization of relationships

  •    Seeking buzz-worthy opportunities, innovation required in every
       plan (at the expense of doing what’s right)
Chaotic Changes
Media metrics and planning shifting from entrenched
  practices:
  •    Shift away from targets being seen as a demo; more to behavior/
       attitudinal selections

  •    Fragmentation though media consumption up on the whole

  •    Non-monetizable, non-commercial vehicles consume their time

  •    Brands getting personal and some met with skepticism, others
       embraced

  •    Relevance versus Reach struggle
Opportunistic Outlook: Online Video
Huge value to video media: power of sight,
  sound, motion
  •    Emotional capabilities in a longer-form 

  •    Familiarity to clients!


Importance of the consumer experience and
  advertiser association
  •    Obtrusiveness of advertising, relevance to viewer

  •    Viewing experience

  •    Video quality
Current Uncertainty: Online Video

Complexity and unknowns
  •    What’s simple, relatable and adaptable sells

  •    Lack of standardization in offerings, ad platforms, reporting!


Varying business models, with bulk of focus in ad-
   supported, pre-roll environments or overlay ads
  •    Confusion and fragmentation stalling progress
what do they expect?
great content, multiple ad units,
managed execution, the right
audience, right pricing, etc.

               (but no deal if you can’t show!
         the numbers, deliver on back-end.)
big promises, poor delivery
disparate reporting!

   no consistency
sales job
business story(intro)


black box
what do they have…!

what do they need?
Benchmarks
Viewership up significantly, skewed by environment
   142MM unique viewers monthly online
       •    Google represents 92MM !


   11.4b videos viewed monthly online
       Google represents almost half of those – 5.04b !

   235 minutes per viewer monthly
       •    2.9 minutes per average viewer!

   Full episode players skew female / short form skew male (Jupiter)


   Gender gap between ages 25-44 (more men than women)
       •    Product of content historically offered online (male-focused)
       •    Men navigation focused (search), Women direct (specific property)
Current Reporting Practices
      Reporting varies widely across platforms (online video, VOD, mobile) and
      providers within each platform
            • Site side, server side, distribution channel, etc.
      Capabilities for richer metrics are available, but not always included in
      reporting
            • Differences in metrics priorities, sensitivity / knowledge of what advertisers want / need
      Below are baseline metrics typically offered by each platform

                                               "Expected" / Current Metrics

ONLINE                                             Video on Demand                        MOBILE
Total Impressions                                  Total VOD - enabled HH universe        Impressions
Unique Impressions                                 Total Set top box views                Clicks
Average Frequency                                  Unique Set top box views               WAP visits
Share of Voice                                     Orders by DMA                          Data by carrier
Click Thru Rate (by ad element and overall)        Time Spent with video                  Opt-ins, sign-ups, etc.
Time Spent with overlays/video, etc.               Linear :30 impressions (promo units)
Metrics by Creative Element
Expect to see reports on a     monthly basis
Discovery Process
Key Media Process Points
Reporting Roadmap
     Must Have / Expected
                        Nice to Have
                         “Dream to Have”
                                                                                                      
- Accepting Agency Tracking           - Viewer “trick-play”"                -    Unique Impressions
  tags
                                 (pause, play-back, etc.)
- Total Impressions
                                                        - 
                                      - Proprietary “Engagement Factor”
 recency
 frequency, loyalty,
                                                                             Average

- Share of Voice
                     - Custom reporting based on        -  Time of day, day of week & other
- Clicks generated
                     advertiser’s needs
                                                                         trending data
- CTR (Overall and by ad unit)
       - Advanced custom studies;         -  Performance by IP address data
                                        correlating advertising impact on
- Time Spent by ad unit
                actual reported behavior
           (Geography/Browser/ISP)

- Metrics by Creative Execution
      - Single customer view 
            -  Site Research (traffic, trending,
                                                                          usage, user base, time spent,
- Demographic Metrics by any          - Single reach, frequency value x- content ranking, composition)
  segmentation purchased
               platform
                                                                          -  Viral, pass-along activity
- Cost factors associated with all    - Performance by Registration data
 -  Content / content genre / format
  metrics (CPM, CPC, etc.)
                                      - 3 screen impact
                  popularity / ranking
- Monthly and/or post-campaign        - Common metrics / language
        -  Referring sites or data by
  reporting
                                      - Email or Mobile Alerts
           syndicated partner

                                      - Dashboard capabilities
           -  Custom studies (user interaction
                                                                          with content/ads, attitudes)
                                      - Real-time results
                -  Historical case studies
                                      - Advertiser accessibility
         -  KPI metrics benchmarks
                                      - Optimization
                     -  Custom reporting windows
Third Party Tracking

Third-party ad-serve (Atlas, DoubleClick, etc.):
  •    Interactive RFP management tool

  •    Creative warehouse and trafficking center

  •    Independent campaign auditor (impressions, clicks, pricing structure,
       spend) for campaign tracking and billing

  •    Campaign data warehouse and reporting system
2.) As ESPN page loads,
                                      ESPN calls 3rd party ad
                                    server for an advertisers ad      How Third-party Tracking
       1.) Consumer
      visits web site
                                                                              works
        (ESPN.com)


                                                                                  3.) Ad-server view IP
                                                                              addresses and determines
                                                                              the appropriate ad to serve
                                                                                based on any targeting
                                                                                         criteria
                                                                    Atlas
                                                                   Servers
4.) Server delivers banner
 to ESPN and counts the
        impression


When banners are delivered:
       •  Impressions recorded
                   When consumers click on banners
       •  Users cookied 
                                •  Clicks are recorded
       •  Post-impression Action Tag activity            •  Post-click Action Tag activity data can be
           data can be collected
                            collected
Reporting Examples
Full Post-Analysis outline
Dashboards
Site side reporting
Monthly Syndicated Video Metrics
Server side reporting
Original Program & Demographic
  reeboot reporting concepts
BEST IN CLASS REPORTING:
  • 23-page spiral bound report including a CD with supplemental information.
  • 4 page Executive Summary

Background
  • Overview of ad units & type of inventory
  • Review of partner creative (1pg)

Overall Data:
  • Total Unique Viewers by Region by Month
  • Total Unique Viewers by Region % of total
  • Unique Viewer Month-to-Month Growth (% increase/decrease)
  • Number of Sessions per Unique per Region per Month
  • Number of Sessions per Month per Region per Month
  • Time Spent per Unique per Region per Month
  • Time Spent per Month Total per Region per Month
  • Hours of Available content
  • Hours of Content by Genre and Channel
BEST IN CLASS REPORTING: (cont)
Campaign Data:
  • Review of Monthly reports delivered during campaign:
     • Impression delivery by inventory element/ad unit
     • Audience size
     • Share of Voice
     • Click-Through Rates
     • Geographical Breakdown
     • Impression delivery by content channel

  • Total impressions delivered by ad unit over campaign

  • Campaign reach (raw) and frequency

  • (Note: also added a multiplier to account for co-viewing to achieve!
   a “true reach” number)!

  • Delivery Summary of Impressions, Clicks, Frequency by Month
BEST IN CLASS REPORTING: (cont)
Third Party Verification and Supplemental Data:
  • Results from third party study conducted simultaneously !
   (7 pages included in report; full results on CD) which included:
     • Brand Awareness
     • Advertising Receptivity & Effectiveness
     • Product Usage & Experience
     • Demographics
     • Technographics
     • Plus advertisers could include custom questions in the study

  • 5 page summary on improvements, roadmap and opportunities for!
   additional participation
Dashboards
Dashboards
Dashboards
Dashboards
Dashboards
Dashboards
Dashboards
Site-Side Reporting


                                                        Total    Impressions
                                      Start   End
      Ad Unit      Site     Section                   Campaign Delivered to    Delivery Index
                                      Date    Date
                                                     Impressions    Date


320x240 Pre-roll
                   Site A    RON      1/1     8/31   14,476,774   15,290,575       106%
Video
                                                          -
300x60 Companion
                   Site B    RON      1/1     8/31
Unit                                                                  -              -
                                                          -
300x250
                   Site 3    RON      1/1     8/31
Companion Unit                                                        -              -
                                         Total
                                      Impressions    14,476,774   15,290,575       106%
Syndicated Monthly Video Metrics
Server-side Reporting
reeboot strategy


 reeboot strategy!
 web & broadcast analytics benchmarking 9.26.08

ReebootWhatIsAnalyticsVideo9.25.08 Slideshare

  • 1.
    what is analytics?! 9.26.08:an integrated media view of online video measurement.!
  • 2.
    agenda A bird's eyeview of the state of emerging media and online advertising analytics, a pov on gaps and long term needs, and best-in-class components to consider: Online and Emerging Media Resources: Access to a team of ad agency /media professionals with extensive experience across digital ad campaign strategy, audience-demographic analytics, online-ad tracking and optimization, TV broadcast buying, and VOD-emerging media vendor management. Initial Market Assessment: ! Reporting of the "state of the industry" with an overview of current tracking and analytic practices. Providing a written top-line to discuss observational point-of-view Reporting examples where possible, but focus will be downloading you on the media/ client POV and needs.
  • 3.
    Four Uses, OnePriority Audience Demographic Insight, Validation For Sales Development PROOF OF CAMPAIGN PERFORMANCE" FOR SPONSORSHIP PROSPECTS" Program Optimization for Production Teams" Existing Shows, Future Development Distributor Performance and Audience Delivery Tracking
  • 4.
    what do weneed to do? scale for future set the bar higher help people “see” the insights reduce tracking/planning complexity
  • 5.
    how do wesucceed ! with media people?
  • 6.
  • 7.
    give them asolution
  • 8.
    what are theyliving with?
  • 9.
    Managed Chaos Timeis short, workloads high, focus limited •  10-20 new companies cold calling digital buyers every day •  Communications plans replacing media plans and messaging strategies •  Balance of turn-key solutions when cookie-cutter, re-purposed work will not cut it •  Agency roles/points of contact vary by shop and perspectives/ factors vary by person
  • 10.
    Pressured Environment Clients pressuringagencies •  Use data-driven targeting to minimize waste and accountability in results to optimize •  Thinking “reach and frequency”, knowing something’s missing... Agencies seeking engagement metrics •  18-month CMO and commoditization of relationships •  Seeking buzz-worthy opportunities, innovation required in every plan (at the expense of doing what’s right)
  • 11.
    Chaotic Changes Media metricsand planning shifting from entrenched practices: •  Shift away from targets being seen as a demo; more to behavior/ attitudinal selections •  Fragmentation though media consumption up on the whole •  Non-monetizable, non-commercial vehicles consume their time •  Brands getting personal and some met with skepticism, others embraced •  Relevance versus Reach struggle
  • 12.
    Opportunistic Outlook: OnlineVideo Huge value to video media: power of sight, sound, motion •  Emotional capabilities in a longer-form •  Familiarity to clients! Importance of the consumer experience and advertiser association •  Obtrusiveness of advertising, relevance to viewer •  Viewing experience •  Video quality
  • 13.
    Current Uncertainty: OnlineVideo Complexity and unknowns •  What’s simple, relatable and adaptable sells •  Lack of standardization in offerings, ad platforms, reporting! Varying business models, with bulk of focus in ad- supported, pre-roll environments or overlay ads •  Confusion and fragmentation stalling progress
  • 14.
    what do theyexpect?
  • 15.
    great content, multiplead units, managed execution, the right audience, right pricing, etc. (but no deal if you can’t show! the numbers, deliver on back-end.)
  • 16.
  • 17.
    disparate reporting! no consistency
  • 18.
  • 19.
  • 20.
    what do theyhave…! what do they need?
  • 21.
    Benchmarks Viewership up significantly,skewed by environment 142MM unique viewers monthly online •  Google represents 92MM ! 11.4b videos viewed monthly online Google represents almost half of those – 5.04b ! 235 minutes per viewer monthly •  2.9 minutes per average viewer! Full episode players skew female / short form skew male (Jupiter) Gender gap between ages 25-44 (more men than women) •  Product of content historically offered online (male-focused) •  Men navigation focused (search), Women direct (specific property)
  • 22.
    Current Reporting Practices Reporting varies widely across platforms (online video, VOD, mobile) and providers within each platform • Site side, server side, distribution channel, etc. Capabilities for richer metrics are available, but not always included in reporting • Differences in metrics priorities, sensitivity / knowledge of what advertisers want / need Below are baseline metrics typically offered by each platform "Expected" / Current Metrics ONLINE Video on Demand MOBILE Total Impressions Total VOD - enabled HH universe Impressions Unique Impressions Total Set top box views Clicks Average Frequency Unique Set top box views WAP visits Share of Voice Orders by DMA Data by carrier Click Thru Rate (by ad element and overall) Time Spent with video Opt-ins, sign-ups, etc. Time Spent with overlays/video, etc. Linear :30 impressions (promo units) Metrics by Creative Element Expect to see reports on a monthly basis
  • 23.
  • 24.
  • 25.
    Reporting Roadmap Must Have / Expected Nice to Have “Dream to Have” - Accepting Agency Tracking - Viewer “trick-play”" -  Unique Impressions tags (pause, play-back, etc.) - Total Impressions -  - Proprietary “Engagement Factor” recency frequency, loyalty, Average - Share of Voice - Custom reporting based on -  Time of day, day of week & other - Clicks generated advertiser’s needs trending data - CTR (Overall and by ad unit) - Advanced custom studies; -  Performance by IP address data correlating advertising impact on - Time Spent by ad unit actual reported behavior (Geography/Browser/ISP) - Metrics by Creative Execution - Single customer view -  Site Research (traffic, trending, usage, user base, time spent, - Demographic Metrics by any - Single reach, frequency value x- content ranking, composition) segmentation purchased platform -  Viral, pass-along activity - Cost factors associated with all - Performance by Registration data -  Content / content genre / format metrics (CPM, CPC, etc.) - 3 screen impact popularity / ranking - Monthly and/or post-campaign - Common metrics / language -  Referring sites or data by reporting - Email or Mobile Alerts syndicated partner - Dashboard capabilities -  Custom studies (user interaction with content/ads, attitudes) - Real-time results -  Historical case studies - Advertiser accessibility -  KPI metrics benchmarks - Optimization -  Custom reporting windows
  • 26.
    Third Party Tracking Third-partyad-serve (Atlas, DoubleClick, etc.): •  Interactive RFP management tool •  Creative warehouse and trafficking center •  Independent campaign auditor (impressions, clicks, pricing structure, spend) for campaign tracking and billing •  Campaign data warehouse and reporting system
  • 27.
    2.) As ESPNpage loads, ESPN calls 3rd party ad server for an advertisers ad How Third-party Tracking 1.) Consumer visits web site works (ESPN.com) 3.) Ad-server view IP addresses and determines the appropriate ad to serve based on any targeting criteria Atlas Servers 4.) Server delivers banner to ESPN and counts the impression When banners are delivered: •  Impressions recorded When consumers click on banners •  Users cookied •  Clicks are recorded •  Post-impression Action Tag activity •  Post-click Action Tag activity data can be data can be collected collected
  • 28.
    Reporting Examples Full Post-Analysisoutline Dashboards Site side reporting Monthly Syndicated Video Metrics Server side reporting Original Program & Demographic reeboot reporting concepts
  • 29.
    BEST IN CLASSREPORTING: • 23-page spiral bound report including a CD with supplemental information. • 4 page Executive Summary Background • Overview of ad units & type of inventory • Review of partner creative (1pg) Overall Data: • Total Unique Viewers by Region by Month • Total Unique Viewers by Region % of total • Unique Viewer Month-to-Month Growth (% increase/decrease) • Number of Sessions per Unique per Region per Month • Number of Sessions per Month per Region per Month • Time Spent per Unique per Region per Month • Time Spent per Month Total per Region per Month • Hours of Available content • Hours of Content by Genre and Channel
  • 30.
    BEST IN CLASSREPORTING: (cont) Campaign Data: • Review of Monthly reports delivered during campaign: • Impression delivery by inventory element/ad unit • Audience size • Share of Voice • Click-Through Rates • Geographical Breakdown • Impression delivery by content channel • Total impressions delivered by ad unit over campaign • Campaign reach (raw) and frequency • (Note: also added a multiplier to account for co-viewing to achieve! a “true reach” number)! • Delivery Summary of Impressions, Clicks, Frequency by Month
  • 31.
    BEST IN CLASSREPORTING: (cont) Third Party Verification and Supplemental Data: • Results from third party study conducted simultaneously ! (7 pages included in report; full results on CD) which included: • Brand Awareness • Advertising Receptivity & Effectiveness • Product Usage & Experience • Demographics • Technographics • Plus advertisers could include custom questions in the study • 5 page summary on improvements, roadmap and opportunities for! additional participation
  • 32.
  • 33.
  • 34.
  • 35.
  • 36.
  • 37.
  • 38.
  • 39.
    Site-Side Reporting Total Impressions Start End Ad Unit Site Section Campaign Delivered to Delivery Index Date Date Impressions Date 320x240 Pre-roll Site A RON 1/1 8/31 14,476,774 15,290,575 106% Video - 300x60 Companion Site B RON 1/1 8/31 Unit - - - 300x250 Site 3 RON 1/1 8/31 Companion Unit - - Total Impressions 14,476,774 15,290,575 106%
  • 40.
  • 41.
  • 45.
    reeboot strategy reebootstrategy! web & broadcast analytics benchmarking 9.26.08