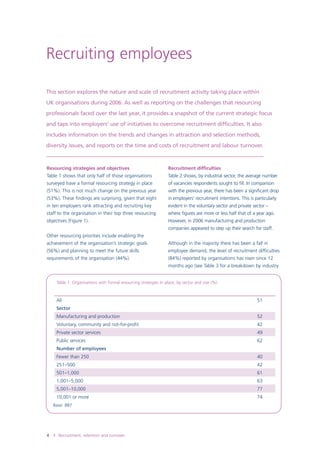
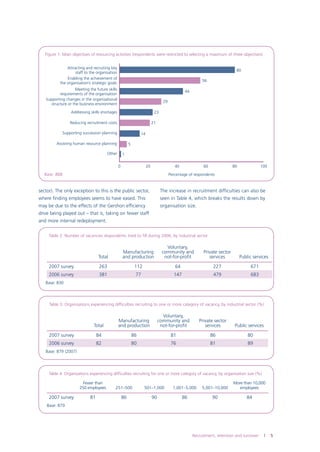
The annual survey report found that:
1) Half of organizations surveyed have a formal recruiting strategy, and the main objective is attracting key staff.
2) While recruitment intentions decreased overall last year, 84% of organizations still experienced recruiting difficulties, mainly due to a lack of specialist skills.
3) Common initiatives to overcome difficulties include appointing underqualified candidates with potential and providing additional training.
4) Most organizations use recruitment agencies, mainly for temporary and permanent hiring. Cutting costs and direct hiring are reasons for reducing agency use.
Study on Benchmarking with Respect to Recruitment ParametersIJMTST Journal
Benchmarking of the recruitment parameters is indeed the process by which, an organization can compare
its recruitment parameters and policies. As the employee is an undividable but the most important part of an
organization, it is the main component in an organizations growth and success. Thus, at certain point in time,
every organization needs to evaluate its recruitment strategies in accordance to hire the skillful and most
productive workforce. Today organizations should measure to confirm whether you are employing effectively
or not, you would end up spending most of time measuring recruiting activities instead of actually recruiting.
Benchmarking of recruitment parameters will help organization how business is doing on the talent
management front.
Employee retention startegies in Pharmaceutical companies:Case of lebanonBassima Hazima
The document discusses employee retention strategies in the pharmaceutical industry in Lebanon. It begins by outlining the importance of understanding the root causes of employee turnover. The research aims to assess the opinions of Lebanese pharmaceutical employees regarding the retention strategies used by their companies. A survey was conducted of 204 employees across 30 companies. The survey examined factors like compensation, career development, work environment, leadership, and organizational culture. The results showed areas of both satisfaction and dissatisfaction among employees. For example, over 50% were satisfied with their benefits but only 52% felt they had sufficient training opportunities. The research provides Lebanese pharmaceutical companies with insights to help them develop more effective employee retention strategies.
This document summarizes the findings of a SHRM survey on global competition and hiring strategies. Key findings include:
- Over half of organizations used social media to deal with recruiting challenges, followed by collaborating with educational institutions and expanding advertising. Larger organizations were more likely to use these strategies.
- 14% of organizations believed they faced global competition for hard-to-fill jobs, with high-tech most likely to see this. One-fifth sponsored foreign workers and 8% hired through other visas to fill positions.
- 64% of organizations hired US veterans, up from previous years. Government agencies were most likely to hire veterans for hard-to-fill roles.
The document analyzes
A Barometer of HR Trends and Prospects 2013 by CIPDElizabeth Lupfer
The CIPD conducts annual surveys of HR professionals in the UK to track trends in areas such as resourcing and talent planning, reward management, learning and development, and absence management. The 2012 surveys found that while recruitment difficulties remained high, organizations were increasingly focused on retaining existing talent. Training budgets had declined for many organizations since the previous year. Overall the surveys provided a benchmark for practitioners to gauge challenges in attracting and developing talent amid ongoing economic uncertainty.
This document summarizes the findings of a SHRM survey on recruiting and skills gaps. Some key findings include:
- 50% of organizations had difficulty recruiting for full-time positions in the past year, with manufacturing, healthcare, high-tech, and professional services most affected.
- The top reasons for difficulty were lack of needed work experience, technical skills, and competition from other employers. High-tech employers particularly noted a lack of technical skills.
- The most difficult jobs to fill were engineers, medical professionals, IT specialists, scientists, and managers - positions requiring highly specialized skills.
- Common skills gaps in applicants were basic computer skills, writing, English language proficiency, reading comprehension, and math. Critical
The survey found that while the percentage of organizations engaging in sustainable workplace practices has remained stable over the last two years, there were some small declines in certain socially and environmentally responsible activities. However, there was a slight increase in organizations calculating a positive return on investment from their sustainability efforts. Key findings included that about 72% of organizations engage in sustainability, and it is seen as important for attracting and retaining talent. Large organizations and those in certain sectors were more likely to have sustainability policies and practices.
The Ongoing Impact of the Recession—Recruiting and Skill Gapsshrm
Two-thirds (66%) of organizations that are currently hiring full-time staff indicated that they are having a difficult time recruiting for specific job openings, an increase from 52% reported in 2011. HR professionals indicated that the top four applied skills gaps for job applicants are critical thinking/problem solving (53%), professionalism/work ethic (46%), written communications (41%) and leadership (38%).
This document summarizes the results of a 2013 HR challenges survey conducted with 164 organizations globally. The top challenge reported overall was retaining key talent/high performers/potentials (45%). When analyzed by region, Asian organizations reported talent retention as their top challenge (55%), while Turkish organizations reported measuring HR effectiveness as their top challenge (40%) and North American organizations reported talent retention as their top challenge (46%). The document provides detailed rankings of HR challenges for the overall responses and for the Asia, Turkey, and North America regional analyses.
SHRM Poll on Personality Tests for the Hiring and Promotion of Employeesshrm
The majority (82%) of organizations do not use personality tests for hiring or promoting employees. Of the organizations that do use them, they are most commonly used for mid-level managers (56%), executives (45%), and entry-level exempt jobs (43%). Most HR professionals (71%) believe personality tests can be useful for predicting job-related behavior or organizational fit. The majority (56%) of organizations administer personality tests online.
The Ongoing Impact of the Recession—California Recruiting and Skill Gapsshrm
The document summarizes the findings of a survey conducted by SHRM on recruiting challenges and skill gaps in California. Some of the key findings include:
- Over two-thirds of organizations found it difficult to recruit for new positions requiring new skills. Nearly two-thirds also had difficulty recruiting for specific jobs.
- Common reasons for difficulty included candidates lacking the right skills, experience, or being outside the salary range. Competition from other employers was also cited.
- Surveyed organizations reported skills gaps among applicants in areas like writing, English proficiency, critical thinking, and technical skills. Healthcare, engineering and scientific roles were the most difficult to fill.
- The survey found that 65% of organizations will hold an end-of-year holiday party open to all employees, though smaller organizations are more likely to do so than larger ones. Four-fifths of organizations holding a party have a budget for it. Two-thirds of parties will be held offsite. About three-fifths of organizations plan to serve alcohol at parties.
Chain Reaction - Making Recruitment Supply Chain WorkDan Cooper
This document discusses resource supply chain models used for recruitment. It finds that the preferred supplier list (PSL) model is the most widely used (48% of organizations), followed by recruitment process outsourcing (RPO) (38%) and master vendor (26%). Nearly half of organizations use a single model. The top priorities for organizations in choosing a model are attracting the right people (67%), reducing costs (42%), and reducing time to hire (39%). While PSL is most common, master vendor is perceived as most effective for candidate experience, efficiencies, and process management. As models mature, organizations want more strategic partnerships from suppliers, but often focus too much on cost and transactional metrics. Overall suppliers need
This SHRM survey found that most organizations do not have policies addressing office pools. While some policies prohibit gambling involving monetary exchanges, few organizations enforce these policies. The top events for office pools were the Super Bowl and NCAA basketball tournament. HR professionals perceived positive impacts of office pools like relationship building, but some noted increased absences after major events, particularly for male employees after the Super Bowl.
The document summarizes the key findings of a SHRM survey on 2013 holiday and year-end activities. It found that about two-thirds of organizations hold end-of-year parties for employees, with 60% being off-site. Nearly half of organizations do not participate in gift exchanges, while 78% participate in charitable donations. The survey provides details on party attendance, budgets, and other policies for 817 HR professionals in October-November 2013.
2015 Strategic Benefits―Flexible Work Arragementsshrm
The SHRM survey found that about half of organizations provide flexible work arrangements (FWAs) as an option. Of those, about half indicate that over half of employees have access to FWAs. For organizations offering FWAs, 29% saw increased employee participation in the past year and 29% saw increased employee productivity since implementing FWAs. The survey also provides details on the responding organizations' industries, sizes, and geographic reach.
This document summarizes the findings of a survey by the Society for Human Resource Management (SHRM) on recruiting and skills gaps in California. Some of the key findings include:
- About half of California organizations reported difficulty recruiting for full-time positions in the past year, most commonly due to candidates lacking technical skills, work experience, or competition from other employers.
- The most difficult positions to fill were scientists, engineers, managers, IT specialists, and medical professionals. California organizations found it more difficult to recruit educators than the rest of the U.S.
- Common skills gaps among candidates were in writing, computer skills, English language proficiency, critical thinking, and professionalism/work ethic.
The document summarizes key findings from a SHRM survey on the aging workforce. Some of the main findings include:
- HR professionals see the top advantages of older workers as their experience, maturity, and strong work ethic.
- The strongest basic skills of older workers are seen as writing, reading comprehension, and spoken English. The strongest applied skills are professionalism, critical thinking, and lifelong learning.
- Many organizations are increasing training to address potential skills gaps from retiring older workers, but 1/3 have taken no steps to prepare.
- Over half of organizations are using knowledge transfer strategies like training programs to share older workers' knowledge with younger employees.
- The majority of organizations (66%) prefer chronological resumes but government agencies prefer functional resumes more (30% vs 18% for private sector).
- Government agencies and smaller organizations are more likely to consider missing a cover letter a mistake. The most important aspects for a cover letter are how the candidate's experience and skills meet the job requirements and why they want to work there.
- Government agencies prefer panel and structured interviews while private sector prefers semi-structured and screening interviews. Larger employers also prefer structured interviews and online interviews.
The survey found that:
1) Health care and retirement benefits were most frequently leveraged to retain employees at all levels, while these benefits plus flexible working are expected to increase in importance for retention.
2) Health care, professional development, and retirement benefits were most used to retain highly skilled and high-performing employees, and retirement benefits and flexible working will grow in importance for highly skilled employee retention.
3) One in five organizations leveraged benefits for retaining employees at all levels and highly skilled or high-performing staff.
2015 Strategic Benefits―Assessment and Communication of Benefitsshrm
The SHRM 2015 Strategic Benefits Survey assessed how organizations communicate and evaluate employee benefits. Key findings include:
1) Health care remains the most important benefit but may decrease in importance over time. Half of organizations increased health care investment but controlling costs is a top strategic focus.
2) Most employees have some knowledge of benefits but many organizations do not assess this. Common communication methods are materials and group sessions, though few use social media.
3) Many reported communication efforts are effective but budgets and assessment of employee understanding vary. While interest in social media is growing, few currently use it for benefits communication.
This survey from SHRM and Globoforce examines employee recognition trends and best practices. Nearly half of HR professionals view employee engagement as the top challenge. Organizations believe positive feedback improves performance more than negative feedback. Most conduct annual reviews and feel supervisor plus peer feedback provides a more accurate performance picture than supervisor alone. Crowdsourcing recognition data and social recognition are gaining interest but current review processes are only somewhat effective according to respondents. Common talent challenges include leadership development, retention, and responding to skills gaps.
SHRM/Ascendo Resources: The Importance of Social Media for Recruiters and Job...shrm
This research, conducted in collaboration with Ascendo Resources, looks at the importance of having a social media presence for job seekers, as well as social media strategies HR professionals use for recruitment. Overall, 87% of HR professionals said it was either very or somewhat important for job seekers to have a social media presence on LinkedIn, and 83% agreed it was important to be on a relevant professional or association social networking site. In the past year, nearly two-thirds of organizations (65%) had hired new employees who were sourced through social media sites.
HR Headcount per Total Headcount Survey Report-2012Emre Kavukcuoglu
The document provides a summary of a global HR headcount survey conducted in 167 organizations from 7 continents. Some key findings include:
- The overall HR headcount to total employee ratio was 113 employees per HR professional. Middle East companies had the highest ratio at 203 while North America was 132.
- When analyzed by industry, the retail industry had the highest ratio of 275 employees per HR professional. Healthcare and government also had ratios over 200.
- Larger companies with over 1,000 employees generally had higher HR headcounts compared to total employees than the global average.
SHRM’s 2014 Strategic Benefits Survey: Leveraging Benefits to Recruit Employeesshrm
The SHRM survey found that organizations leverage benefits programs to recruit employees in similar ways for all employee levels and highly skilled employees. Health care and retirement benefits were most commonly leveraged. HR professionals believe benefits emphasizing career development, health care and retirement will remain important for recruitment. Flexible work and preventative health may increase in importance for recruitment in the future. Benefits offerings could begin to diverge or expand more for hard-to-recruit roles depending on budget and skills shortages.
Strategic Benefits--Leveraging Benefits to Retain Employeesshrm
SHRM’s 2014 Strategic Benefits Survey collected data on how organizations leverage benefits to retain employees, including employees at all levels of the organization, highly skilled employees and high-performing employees.
This research found that about one-quarter (24%-26%) of respondents indicated their organization leveraged their benefits program to retain employees at all levels of the organization, highly skilled employees and high-performing employees in the past 12 months.
Health care was the benefit most frequently cited as being leveraged to retain employees at all levels of the organization (74%), high-performing employees (60%) and highly skilled employees (70%). Retirement savings and planning were also frequently cited as being leveraged to retain employees at all levels of the organization (62%) and high-performing employees (54%), whereas more respondents indicated their organization leveraged leave benefits and flexible working benefits (both 53%) to retain highly skilled employees.
2015 Strategic Benefits—Leveraging Benefits to Recruit Employeesshrm
The SHRM survey found that organizations are increasingly leveraging benefits to recruit employees at all levels. About two-fifths of respondents reported difficulty recruiting employees in 2015, up from previous years. Similarly, two-fifths reported leveraging benefits for recruitment, also up over time. Looking ahead, respondents believed health care, retirement, flexible work and other benefits would grow in importance for recruitment. Recruiting highly skilled employees was also increasingly difficult, and benefits were more often leveraged for this group. Health care was viewed as most important for highly skilled recruitment going forward.
SHRM Survey Findings: Using Social Media for Talent Acquisition—Recruitment a...shrm
SHRM surveyed HR professionals with the job function of employment or recruitment to learn more about organizations’ use of social media for talent acquisition. Specifically, this report focuses on recruitment and screening of job candidates. It also looks at trends over time, comparing the results to data from 2011 and 2013 when possible.
This SHRM survey found that the majority (74%) of organizations saw increased health care costs in 2011 compared to 2010. Most organizations (84%) are very concerned about controlling costs. Common cost-control activities include increasing employee contributions, wellness initiatives, and generic drug programs. Nearly half (47%) of organizations increased employee contributions in 2012, and 22% plan increases in 2013. Looking ahead, 15% believe employees will pay most costs within 3-5 years.
The Impact of Recruiting and Hiring on Order Management and Delivery Performa...Randstad USA
Today’s manufacturing and logistics operations are at the center of rapidly evolving industry
trends that impact operational efficiency and influence customer retention. In particular, the
intricacies of inventory management and order fulfillment have escalated as both order and
distribution channels proliferate and customers demand faster and less expensive delivery options.
This survey report from SHRM summarizes strategies organizations have used to deal with recruiting challenges for full-time regular positions. The top strategies included using social media (54%), collaborating with educational institutions (48%), and expanding advertising efforts (41%). Larger organizations were more likely than smaller ones to use social media and collaborate with schools. High-tech and professional services firms most commonly used social media. While 14% of organizations felt they faced global competition for hard-to-fill jobs, high-tech firms were most likely to feel this (37%). One-fifth of organizations sponsored foreign workers on H-1B visas, with high-tech most likely to do so (51%). Nearly two-thirds of organizations hired
The document discusses the benefits of outsourcing recruitment processes through a recruitment process outsourcing (RPO) provider. It outlines key reasons for outsourcing such as gaining access to a larger talent pool, increasing innovation and expertise, and improving supplier and process management. The document also summarizes the benefits an RPO provider like ManpowerGroup Solutions can provide, including standardized global recruitment processes, harnessing new recruitment technologies and tools, and helping to reduce costs.
Lotis Blue Consulting conducted a research study to understand how Talent Acquisition functions are organized and investing in sourcing strategies and technology to meet current demands and prepare for a post-pandemic hiring boom.
The Society for Human Resource Management (SHRM®), the world’s largest association devoted to human resource management, has collaborated with Globoforce® on a series of surveys about employee recognition. Our goal is to elicit trends among HR leaders and practitioners about what challenges they face and what strategies help them conquer those challenges. In the 2015 survey, 80% of organizations indicated they have an employee recognition program, and more than one-half (58%) have a program that is tied to their organization’s values. Overall, respondents said employee recognition programs had a positive impact on employee engagement, happiness and workplace relationships, but the impact was perceived to be greater for those with values-based programs.
WTW: Employers look to modernize the employee value propositioniebanl
Under pressure to modernize and remain competitive in attracting talent, employers are looking to update their employee value proposition (EVP). The rapid rise of technology is disrupting jobs and skills needs. Organizations must actively monitor these changes and adapt their human capital programs. While hiring and turnover are increasing globally, attraction and retention challenges persist, especially for critical skills, high potentials, and top performers. To be successful, organizations must understand what employees truly value for job security and career development. The pace of modernizing EVPs will determine which organizations can best compete for high-value talent.
This document summarizes key findings from the 2012 Recruiting Benchmarks Survey conducted by the National Association of Colleges and Employers (NACE). Some of the main findings include:
1) Approximately 68% of respondents only recruit within the US for US operations, while 26% recruit both within the US and internationally for both US and international operations.
2) On average, 51.6% of entry-level hires in 2011-12 were new college graduates, up from 45% in 2010-11. Bachelor's degree graduates accounted for 76% of college hires, down from over 81% previously.
3) Over three-quarters of respondents have a college relations and recruiting department, with
Research on Current Trends in HR Marketing in the Czech republic 2015 - The 16-question on-line
research was conducted via a web platform between 9 February and 27 February 2015 and included 140 respondents, which was 40% more than last year. The research focused on two concepts: HR marketing and the employer’s brand. Let’s explain the concepts.
Commercial On-Boarding Excellence: Bringing New Employees up to Productivity ...Best Practices
This document provides an overview of a benchmark study conducted by Best Practices, LLC on onboarding programs at major pharmaceutical, biotech, and medical device companies. The study found:
- Commercial functions like sales and marketing make up the largest group onboarded, around 36% of employees.
- Getting employees to productivity quickly is a primary goal of onboarding programs.
- Technology training and collecting new hire feedback are seen as very important to onboarding program success.
- Onboarding programs typically provide technology training in less than a day.
An Applicant Tracking System (ATS) helps talent acquisition experts manage and organize the hiring process. This PDF comprises of the key findings of the survey conducted to understand the state of Applicant Tracking Systems in 2020. It also includes details about how prevalent applicant tracking systems are and the benefits of using an ATS. If you're looking for an applicant tracking and recruiting software, visit us at https://www.emptrust.com/ats/applicant-tracking-and-recruiting-software.aspx.
Unlocking Success: Recruitment Trends and the Positive Leader AdvantageEmilyGore7
The document discusses recruitment trends for 2023 and introduces the Positive Assessment Tool for hiring. It covers the following key points:
- New employees reach 25% productivity in month one, 50% in month two, and 75% in month three, showing the importance of effective onboarding. Remote work and data-driven hiring are also on the rise.
- Bad hires can cost organizations up to 300% of the employee's salary due to high turnover. Nearly a quarter of new hires leave within the first year.
- The Positive Assessment Tool provides holistic candidate evaluation of values, personality, and culture fit to reduce risk and increase retention. It also enables personalized onboarding based on strengths.
Career management-making-it-work-for-employees-and-employers-towers-watsonVioleta Mariana Bus
The document discusses challenges with career advancement opportunities within organizations. It notes that 41% of employees feel they must change companies to advance, and 40% of high-potential employees feel the same. The document then outlines steps organizations can take to improve their career management programs, including defining a career strategy, building a foundation with a career framework and competency models, and providing development opportunities and visible career paths. Overall, it argues that better career management is needed to attract, engage, and retain top talent.
2015 Strategic Benefits—Leveraging Benefits to Retain Employeesshrm
The survey found that more organizations are struggling to retain employees at all levels and are increasingly leveraging benefits programs to do so. Specifically:
- Over 1/3 of organizations reported difficulty retaining employees at all levels in 2015, up from 25% in 2012.
- 1/3 of organizations said they used benefits to retain employees at all levels in 2015, up from 20% in 2012.
- Health care and retirement benefits were most often leveraged to retain employees.
The findings suggest HR professionals should focus on health care and retirement benefits when designing retention strategies using benefits programs.
Seven HR Capabilities that Drive Performance Leadership - Hackett Group June ...Nhat Nguyen
The 2015 analysis of The Hackett Group’s HR benchmarking database quantifies the performance advantage of world-class companies compared to typical HR organizations. Among the results: world-class HR organizations spend 37 percent less (Figure 1) – up to $17 million for the typical company1 and use 31 percent fewer FTEs (Figure 2) than peers. Analysis also revealed the hallmarks of current world-class HR organizations and the critical capabilities they leverage to achieve superior results.
The document discusses trends and challenges in talent management in the healthcare industry. It notes that healthcare is the largest employer in the US but faces challenges in attracting and retaining talent. It recommends that healthcare organizations implement strategic talent management practices like workforce planning, leadership development, and performance management to improve recruitment, retention, and financial outcomes. Integrating talent management strategies and processes across the organization is critical for healthcare providers to prepare for future talent needs.
Linkedin global recruiting trends report 2017Pierre Bernard
Why read this ?
In order to plan for the future, you need to understand where
you stand compared to your peers. The goal of this report
is exactly that -- to help talent leaders like you benchmark
against teams across the globe when it comes to the most
important recruiting metrics and trends.
About this survey
This report is based on the survey responses of nearly 4,000
corporate talent acquisition leaders across 35 countries. All
respondents are at the manager level or higher.
Recruiting leaders surveyed globally reported the following key trends:
1. Recruiting teams play a crucial role in companies' futures and talent is the top priority, though most teams' sizes will remain the same.
2. Hiring volume will increase for many, with a focus on sales, operations, and engineering roles. Quality of hire and time to fill remain top metrics.
3. Most recruiting budgets are spent on traditional tactics like job boards and agencies, though leaders want to invest more in branding and tools.
4. Employer branding has significant impact on hiring but receives limited budgets; culture messaging attracts candidates' interest the most.
5. Key future trends include increasing diversity, automation
In this rapidly changing global business environment—where cost is a true strategic differentiator—Deloitte’s first global cost management survey report provides an inside look at the practices and trends currently shaping the future of business, with detailed insights from more than 1,000 C-level executives and senior management in four major regions: the United States (US), Latin America (LATAM), Europe (EU), and Asia Pacific (APAC). http://deloi.tt/2kUWuaw
The document is the 2015 North East Salary Survey conducted by Nigel Wright Recruitment, which analyzed data from over 1,000 respondents on average salaries, benefits, job satisfaction, and factors influencing job changes in the North East region of the UK. The survey provides an overview of compensation trends and benchmarks salaries and benefits across various employment types, industries, job levels and disciplines to help organizations with recruitment strategies and individuals understand market rates.
Skill development training is important for economic development and poverty alleviation in Bangladesh. There are 19 ministries and 18 organizations that provide technical and vocational education and training (TVET) programs. The Bureau of Manpower, Employment and Training (BMET) operates 37 technical training centers that provide 2-year certificate courses and 4-year diploma programs in trades like engineering, electronics, and construction. BMET also partners with industries to provide apprenticeship training. Their training programs help place graduates in local jobs (30%) as well as overseas employment (40%), self-employment (15%), and higher education (15%). Expanding TVET is important to meet the growing demand for skilled workers both domestically and abroad, especially
5 Tips for Creating Standard Financial ReportsEasyReports
Well-crafted financial reports serve as vital tools for decision-making and transparency within an organization. By following the undermentioned tips, you can create standardized financial reports that effectively communicate your company's financial health and performance to stakeholders.
In a tight labour market, job-seekers gain bargaining power and leverage it into greater job quality—at least, that’s the conventional wisdom.
Michael, LMIC Economist, presented findings that reveal a weakened relationship between labour market tightness and job quality indicators following the pandemic. Labour market tightness coincided with growth in real wages for only a portion of workers: those in low-wage jobs requiring little education. Several factors—including labour market composition, worker and employer behaviour, and labour market practices—have contributed to the absence of worker benefits. These will be investigated further in future work.
Falcon stands out as a top-tier P2P Invoice Discounting platform in India, bridging esteemed blue-chip companies and eager investors. Our goal is to transform the investment landscape in India by establishing a comprehensive destination for borrowers and investors with diverse profiles and needs, all while minimizing risk. What sets Falcon apart is the elimination of intermediaries such as commercial banks and depository institutions, allowing investors to enjoy higher yields.
Independent Study - College of Wooster Research (2023-2024) FDI, Culture, Glo...AntoniaOwensDetwiler
"Does Foreign Direct Investment Negatively Affect Preservation of Culture in the Global South? Case Studies in Thailand and Cambodia."
Do elements of globalization, such as Foreign Direct Investment (FDI), negatively affect the ability of countries in the Global South to preserve their culture? This research aims to answer this question by employing a cross-sectional comparative case study analysis utilizing methods of difference. Thailand and Cambodia are compared as they are in the same region and have a similar culture. The metric of difference between Thailand and Cambodia is their ability to preserve their culture. This ability is operationalized by their respective attitudes towards FDI; Thailand imposes stringent regulations and limitations on FDI while Cambodia does not hesitate to accept most FDI and imposes fewer limitations. The evidence from this study suggests that FDI from globally influential countries with high gross domestic products (GDPs) (e.g. China, U.S.) challenges the ability of countries with lower GDPs (e.g. Cambodia) to protect their culture. Furthermore, the ability, or lack thereof, of the receiving countries to protect their culture is amplified by the existence and implementation of restrictive FDI policies imposed by their governments.
My study abroad in Bali, Indonesia, inspired this research topic as I noticed how globalization is changing the culture of its people. I learned their language and way of life which helped me understand the beauty and importance of cultural preservation. I believe we could all benefit from learning new perspectives as they could help us ideate solutions to contemporary issues and empathize with others.
BONKMILLON Unleashes Its Bonkers Potential on Solana.pdfcoingabbar
Introducing BONKMILLON - The Most Bonkers Meme Coin Yet
Let's be real for a second – the world of meme coins can feel like a bit of a circus at times. Every other day, there's a new token promising to take you "to the moon" or offering some groundbreaking utility that'll change the game forever. But how many of them actually deliver on that hype?
^%$Zone1:+971)581248768’][* Legit & Safe #Abortion #Pills #For #Sale In #Duba...mayaclinic18
Whatsapp (+971581248768) Buy Abortion Pills In Dubai/ Qatar/Kuwait/Doha/Abu Dhabi/Alain/RAK City/Satwa/Al Ain/Abortion Pills For Sale In Qatar, Doha. Abu az Zuluf. Abu Thaylah. Ad Dawhah al Jadidah. Al Arish, Al Bida ash Sharqiyah, Al Ghanim, Al Ghuwariyah, Qatari, Abu Dhabi, Dubai.. WHATSAPP +971)581248768 Abortion Pills / Cytotec Tablets Available in Dubai, Sharjah, Abudhabi, Ajman, Alain, Fujeira, Ras Al Khaima, Umm Al Quwain., UAE, buy cytotec in Dubai– Where I can buy abortion pills in Dubai,+971582071918where I can buy abortion pills in Abudhabi +971)581248768 , where I can buy abortion pills in Sharjah,+97158207191 8where I can buy abortion pills in Ajman, +971)581248768 where I can buy abortion pills in Umm al Quwain +971)581248768 , where I can buy abortion pills in Fujairah +971)581248768 , where I can buy abortion pills in Ras al Khaimah +971)581248768 , where I can buy abortion pills in Alain+971)581248768 , where I can buy abortion pills in UAE +971)581248768 we are providing cytotec 200mg abortion pill in dubai, uae.Medication abortion offers an alternative to Surgical Abortion for women in the early weeks of pregnancy. Zone1:+971)581248768’][* Legit & Safe #Abortion #Pills #For #Sale In #Dubai Abu Dhabi Sharjah Deira Ajman Fujairah Ras Al Khaimah%^^%$Zone1:+971)581248768’][* Legit & Safe #Abortion #Pills #For #Sale In #Dubai Abu Dhabi Sharjah Deira Ajman Fujairah Ras Al Khaimah%^^%$Zone1:+971)581248768’][* Legit & Safe #Abortion #Pills #For #Sale In #Dubai Abu Dhabi Sharjah Deira Ajman Fujairah Ras Al Khaimah%^^%$Zone1:+971)581248768’][* Legit & Safe #Abortion #Pills #For #Sale In #Dubai Abu Dhabi Sharjah Deira Ajman Fujairah Ras Al Khaimah%^^%$Zone1:+971)581248768’][* Legit & Safe #Abortion #Pills #For #Sale In #Dubai Abu Dhabi Sharjah Deira Ajman Fujairah Ras Al Khaimah%^^%$Zone1:+971)581248768’][* Legit & Safe #Abortion #Pills #For #Sale In #Dubai Abu Dhabi Sharjah Deira Ajman Fujairah Ras Al Khaimah%^^%$Zone1:+971)581248768’][* Legit & Safe #Abortion #Pills #For #Sale In #Dubai Abu Dhabi Sharjah Deira Ajman Fujairah Ras Al Khaimah%^^%$Zone1:+971)581248768’][* Legit & Safe #Abortion #Pills #For #Sale In #Dubai Abu Dhabi Sharjah Deira Ajman Fujairah Ras Al Khaimah%^^%$Zone1:+971)581248768’][* Legit & Safe #Abortion #Pills #For #Sale In #Dubai Abu Dhabi Sharjah Deira Ajman Fujairah Ras Al Khaimah%^^%$Zone1:+971)581248768’][* Legit & Safe #Abortion #Pills #For #Sale In #Dubai Abu Dhabi Sharjah Deira Ajman Fujairah Ras Al Khaimah%^^%$Zone1:+971)581248768’][* Legit & Safe #Abortion #Pills #For #Sale In #Dubai Abu Dhabi Sharjah Deira Ajman Fujairah Ras Al Khaimah%^^%$Zone1:+971)581248768’][* Legit & Safe #Abortion #Pills #For #Sale In #Dubai Abu Dhabi Sharjah Deira Ajman Fujairah Ras Al Khaimah%^^%$Zone1:+971)581248768’][* Legit & Safe #Abortion #Pills #For #Sale In #Dubai Abu Dhabi Sharjah Deira Ajman Fujairah Ras Al Khaimah%^^%$Zone1:+971)581248768’][* Legit & Safe #Abortion #Pills #For #Sale In #Dubai Abu Dhabi Sharjah Deira Ajman
STREETONOMICS: Exploring the Uncharted Territories of Informal Markets throug...sameer shah
Delve into the world of STREETONOMICS, where a team of 7 enthusiasts embarks on a journey to understand unorganized markets. By engaging with a coffee street vendor and crafting questionnaires, this project uncovers valuable insights into consumer behavior and market dynamics in informal settings."
The Rise of Generative AI in Finance: Reshaping the Industry with Synthetic DataChampak Jhagmag
In this presentation, we will explore the rise of generative AI in finance and its potential to reshape the industry. We will discuss how generative AI can be used to develop new products, combat fraud, and revolutionize risk management. Finally, we will address some of the ethical considerations and challenges associated with this powerful technology.
2. Contents
Summary of key findings
2
Recruiting employees
4
Working with recruitment agencies
15
Employer branding
22
Managing labour turnover
28
Key challenges and implications in recruitment, retention and turnover
38
Background to the survey
41
Further reading
43
Acknowledgements
44
Recruitment, retention and turnover
3. Summary of key findings
The 2007 Recruitment, Retention and Turnover survey contains valuable information on
current and emerging trends in people resourcing practice. This annual benchmarking
survey is based on 905 respondent organisations from the UK and relates to the period
1 January to 31 December 2006. Working with recruitment agencies and employer
branding are the two areas that we’ve chosen to focus on in more detail this year.
Focus groups composed of members of the CIPD’s Recruitment Forum contributed to the
analysis of the survey findings. Some of the commentary in this survey report draws on
the focus group members’ thoughts and experiences.
Resourcing strategies and objectives
• Fifty-one per cent of survey participants report
having a formal resourcing strategy.
• Eight in ten respondents cite attracting and
recruiting key staff to the organisation as the
main objective of their resourcing activities.
training to allow internal staff to fill posts (89%),
using the employer brand as a recruitment tool
(75%), targeting migrant workers from EU
accession countries (75%) and offering flexible
working (74%).
• Just 30% of organisations say they make use
Enabling the achievement of the organisation’s
of talent banks (ready candidate details saved
strategic goals (56%) and meeting future skills
electronically) before looking to recruit externally.
requirements (44%) are the second and third most
important resourcing objectives according to survey
Attracting and selecting candidates
participants.
• For the first time, corporate websites have broken
even with local newspaper advertisements as the
Recruitment difficulties
• Although in the main there was a dip in employers’
recruitment intentions last year, a high proportion
most common method for attracting candidates
(75%).
• Interviews based on the contents of the CV/
of these organisations still experienced recruitment
application form are found to be the most
difficulties (84%).
frequently used selection method (77%), followed
• The key reasons for recruitment difficulties were a
lack of necessary specialist skills (65%), followed
by competency-based interviews (63%).
• The average recruitment cost of filling a vacancy
by higher pay expectations (46%) and insufficient
per employee is £4,333, increasing to £7,750
experience (37%).
when organisations are also calculating the
• Appointing people who have the potential to grow
associated labour turnover costs.
but who currently don’t have all that’s required is
the most frequently used initiative to overcome
Working with recruitment agencies
recruitment difficulties (70%).
• More than 70% of organisations engage
• Some of those recruitment initiatives having a
positive impact by those using them to tackle
recruitment difficulties are providing additional
Recruitment, retention and turnover
recruitment agency services to help fill job
vacancies (73%).
• Eighty-one per cent of those employers using
4. recruitment agencies do so for hiring temporary
• This year more employers are monitoring recruitment
workers and 78% for seeking permanent staff.
and information on the diversity of their staff (71%),
• Where organisations are moving away from using
and training interviewers to understand diversity and
recruitment agencies the key driver is to cut down
the effects of stereotyping (61%).
on recruitment costs (72%). Adopting a direct-hire
strategy is also identified as another motive for not
using or reducing the use of agency services (53%).
• A third of employers don’t possess a preferred
supplier list (33%) and nearly six in ten fail to
evaluate agency performance in a structured
manner (59%).
• Practically all participants think that the quality of
candidates is important or very important when
assessing agency performance (99%). The service
Labour turnover
• The labour turnover rate of 18.1% remains almost
the same as the previous year’s 18.3%.
• The private sector reports the highest labour
turnover rates (22.6%).
• Over 70% of employers believe employees’
departure from the organisation has a minor, or
serious, negative effect on business performance.
• Change of career is deemed to be the most
received from agency staff (94%) and value for
common cause of voluntary turnover (52%). Other
money (90%) are also pivotal in this process.
reasons include promotion outside the organisation
• Most respondents agree or strongly agree that
using agencies considerably increases the cost of
their recruitment spend (76%).
(47%), level of pay (39%) and lack of career
development opportunities (39%).
• Twenty-four per cent of respondents have made
ten or more redundancies, and 22% have used
Employer branding
recruitment freezes.
• Almost seven in ten organisations describe
themselves as having an employer brand (69%).
Employee retention
• Attracting the people you want to recruit is cited by
• The number of employers experiencing retention
80% of survey participants as the main resourcing
difficulties has climbed from 69% in last year’s
objective for investing in employer branding.
survey to 78% in this year’s survey. Private sector
Fifty-seven per cent say they are also keen
businesses claim to be struggling more to hold on
to improve the external perceptions of the
to employees than any of the other sectors (83%).
organisation and 41% are hoping to differentiate
themselves from the competition.
• The company’s mission, culture and values are
• The most frequently cited actions taken by
organisations to address retention was increasing
learning and development opportunities (38%),
noted as the main elements of the employer brand
improving the induction process (36%) and
to be communicated (85%). Many employers also
improved selection techniques (35%).
use their employer brand to promote their career
and development opportunities (71%).
• Recruitment advertising and communication
materials are identified as the key resourcing
activities to be shaped by the employer brand
(76%). The employer brand also plays a big role in
influencing the design of induction training (65%).
Diversity
• Overall, only half of those organisations
surveyed have a formal diversity strategy (50%).
Public service employers seem to be more
diversity-conscious, with 83% of them adopting a
strategic approach to diversity.
Recruitment, retention and turnover
5. Recruiting employees
This section explores the nature and scale of recruitment activity taking place within
UK organisations during 2006. As well as reporting on the challenges that resourcing
professionals faced over the last year, it provides a snapshot of the current strategic focus
and taps into employers’ use of initiatives to overcome recruitment difficulties. It also
includes information on the trends and changes in attraction and selection methods,
diversity issues, and reports on the time and costs of recruitment and labour turnover.
Resourcing strategies and objectives
Recruitment difficulties
Table 1 shows that only half of those organisations
Table 2 shows, by industrial sector, the average number
surveyed have a formal resourcing strategy in place
of vacancies respondents sought to fill. In comparison
(51%). This is not much change on the previous year
with the previous year, there has been a significant drop
(53%). These findings are surprising, given that eight
in employers’ recruitment intentions. This is particularly
in ten employers rank attracting and recruiting key
evident in the voluntary sector and private sector –
staff to the organisation in their top three resourcing
where figures are more or less half that of a year ago.
objectives (Figure 1).
However, in 2006 manufacturing and production
companies appeared to step up their search for staff.
Other resourcing priorities include enabling the
achievement of the organisation’s strategic goals
Although in the majority there has been a fall in
(56%) and planning to meet the future skills
employee demand, the level of recruitment difficulties
requirements of the organisation (44%).
(84%) reported by organisations has risen since 12
months ago (see Table 3 for a breakdown by industry
Table 1: Organisations with formal resourcing strategies in place, by sector and size (%)
All
51
Sector
Manufacturing and production
52
Voluntary, community and not-for-profit
42
Private sector services
49
Public services
62
Number of employees
Fewer than 250
40
251–500
42
501–1,000
61
1,001–5,000
63
5,001–10,000
77
10,001 or more
74
Base: 887
Recruitment, retention and turnover
6. Figure 1: Main objectives of resourcing activities (respondents were restricted to selecting a maximum of three objectives)
Attracting and recruiting key
staff to the organisation
Enabling the achievement of
the organisation’s strategic goals
80
56
Meeting the future skills
requirements of the organisation
Supporting changes in the organisational
structure or the business environment
44
29
Addressing skills shortages
23
Reducing recruitment costs
21
Supporting succession planning
14
Assisting human resource planning
5
Other
1
0
20
40
Base: 868
60
80
100
Percentage of respondents
sector). The only exception to this is the public sector,
The increase in recruitment difficulties can also be
where finding employees seems to have eased. This
seen in Table 4, which breaks the results down by
may be due to the effects of the Gershon efficiency
organisation size.
drive being played out – that is, taking on fewer staff
and more internal redeployment.
Table 2: Number of vacancies respondents tried to fill during 2006, by industrial sector
Voluntary,
community and
not-for-profit
Total
Manufacturing
and production
2007 survey
263
112
64
227
671
2006 survey
381
77
147
479
683
Private sector
services
Public services
Base: 830
Table 3: Organisations experiencing difficulties recruiting to one or more category of vacancy, by industrial sector (%)
Total
Voluntary,
community and
not-for-profit
Manufacturing
and production
Private sector
services
Public services
2007 survey
84
86
81
86
80
2006 survey
82
80
76
81
89
Base: 879 (2007)
Table 4: Organisations experiencing difficulties recruiting for one or more category of vacancy, by organisation size (%)
Fewer than
250 employees
2007 survey
251–500
501–1,000
1,001–5,000
5,001–10,000
More than 10,000
employees
81
86
90
86
90
84
Base: 879
Recruitment, retention and turnover
7. Table 5: Categories of vacancies that proved particularly difficult to fill (%)
Total
Manufacturing
and production
Voluntary,
community
and not-for
profit
Private
sector
services
Public
services
Managers and professionals
45
49
39
48
36
Senior managers/directors
25
23
16
30
22
Administrative/secretarial
and technical
17
15
17
16
19
Services (customer, personal,
protective and sales)
14
10
13
19
5
Manual/craft workers
12
18
13
8
11
Other
11
11
12
7
21
Base: 879
Table 5 highlights which categories of vacancy
were similar to our 2006 survey. The three most
organisations are having the most difficulty recruiting for.
frequently cited causes are lack of necessary specialist
This year, the findings suggest that employers have found
skills (65%), higher pay expectations (46%) and
it slightly harder to recruit administrative/secretarial and
insufficient experience (37%).
technical staff – 17% in 2006 compared with 14% in
2005 – and senior managers/directors – 25% in 2006
Overcoming recruitment difficulties
compared with 23% in 2005.
In an attempt to overcome recruitment difficulties,
organisations are taking a number of different
We also asked respondents to specify the reasons for
approaches (Table 7). Appointing people who have
their recruitment difficulties (Table 6). The findings
the potential to grow but don’t currently have all
Table 6: Reasons for recruitment difficulties (%)
Total
Manufacturing
and production
Voluntary,
community
and not-forprofit
Private
sector
services
Public
services
2006 survey
Lack of necessary
specialist skills
65
77
55
66
55
68
Looking for more pay
than you could offer
46
41
56
43
56
45
Insufficient
experience
37
42
29
40
28
37
No applicants
28
20
30
28
33
30
Image of sector/
occupation
16
18
26
12
19
18
Lack of interpersonal
skills
13
16
5
17
4
13
Lack of formal
qualifications
8
10
10
4
14
7
Applicants unable to
accept position due
to high cost of living
in the area
7
2
12
6
14
9
Other
8
8
11
7
12
5
Base: 737
Recruitment, retention and turnover
8. that’s required is the most popular initiative (70%) –
This year we decided to include as an option the use of
although not the one with the most positive effect
employer branding as a recruitment tool. While only
(58%). This year the initiative most frequently seen to
about a third (31%) of respondents used it in response
have had a positive impact was providing additional
to recruitment difficulties, three-quarters (75%) of them
training to allow internal staff to fill posts (89%).
thought that it had been effective. Offering flexible
working (74%), targeting migrant workers from EU
Discussion from our focus group – held to explore the
accession countries (75%) and recruiting in foreign
research findings – highlighted that organisations
countries to bring staff here (75%) also had a beneficial
offering lower salaries, such as those in the voluntary
effect on overcoming recruitment difficulties.
sector, are more likely to employ individuals with
future potential and take account of a broader range
One of our focus group members working in a
of qualities when considering candidates.
manufacturing company spoke of their experience of
Table 7: Initiatives undertaken in response to recruitment difficulties (%)
Respondents saying this initiative has a...
Used
during
2006
Negative
impact
Neutral
impact
Positive
impact
Used during
2005
(2006 survey
report)
Appointing people who have
potential to grow but don’t currently
have all that’s required
70
6
36
58
66
Taking account of a broader range
of qualities, such as personal skills
instead of qualifications, when
considering candidates
47
2
31
67
43
Appointing people who don’t exactly
match what the job requires
43
40
34
26
37
Increasing starting salaries or benefits
package
36
7
33
61
34
Redefining the job (for example,
responsibilities, grade)
35
7
37
57
29
Using the employer brand as a
recruitment tool
31
2
24
75
N/A
Offering flexible working
30
3
24
74
29
Providing additional training to allow
internal staff to fill posts
29
1
11
89
33
Bounty payments to staff for
introducing candidates
28
2
35
63
26
Providing a realistic job preview
22
3
22
75
16
Targeting migrant workers from EU
accession countries
14
8
17
75
15
Giving golden hellos
13
4
31
65
11
Changing the way work is organised
(for example, into teams)
12
3
30
69
11
Recruiting in foreign countries and
bringing staff here
11
4
21
75
12
4
5
32
64
4
Offshoring
Base: 698 (all organisations experiencing difficulties)
Recruitment, retention and turnover
9. recruiting staff from Poland. In 2005 people would have
difficulties, nearly seven in ten organisations (69%) don’t
‘bitten their hand off’ to come and work for their
make use of ‘ready’ candidate details stored electronically
organisation in the UK, but a year later they found
before embarking on external recruitment (Figure 3).
people to be more selective. At the same time, where
individuals with higher skill levels were required,
A focus group member commented on how talent
applicants often didn’t have the depth of technical
banks are often too big and keeping them up to date
English required to explain and demonstrate their
has significant cost and resource implications, which are
knowledge and suitability for the role.
difficult to justify internally. In reality it would be better
More information on the new points-based system for
case study featured in this report illustrates the
migration can be found in the CIPD factsheet,
approach Nestlé takes to storing candidate details and
Immigration Law Changes: What employers should
keeping talent warm.
to concentrate on certain areas of the business. The
know (www.cipd.co.uk/factsheets).
Turning our attention to graduates, Table 8 reveals that
Figure 2 shows that 81% of respondents have a policy of
almost a quarter of surveyed organisations run
advertising all vacancies internally. This year our survey
structured graduate recruitment programmes (24%).
also considered whether employers are making use of
Larger organisations are more likely to devise a separate
talent banks. Surprisingly, given the level of recruitment
recruitment programme for graduates.
Figure 2: Do you have a policy of advertising all vacancies internally?
19%
Yes
No
81%
Base: 895
Figure 3: Does your organisation make use of a talent bank (ready candidate details saved
electronically) before looking to recruit externally?
1%
69%
30%
Yes
No
Don't know
Base: 896
Recruitment, retention and turnover
10. Table 8: Organisations operating a structured graduate recruitment programme, by sector and by size (%)
All
24
Sector
Manufacturing and production
27
Voluntary, community and not-for-profit
9
Private sector services
28
Public services
23
Size – number of employees
Fewer than 250
12
251–500
15
501–1,000
22
1,001–5,000
38
5,001–10,000
37
10,001 or more
66
Base: 898
Talent puddles – helping to feed the people capability needs at Nestlé
Nestlé is a large global food and beverage manufacturer. Its aim is to manufacture and market products
in such a way as to create value that can be sustained over the long term for shareholders, employees,
consumers and business partners. The business focus at the moment is very much on nutrition, health
and wellness and coming up with new products to meet countrywide trends, while at the same time
driving down costs.
Nestlé employs 6,000 people in the UK and recruitment services are responsible for the resourcing
issues relating to all of them.
In November 2001 the HR function within Nestlé UK moved from the HR generalist model to the ‘three
box’ model of HR business partners, shared services and centres of expertise. The latter are: recruitment
services, learning and development, the information and administration centre, and policy,
remuneration and reward.
Initially the recruitment team was made up of a mixture of new hires with recruitment backgrounds and
some generalist survivors from the HR restructuring. According to Fionna White, Head of Recruitment at
Nestlé, ‘Now, five years on it has transformed itself and is a group of true experts in their field
operating as an in-house recruitment agency.’
(continued)
Recruitment, retention and turnover
11. Talent puddles – helping to feed the people capability needs at Nestlé (continued)
People capability requirements
Nestlé’s multi-channel talent pipeline aims to feed two broad capability requirements of the
organisation. First, the core capability pool is populated with employees who make up the larger
portion of the workforce and have the technical skills and capabilities that are essential to keep the
organisation running.
The second group of people is the high potential pool. This comprises employees who make up the
smaller portion of the workforce who are considered to have sufficient potential to become their high
performers and senior managers of the future. Each category is filled through a combination of
existing employees and new recruits.
Introducing talent puddles
Recruitment services have worked with a number of functions to develop a multi-channel approach to
filling their recruitment needs. Supported by the HR business partners, the function identifies its talent
shortfalls and recruitment services subsequently devise an attraction strategy to fill the specific talent gap.
The pool of talent Nestlé is seeking to tap into is from a candidate-driven market. The latest initiative
to help overcome the shortage of skilled applicants is Nestlé’s ‘talent puddles’. This is a targeted pool
of talent that is easier to access and manage than a broad generic talent database, which after time
grows too unwieldy to identify the appropriate candidates.
Earlier efforts to implement talent pools failed due to poor IT systems – recruiters were unable to find
suitable people as the search facility was inadequate. However, the talent puddles are much smaller
and contain potential talent for each function rather than the whole company. White describes them
as ‘the same as talent banks, just separated from a huge speculative pool’.
The first talent puddle was set up in September 2006 with a £5,000 budget. Creating micro-sites for
jobs the department needed to recruit for was the initial step. This was followed by a targeted online
campaign to generate candidates who were then interviewed and kept warm until an appropriate
role arose. This candidate relationship management strategy allows the company to have candidates
who are ‘offer ready’ and interested in Nestlé when a vacancy comes available.
‘Essentially it was a selling job to drive more traffic to Nestlé’s website. Persuading senior
management wasn’t difficult. Our business case highlighted a £56,000 cost of placing 13 people
within the organisation via agencies versus the talent puddle and candidate relationship management
concept, which generated 14 offers from just £700,’ explained White.
The attraction strategy is designed to fill specific jobs and ‘difficult-to-fill’ roles. Because of this the
company is up front with people that there are no jobs in existence. The motives for choosing the
supply chain first was the interest they showed in the initiative and the fact that their career paths
and succession planning were the most advanced.
The supply chain talent puddle, which was launched at the end of last year, now contains 120
shortlisted candidates and has placed eight people. Nestlé have also implemented it for finance and
are about to launch it for the marketing and sales functions.
0
Recruitment, retention and turnover
12. Talent puddles – helping to feed the people capability needs at Nestlé (continued)
The recruiter’s role
This new approach to resourcing has affected the recruiters’ roles. A significant portion of their time
is now spent calling people and sifting through CVs from the talent puddle. When people apply,
recruiters look at the quality of the applications and assess what level/grade they are operating at,
ranking and recording them accordingly. Candidates are met and interviewed by the recruitment
team and line managers before being placed in the talent puddle.
Business benefits
Reducing the time to hire and fill vacancies and the cost of recruiting are just some of the business
benefits. One vacancy filled via this method led to an offer being accepted in 24 hours.
White points out that ‘managers are beginning to think ahead, for instance the resourcing team were
asked by one manager to start looking for someone to replace a member of staff who is to be
promoted in future months.’ White believes it has also encouraged the organisation to become better
at its resource planning by turning line managers’ conversations to focus on identifying talent gaps and
what are we going to do to fill them proactively as opposed to reacting “once the horse has bolted” as
we have done in the past’.
With their candidate relationship management strategy, referral scheme and drive to increase the
number of direct hires, the company has also reduced their agency dependency over the past five years
from 80% to 29% (against an industry norm of 30%), saving the business £300,000 during 2006 in
agency placement fees.
‘This approach is just one part of the multi-channel approach we have to generating a talent pipeline to
meet the business’s needs,’ says White.
Information provided by Fionna White, Head of Recruitment, Nestlé
Recruitment, retention and turnover
13. Attracting candidates
sectors. However, only 52% of public sector and 59%
We also enquired about the methods employers are
of voluntary sector organisations use recruitment
using to attract applicants (Table 9). For the first time it’s
agencies. This suggests a preference towards greater
a tie between local newspaper advertisements (75%)
internal resourcing control in these sectors.
and the company’s own corporate website (75%) in
terms of how often these methods were used. In last
Selecting candidates
year’s survey newspaper advertisements were still more
We then went on to investigate the methods
common. Employee referral schemes also remain
organisations are using to select applicants. The findings
popular (47%).
are shown in Table 10 and highlight that interviews
following contents of CV/application form (that is,
Recruitment agencies are still widely used by many
biographical) are the most common selection method
respondents (73%). The two heaviest users are
(92%). Ranked second and third in terms of those used
manufacturing and production companies (86%) and
in some way are structured interviews (88%) and
private sector employers (78%). Likewise the use of
competency-based interviews (86%).
search consultancies is also more prevalent among these
Table 9: Methods used to attract applicants, by industry sector (%)
Total
Manufacturing
and production
Voluntary,
community
and not-for
profit
Private
sector
services
Public
services
2006 survey
Local newspaper
advertisements
75
83
87
63
88
79
Own corporate
website
75
65
69
76
87
75
Recruitment agencies
73
86
59
78
52
76
Specialist journals/
trade press
61
54
61
57
77
66
Employee referral
scheme
47
49
22
66
11
47
Encouraging
speculative
applications/word
of mouth
44
52
39
52
20
49
Jobcentre Plus
43
42
53
35
58
51
National newspaper
advertisements
42
32
58
33
68
45
Links with schools/
colleges/universities
32
5
26
32
30
37
Apprentices/work
placements/
secondments
33
36
28
29
37
36
Search consultants*
29
33
14
35
19
N/A
Commercial job
boards
21
15
14
28
18
16
Physical posters/
billboards/vehicles
11
4
17
13
13
10
6
5
6
6
9
7
10
6
15
9
11
7
Radio or TV
advertisements
Other
Base: 899
* included in the recruitment agencies figure for 2006
Recruitment, retention and turnover
14. Table 10: Methods used to select applicants (%)
Used in
some way
Not used
Rarely used
Occasionally
used
Frequently
used
2006
survey
Interviews following
contents of CV/
application form (that
is, biographical)
92
8
5
10
77
85*
Structured interviews
(panel)
88
12
9
21
58
88
Competency-based
interviews
86
15
6
17
63
85
Tests for specific skills
80
20
14
37
29
82
General ability tests
72
28
16
30
26
75
Literacy and/or
numeracy tests
70
30
16
29
25
72
Telephone interviews
61
39
23
23
15
56
Personality/aptitude
questionnaires
56
44
12
26
18
60
Assessment centres
47
53
12
19
16
48
Group exercises (for
example, role playing)
46
54
18
18
10
48
Pre-interview
references (academic
or employment)
45
55
15
13
17
Online tests
(selection)
30
71
10
11
9
50(E)
48(A)
25
Base: 843
*result in 2006 survey refers only to interviews following contents of CV/application form (that is biographical) as removed
structured interviews (1:1) from this year’s survey
‘E’ refers to employment reference and ‘A’ relates to academic reference results from the 2006 survey, as this year we
have combined both categories.
Time and cost to fill vacancies
recruitment and labour turnover. Although 53% of
We also explored how long it takes respondent
respondents report calculating recruitment costs, not all
organisations to fill job vacancies, and the estimated
of them have supplied figures.
costs associated with recruitment and labour
turnover. The findings can be found in Tables 11
Ten per cent of survey participants calculate the broader
and 12 on the following page.
range of costs associated with replacing a leaver as a
result of turnover. The reasons given for not making
As Table 12 shows, not all organisations surveyed were
these calculations by those who don’t do so are shown
able to provide figures relating to the costs of
in Figure 4 on the following page.
Recruitment, retention and turnover
15. This limited data appears to contribute to some
Figure 4 shows that 66% of respondent organisations
discrepancies when examining recruitment costs alone,
don’t require information on labour turnover costs. This
compared with the costs associated with labour
is surprising given the increased focus on human capital
turnover. For instance, surely labour costs should be
metrics/measurement to demonstrate the value of HR
much higher for senior managers/directors than
and people management activities.
recruitment costs (see Table 12).
Table 11: Average number of weeks to fill a vacancy*
Senior managers/directors
16.3 (761)
Managers/professionals
12.6 (814)
Administrative, secretarial and technical
6.6 (797)
Services (customer, personal, protective and sales)
7.4 (678)
Manual/craft workers
5.9 (611)
Number of respondents shown in brackets
*Time from deciding there was a vacancy to the new employee’s actual start date
Table 12: Estimated total cost of recruitment* and labour turnover** per employee
Occupational group
Costs of recruitment (£)
Senior managers/directors
Costs of labour turnover (£)
10,000 (240)
11,000 (16)
Managers/professionals
5,000 (289)
11,000 (19)
Administrative, secretarial and technical
2,500 (288)
5,000 (18)
Services (customer, personal, protective
and sales)
2,000 (198)
5,000 (19)
900 (143)
1,174 (12)
4,333 (337)
7,750 (24)
Manual/craft workers
All employees
Median costs shown (number of respondents shown in brackets)
* Advertising costs, agency or search fees
** Vacancy cover, redundancy costs, recruitment/selection, training and induction costs
Figure 4: Reasons for not calculating the cost of labour turnover (%)
4%
21%
Organisation does not require information
66%
44%
Too time-consuming
Too complicated
Too costly
Base: 640
Recruitment, retention and turnover
16. Working with recruitment
agencies
According to earlier survey findings, more than seven in ten organisations are still using
recruitment agencies as part of their attraction process (73%). But are recruiters working
in partnership with selected agencies to ensure that their service adds value to the
organisation’s resourcing strategy? And are employers assessing agency performance and, if
so, how is this carried out?
This year, we chose to examine the relationship between
Figure 5 on the following page clearly highlights that
organisations and third-party recruitment agencies. This is
where there has been a move away from or decline in
an area we covered in our 2005 survey and therefore
agency use, the key reason is minimising recruitment
some comparison can be made with these results.
costs (72%). Just over half (53%) are also choosing to
adopt a direct-hire strategy.
In our 2007 survey, 81% of respondents used
recruitment agencies for hiring temporary workers and
Despite those organisations turning their backs on
78% contacted them for help in filling permanent jobs.
recruitment agencies claiming it is primarily because of
There has also been some movement around the rise and
cost, those continuing to engage agency services are in
fall of agency usage (Table 13).
the main using them on an unplanned basis (contingency
– 78%) (Figure 6). Sixty-six per cent of respondents used
advertised selection in 2006, compared with 51% in
2004, and search (such as headhunting) has declined in
use from 46% two years ago to 37% in 2006.
Table 13: Change in organisations’ use of recruitment agencies (%)
For permanent
vacancies
For temporary
vacancies
Don’t use
22
19
Significant decrease in use
12
10
Slight decrease in use
11
8
Use has stayed the same
35
42
Slight increase in use
15
14
7
7
Significant increase in use
Base: 870 – permanent vacancies
Base: 821 – temporary vacancies
Recruitment, retention and turnover
17. Figure 5: Organisations’ reasons for not using or declining use of recruitment agencies
Minimising recruitment costs
72
Direct-hire strategy
53
Keen not to dilute the employer brand
8
7
Never used agencies
Other
9
0
20
40
60
80
Percentage of respondents
Base: 416
Figure 6: Types of recruitment agency used (%)
78
Contingency (such as occasional recruitment
using agency database of candidates)
82
46
Advertised selection (such as agency runs
online/press campaign on your behalf)
2007 survey
51
2005 survey
37
Search (such as headhunting)
46
0
20
40
60
80
100
Percentage of respondents
Base: 772
Table 14: Organisations with preferred supplier lists (PSLs) in place, by sector and by size (%)
All
66
Sector
Manufacturing and production
68
Voluntary, community and not-for-profit
50
Private sector services
71
Public services
67
Size – number of employees
Fewer than 250
59
251–500
62
501–1,000
70
1,001–5,000
79
5,001–10,000
77
10,001 or more
73
Base: 858
Recruitment, retention and turnover
18. Table 14 opposite reveals that, overall, a third of
they work with (Table 15). The results we found were
companies (33%) don’t have a preferred supplier list
rather bleak – nearly six in ten of those surveyed didn’t
(PSL). This is an improvement on the 2005 survey
have any process in place to evaluate agency
findings, which show that 44% of respondent
performance (59%).
organisations didn’t possess a PSL that year.
Figure 7 shows that ownership for recruitment agency
We were also keen to find out how many employers are
contracts is primarily HR’s responsibility (79%). However,
assessing the performance of the recruitment agencies
it’s crucial to involve other relevant parties.
Table 15: Organisations with a structured approach to evaluating the performance of recruitment agency/agencies,
by sector and by size (%)
All
Yes
36
No
59
Don’t know
5
Sector
Manufacturing and production
36
Voluntary, community and not-for-profit
23
Private sector services
41
Public services
34
Size – number of employees
Fewer than 250
28
251–500
28
501–1,000
34
1,001–5,000
50
5,001–10,000
57
10,001 or more
53
Base: 837
Figure 7: Those in the organisation with primary responsibility for recruitment agency contracts (%)
HR department
79
Procurement
10
9
Line manager
4
Other
0
20
40
60
80
Percentage of respondents
Recruitment, retention and turnover
17
19. Table 16 displays resourcing professionals’ views on
recruitment agency (Table 17). The two main
what is of importance to them when assessing agencies’
considerations are level of fees (59%) and their
credibility. Ninety-nine per cent of those answering this
relationship with the agency contact (54%). Agencies’
question believe the quality of candidates to be
level of legal awareness and compliance of employment
important or very important. When looking at the same
is also a serious determinant (47%) in choice of agency.
levels of importance, the service received from agency
staff (94%) and value for money (90%) are also vital.
However, Table 18 highlights that only 53% of
respondents think that most agencies are legally aware
There appears to be little change in the last couple of
and don’t discriminate.
years on what factors influence employers’ choice of
Table 16: Views on measures organisations could use to assess agency performance
Not
important
Quite
important
Important
Very
important
Quality of candidates
0
1
10
89
Service you receive from agency staff
0
6
38
56
Value for money
1
9
37
53
Time taken to fill vacancy(ies)
1
15
47
37
Feedback from recruiting managers
3
17
49
30
Diversity of candidates
9
22
44
26
Feedback from candidates on quality of
agency briefing
5
25
44
25
Ratio of number of placements made versus
number of vacancies to fill
14
32
38
17
Added-value initiatives (for example in market
activity)
25
33
30
12
No
influence
Minor
influence
Some
influence
Big
influence
Relationship with your agency contact
2
8
37
54
Level of legal awareness and compliance of
employment
5
13
36
47
Commercial terms
4
9
42
45
Agency’s alignment with the organisation’s
culture and values
8
17
34
41
Base: 773
Table 17: Factors influencing organisations’ choice of recruitment agencies
Reputation of agency in marketplace
2
9
49
40
Reputation of agency among recruiting
managers
9
18
47
27
National coverage (access to candidates)
20
26
35
19
1
5
35
59
Location of agency (local to client)
19
27
38
16
Ability to act as a ‘one-stop shop’ for a range
of services (for example training, advertising)
39
29
20
12
Level of fees
Base: 779
Recruitment, retention and turnover
20. Table 18: Views on the value of recruitment agency products and services
Strongly
disagree
Disagree
Neither
agree nor
disagree
Agree
Strongly
agree
Engaging services of agency(ies) is helping
us to overcome recruitment difficulties
4
12
31
46
7
Using agencies is quicker than using other
direct recruitment advertising methods
4
20
28
38
9
Candidates put forward by agencies
normally fit the job criteria
3
19
37
40
2
Most recruitment agencies are legally aware
and don’t discriminate
2
12
33
48
5
We have a partnership relationship with our
recruitment supplier(s)
4
15
30
40
11
We’re spending more time with recruitment
agencies to ensure our requirements are
fully understood
5
19
27
40
9
Agencies offer employers the ability to track
down individuals who possess specialist
expertise
2
11
26
54
8
The agency(ies) focus is on ‘making a sale’
rather than delivering the best candidate
2
16
37
33
12
Using agencies considerably increases the
cost of our recruitment spend
1
8
16
39
37
Base: 822
Further analysis from the views on the value of agency
This section of the survey also provoked some lively
products and services (Table 18) reinforces the key
discussion among focus group members. One attendee
theme from these particular findings, which is that
who used to work for a recruitment agency thought
employers tend to associate agencies with increased
that while there was a lot of emphasis in organisations
recruitment costs – 76% of participants agree or
on having PSLs or service-level agreements in place, the
strongly agree that using agencies considerably increases
key was never to push for too good a price. Where fees
the cost of their recruitment spend.
are too low, agencies will pick up the phone to your
competitor who is prepared to pay that bit more for
However, it’s quite encouraging to find that 51% (those
their services. They emphasised that you should look for
selecting agree and strongly agree) of employers
value for money rather than the very lowest cost.
surveyed believe they have a partnership relationship
with their recruitment supplier(s). Additionally, almost
Our case study from Rolls-Royce demonstrates how their
half of those answering the survey agree or strongly
resourcing team has been working more closely with a
agree with the statement that they’re spending more
small number of chosen agencies, and in conjunction
time with agencies to make sure that their requirements
with their procurement department to streamline
are fully understood (49%).
agency usage and ensure it contributes to the
company’s resourcing needs and business objectives.
Working in partnership with the Recruitment
Employment Confederation, the CIPD will be carrying
out some more in-depth research into the relationship
between HR and recruitment agencies during the
coming year.
Recruitment, retention and turnover
21. The benefits of HR, recruitment suppliers and purchasing working closely
together at Rolls-Royce
Rolls-Royce provides power systems and services for use in four global markets – civil aerospace,
defence aerospace, marine and energy. It employs 38,000 people in offices, manufacturing and service
facilities in 50 countries.
With an order book for the future worth £26.1 billion, the resourcing team in Rolls-Royce plays a crucial
part in ensuring the company has sufficient people resource – those with the right skills to meet the
business needs. Iain Snape, Operations Manager – Resourcing, HR Shared Service Centre, says,
‘Rolls-Royce is constantly striving to achieve excellence in everything we do and in support of this
objective from an HR perspective, we set up a centralised recruitment shared service three years ago to
support the company’s resourcing activities across the UK workforce of 22,500.’
Streamlining agency usage
Before the creation of the shared service function, the company used approximately 280 recruitment
agencies to help them find staff in the UK. Today, the company has just six preferred suppliers and a
handful of approved suppliers. The change has enabled Rolls-Royce to build much stronger relationships
with the selected agencies that now clearly understand their business and make the experience more
manageable and successful.
The company has also exploited the opportunity to gain greater control of agency usage and spend by
working closely with their purchasing colleagues. Snape believes, ‘Working in partnership with
purchasing has enabled the company to explore a number of different strategic resourcing options. It is
not a one-way street in terms of who controls the purse strings. We have jointly agreed and bought into
each other’s strategic objectives and this will help us work more efficiently on behalf of the business with
our suppliers and try to educate the business on all aspects of resourcing through agency suppliers.’
However, while the HR shared service centre and the increased usage of the website has allowed
Rolls-Royce to source many employees directly, they still rely on agencies for about 50% of all their
external job vacancies. Job market changes mean that there are times when the business struggles to find
people with specialist skill sets and in these situations they turn to their agency suppliers for assistance.
Engaging line managers
To engage line managers, the new policy was communicated through the HR business partner network,
working jointly with purchasing, to explain the procedures and benefits of the new approach for line
managers.
The resourcing function adopts a consultative approach when speaking with line managers. Recruitment
conversations with line managers – when talking specifically to them about recruitment agency
campaigns – includes helping them to understand the most effective steps to take when engaging
agency services. Interview packs are also prepared and contain details of the competencies agreed,
guidance notes and caveats to look out for to ensure legal compliance.
Evaluating agency performance
Monitoring and reviewing the services delivered by the preferred agencies is pivotal to maintaining
efficiency and agency performance. To achieve this, quarterly strategic reviews are held with each
preferred supplier and a number of measures are discussed that cover aspects of the contract, pricing,
0
Recruitment, retention and turnover
22. The benefits of HR, recruitment suppliers and purchasing working closely
together at Rolls-Royce (continued)
diversity and legal requirements. Strategic changes in both Rolls-Royce and the agency supplier that
affects the relationship and risk management from the point of view of business continuity planning are
also discussed at these meetings. For example, if the supplier’s main office location was not able to
function, how would they continue to deliver their service?
At the same time quarterly performance statistics are reviewed and compared against other providers.
According to Snape, ‘We are honest with the feedback we give our agency suppliers. If the
performance of one agency is low in comparison to another, we will discuss the factors that have
caused the dip in performance.’
Collecting management information also allows the company to monitor:
• cost – spend on temporary and permanent rates for hiring and new ideas suggested by the
agency to help recruit more efficiently
• quality – of CVs, speed of responses to vacancies, number of candidates submitted for roles,
numbers interviewed and then finally recruited
• delivery – breadth of skills and national locations, ability to fill a range of roles
• management – ease of the business relationship, response to demands and delivery of
management information and provision of accurate invoicing.
Progress made and the advantages of working in partnership
In the past – with 280 agencies in circulation – the service received from agencies consisted of faxing
through CVs. Since then, developing closer relationships with selected providers has – as well as driving
down costs – given the business greater control and the ability to work with agencies to find the best
employees. Snape believes ‘Getting an open and honest relationship is worth its weight in gold. It has
positively impacted the entire recruitment process and has been critical in securing the level of
temporary workers we require.’
Suppliers have also provided advice on seeking staff from eastern block countries at times when the
company has drawn a blank with their search in the UK. Agency suggestions are welcome, even if it
only acts to push change through in the thoughts of the resourcing team. Essentially the organisation
expects their suppliers to be updating them with what is going on in the job market.
Not surprisingly there are still non-preferred agencies targeting Rolls-Royce who are charging fees far in
excess of the levels that the company have agreed with their preferred agency suppliers. ‘Although this
is happening much less than it used to, it does reinforce the importance of continuing to educate our
line managers as to the cost and service benefits of using our preferred suppliers,’ says Snape.
The outcome will differ in each organisation. But in Rolls-Royce, partnering with chosen agencies has
led to a positive outcome: managing and reducing recruitment agency expenditure and also sourcing
candidates more effectively for the business.
Information provided by Iain Snape, Operations Manager – Resourcing, HR Shared Service Centre,
Rolls-Royce plc
Recruitment, retention and turnover
23. Employer branding
Employer branding seems to be very much in fashion at the moment, as companies are
increasingly seeking to make use of their employer brand to help attract, recruit and retain
talent within their organisation. But what role does it play in employee resourcing?
Employer branding can be described as how an
getting the right people to apply (85%) and improving
organisation markets what it has to offer both potential
their image as a prospective employer (67%) rather than
and existing employees. Based on this definition Table 19
on improving employee engagement (12%) or employee
shows that nearly seven in ten organisations would
retention (24%).
describe themselves as having an employer brand (69%).
When questioned about the three main resourcing
Not surprisingly, respondents noted company mission,
objectives for investing in employer branding, 80% of
culture and values as being the main element of the
respondents said it was to attract the people they wanted
employer brand communicated (85%). Having an
to recruit. Fifty-seven per cent were looking to improve
employer brand has also given employers the opportunity
the external perceptions of the organisation and 41%
to promote their career and development opportunities
were keen to differentiate themselves from their
(71%) (Figure 8).
competitors (Table 20).
With regard to those resourcing activities that are shaped
The results highlighted some inconsistencies between
by the employer brand, 76% of those answering the
industry sectors. The focus in public service organisations
survey use it to influence their recruitment advertising and
seems to be slightly different to other sectors. Employer
communication materials, and 65% say it plays a role in
branding efforts appear to be centred more around
the design of their induction training (Figure 9).
Table 19: Organisations claiming to have an employer brand, by sector and by size (%)
All
69
Sector
Manufacturing and production
64
Voluntary, community and not-for-profit
68
Private sector services
72
Public services
75
Size – number of employees
Fewer than 250
64
251–500
66
501–1,000
71
1,001–5,000
72
5,001–10,000
77
10,001 or more
89
Base: 895
Recruitment, retention and turnover
24. Table 20: Main resourcing objectives for investing in employer branding (respondents were restricted to selecting a
maximum of three objectives) (%)
Voluntary,
community
and not-for
profit
Private
sector
services
Public
services
Main objectives
All
Manufacturing
and production
Attracting the people you want to
recruit
80
79
75
80
85
Improving external perceptions of
the organisation
57
55
56
54
67
Differentiating your organisation
from the competition
41
30
37
47
39
Retaining talent within the
organisation
36
44
26
36
32
Improving employee retention
31
34
36
32
24
Reducing recruitment costs
21
23
22
22
21
Improving employee engagement
20
25
25
22
12
Base: 855
Figure 8: Elements of the employer brand that organisations communicate (%)
85
Company mission, culture and values
Career and development opportunities
71
Reward
47
Work–life balance
45
Diversity
40
Corporate social responsibility (CSR)
26
0
20
40
Base: 801
60
80
100
Percentage of respondents
Figure 9: Resourcing activities shaped by the employer brand (%)
Recruitment advertising
and communication materials
76
Communication of company mission/
culture and values
69
Design of induction training
65
Choice of recruitment medium
(for example online)
54
Design of the recruitment experience
52
Development of new resourcing initiatives
43
Redundancy decisions
27
0
Base: 794
20
40
60
80
Percentage of respondents
Recruitment, retention and turnover
25. Debate during our focus group raised some important
example, with 15 years’ service. Everyone needs to feel
issues around the employer brand and its role in the
part of the organisation irrespective of which career
recruitment process. Those who took part thought
ladder they choose to climb.
that ‘people talk’ when their application is handled
badly. One member spoke of how the external and
Describing their experience of a poor recruitment
internal brand in her old company didn’t match. There
process, another focus group member said it didn’t
were also lots of long-serving employees and,
reflect the hiring company’s employer brand at all. Once
therefore, how the organisation engaged with new
the recruitment process kicked in, their perception of
staff should in theory be no different from those, for
the employer brand changed for the worse.
Marks Spencer’s employer brand journey
Everyone has heard of the high street retailer Marks Spencer (MS). On average, over 15 million
people visit its UK stores every week. With a workforce of 70,000 employees worldwide (of which
approximately 65,000 are based in the UK), a compelling employer brand is vital to attract, engage,
develop and retain talent. Moreover, a positive shopping experience for the MS customer is dependent
on the employees ‘living the brand’.
Like most retailers, MS has to keep focused on keeping ahead of the competition. A key business
priority (particularly in today’s macro-environment) is its policy on corporate social responsibility (CSR).
The company’s latest CSR initiative is ‘Plan A’ – a five-year, 100-point plan to tackle some of the biggest
challenges facing its business and the world in general.
Why invest in employer branding?
Given this backdrop, what does employer branding mean to MS? Juan Pemberton, Head of
Recruitment, Learning and Development at MS, describes it as ‘connecting on every level with current
and potential employees in a manner which aligns the organisation with its people and motivates them
to deliver the very best service for the customer’.
With the HR function in congruence with the business plan and responsible for maintaining the
employer brand, MS wanted an employer brand that complemented its customer brand proposition.
Steps to a compelling employer brand
Analysing the status quo was the starting point for understanding and redefining the employer brand at
MS. Specific criteria emerged as contributing to overall employee satisfaction levels, namely:
• management capability
• encouragement to develop personally – technical skill and behavioural competence
• fair employment policies and integrity around people management
• empowerment to make decisions and take ownership
• recognition for a job well done
• team unity and a spirit of co-operation
• information that is easily accessed and understood
• opinions that are listened to and acted upon
• pride in the company.
Recruitment, retention and turnover
26. Marks Spencer’s employer brand journey (continued)
These were then measured. The quantitative analysis explored the factors that drive job satisfaction; the
qualitative analysis uncovered the insights that would develop a compelling and differentiated employee
proposition, at the same time pinpointing what makes working at MS unique.
According to Pemberton, ‘For our employer brand to be in keeping with our customer brand
proposition it had to be credible and compelling, playing to MS’s strengths and in doing so
differentiating us from the competition.’
Graphs to illustrate how MS’s performance stacked up against employee satisfaction were used to plot
the findings. MS at its best was the source of great pride for its workforce but this was too often as a
result of it having a parent–child approach to its employee relations. At its worst, therefore, opinions
didn’t always count, good work was not consistently singled out for recognition and people were too
often left feeling that the company didn’t value them as individuals.
To redress the balance, MS determined what it wanted from its people, what it wanted more of and
what it wanted less of. As a result, a new relationship between the company and its employees has
emerged based on mutual respect and ‘joint ownership’ of the challenges being faced. Put simply, in
return for optimal productivity and increased commitment, the company would work towards further
improving employment terms and conditions, modernising where appropriate its policies and better
involving its people in the decision-making process. Underpinning all of this is a comprehensive
programme of targeted and ongoing training: ‘Career Path’ programmes in stores; and the Buying
Academy and Food Academy in head office.
Communicating and measuring the employer brand
Driving internal value involves measuring and communicating all aspects of the employer brand. The
annual ‘Your MS, Your Say’ employee survey and the business involvement groups at store, divisional
and national level are vehicles that have at their heart the opportunity to engage with employees about
how the business is managed. Critically, they provide both quantitative as well as qualitative
measurement around all company initiatives, particularly those that support change.
‘Team briefs’ in stores and ‘department huddles’ in the head offices informally capture the current
mood and serve as mediums for which information is exchanged. The Your MS magazine for
employees, video and telephone conferencing and the regular briefing sessions given by the executive
board are further examples of the company taking every opportunity to engage with its employees and,
in doing so, disseminate the employer brand values.
Pemberton says, ‘In terms of quantitative measurement, attendance (or absence), staff turnover, the
DNA (did not arrive) metrics around peak recruitment and the number of speculative CVs received by
the company and converted into job offers all indicate the level to which the employer brand is
contributing to business value.’
Information provided by Juan Pemberton, Head of Recruitment, Learning and Development,
Marks Spencer plc
Recruitment, retention and turnover
27. Diversity
impact of stereotyping (61%) and also monitoring
With regard to diversity, not much has changed since
recruitment and/or information in relation to staff
last year. Table 21 highlights that only half of the
diversity (71%). However, overall these findings
respondents possess a diversity strategy.
highlight that there are opportunities for
improvement, given the business advantages to be
Table 22 indicates a slight increase this year in
gained from creating a diverse workforce.
training interviewers to understand diversity and the
Table 21: Does your organisation have a formal diversity strategy? (%)
All
Manufacturing
and production
Voluntary,
community
and not-for
profit
Private
sector
services
Public
services
Yes
50
36
62
41
83
No
45
58
32
55
14
5
6
6
4
3
Don’t know
Base: 891
Table 22: Methods used to encourage diversity in organisations
Manufacturing
and
Total
production
Voluntary,
community
and notfor-profit
Private
sector
services
Public
services
2006
survey
Monitoring recruitment and/or
staffing information to gain
data on gender, ethnic origin,
disability, age and so on
71
61
80
62
90
66
Training interviewers to
understand what diversity
is about and the impact of
stereotypes
61
56
55
56
75
53
Operating policies that go
beyond basic legislative
requirements on gender,
disability, sexual orientation,
religion and belief
45
37
46
36
66
46
Advertising vacancies in
different sources to widen
interest from under-represented
groups
41
30
55
33
61
41
Checking that any tests used
are valid, reliable and culturefree and were tested on diverse
norm groups
38
35
28
36
43
37
Using specific images/words in
your recruitment advertising to
appeal to a wider audience
37
32
44
32
47
39
Providing recruitment
documents in other formats
(large print, disk and so on)
22
10
29
10
55
23
Setting recruitment targets to
correct a workforce imbalance
12
7
10
6
29
11
Base: 704
Recruitment, retention and turnover
28. At the same time 72% of employers don’t have a policy
Another CIPD survey report – Diversity in Business: A
for recruiting ex-offenders (Figure 10). The CIPD’s
focus for progress – offers employers help in assessing
Employing People with Criminal Records factsheet
their performance on managing diversity and
outlines best practice in recruiting and managing people
determining where they need to focus their attention
with criminal records and contains information on the
to ensure that diversity has a positive impact on
latest government initiatives and consultations.
business performance.
Figure 10: Do you have a policy for recruiting ex-offenders?
3%
25%
Yes
No
72%
Don't know
Base: 855
Recruitment, retention and turnover
29. Managing labour turnover
Labour turnover is inevitable. Yet most employers are looking to achieve favourable levels
of turnover – where it is high organisations face a loss of knowledge and their ability to
meet business objectives comes under threat. In contrast, working environments with very
low turnover tend to become stale and business growth can be limited. This section of our
survey investigates trends in labour turnover and employee retention.
Labour turnover rates
Sample sizes are small in some sector groups (that is,
Our survey shows a median labour turnover rate of
fewer than ten) so results must be interpreted carefully.
18.1% – very much on par with last year’s figure (Table
Although the hotel, catering and leisure industry
23). Figure 11 illustrates that survey participants
remains the sector with the highest level of labour
reported in the main a rise in employees departing the
turnover, the ‘all leavers’ finding in this category of
organisation (39%). Where this information was
32.6% reflects a 10% fall on the 42.5% turnover rate
supplied, evidence suggests that the majority of this
reported in last year’s survey. While this finding relates
turnover is voluntary (Table 24).
to a small sample of five organisations it’s possible the
impact of migrant workers from other EU countries
Table 25 splits labour turnover for all leavers and
may be helping to ease the pressure of high turnover
voluntary leavers into individual industrial sectors.
in this industry.
Table 23: Aggregated rate of labour turnover (%)
2007 survey
2006 survey
2005 survey
2004 survey
18.1
18.3
15.7
16.1
Base: 390 (2007 survey)
Table 24: Labour turnover rates by reason for leaving (%)
Redundancies
0.5 (310)
Dismissed
1.2 (307)
Fixed-/short-term contracts
0.9 (273)
Retired
Voluntary
0.4 (281)
11.5 (340)
Rate shown is median turnover, by reason, of all organisations supplying this information (number of respondents shown in brackets).
Recruitment, retention and turnover
30. Figure 11: Has labour turnover changed between 2005 and 2006 in your organisation?
Yes, increased
32%
39%
Yes, decreased
No, stayed the same
29%
Base: 431
Table 25: Labour turnover rates, by industry sector (%)
All leavers
Voluntary leavers
Manufacturing and production
. (0)
. ()
Agriculture and forestry
13.5 (1)
9.8 (1)
Chemicals, pharmaceuticals and oil
11.4 (10)
6.5 (8)
Construction
27.1 (5)
21.7 (3)
Electricity, gas and water
15.1 (3)
9.6 (3)
7.5 (9)
3.7 (5)
Engineering, electronics and metals
Food, drink and tobacco
16.0 (3)
6.1 (2)
General manufacturing
20.9 (11)
10.6 (10)
Paper and printing
13.7 (4)
9.9 (4)
6.4 (4)
4.1 (3)
Textiles
Other manufacturing and production
11.7 (10)
9.6 (10)
Private sector services
. ()
14.5 (84)
Professional services
20.0 (20)
16.7 (18)
Finance, insurance and real estate
14.5 (14)
9.9 (13)
Hotels, catering and leisure
32.6 (5)
28.3 (5)
IT services
20.8 (8)
12.7 (7)
Call centres
24.6 (6)
19.2 (6)
Media and publishing
27.1 (9)
18.8 (7)
Retail and wholesale
27.5 (5)
10.5 (5)
Transport and storage
20.3 (6)
8.7 (6)
Communications
23.5 (1)
11.7 (1)
18.2 (16)
Other private services
25.8 (20)
Voluntary, community and not-for-profit
. ()
. ()
Care services
25.0 (6)
20.7 (6)
Charity services
14.1 (7)
6.0 (5)
Housing association
12.9 (6)
11.9 (5)
Other voluntary
17.6 (8)
14.2 (6)
Public services
. ()
. ()
6.2 (5)
4.6 (4)
13.1 (9)
7.9 (6)
Health
17.2 (20)
12.0 (20)
Local government
13.7 (8)
7.8 (8)
Other public services
11.6 (12)
3.8 (11)
Central government
Education
Median labour turnover rate shown (number of respondents shown in brackets).
Recruitment, retention and turnover
31. Table 26 shows reported labour turnover rates by
the year. Table 28 highlights that these results are lower
occupation. To understand the distribution of the
than the 2006 survey.
results, further detail is shown in Table 27. (For example,
53% of organisations reported 0% turnover of senior
Figure 12 explains the reasons for those employers’
managers, 10% reported 1–10% turnover).
making ten or more redundancies. Reorganised working
methods and reductions in expenditure remain the two
Redundancies and recruitment freezes
key causes.
As a proportion of aggregate turnover, almost a quarter
of respondent organisations made more than ten
people redundant in 2006 (24%). Twenty-two per cent
also operated a recruitment freeze over the course of
Table 26: Labour turnover rates, by occupation (%)
Senior managers/directors
0.0 (121)
Managers/professionals
10.5 (118)
Administrative, secretarial and technical
15.6 (119)
Services (customer, personal, protective
and sales)
20.0 (74)
Manual/craft workers
15.3 (58)
Median labour turnover rate shown (number of respondents shown in brackets).
Table 27: Labour turnover, by occupational group by categories of turnover rates (%)
Turnover
0%
1–10%
11–20%
21%+
Senior managers/directors
53
10
13
24
Managers/professionals
31
19
25
25
Administrative, secretarial and technical
19
16
24
41
Services (customer, personal, protective
and sales)
19
14
20
47
Manual/craft workers
16
17
33
35
Table 28: Respondents making ten or more redundancies and/or using recruitment freezes (%)
Redundancies
(ten or more)
Recruitment freezes
2007 survey
24
22
2006 survey
28
24
Base: 836 supplying information relating to redundancies and 897 supplying information relating to recruitment freezes
(2007 survey)
0
Recruitment, retention and turnover
32. Figure 12: Factors influencing redundancy decisions
3.9
Reorganised working methods
Reductions in budget/cash limits
3.7
Improved competitiveness/
efficiency/cost reduction
3.3
Lack of demand for products/services
2.6
Plant/office closure
2.5
Merger/acquisition
2.2
Automation/mechanisation/
new equipment
Relocation of work overseas,
for example, offshoring
1.8
1.4
0
1.0
2.0
3.0
4.0
5.0
Importance (1.0 = not important, 5.0 = very important)
Base: 350 (organisations making more than ten redundancies)
Labour turnover and organisational performance
reported a minor, or serious, negative effect to business
As in previous years we sought to capture employers’
performance as a result of employees leaving
views on labour turnover and its impact on organisational
organisations. However, only half of employers were
performance (Figures 13 and 14). Seventy-one per cent
aiming to reduce their level of turnover in 2006 (52%).
Figure 13: Effect of labour turnover on organisational performance
Minor negative effect
56
No effect
25
Serious negative effect
15
Positive effect
6
0
20
Base: 838
40
60
Percentage of respondents
Figure 14: During 2006, did your organisation want to...
Reduce turnover?
38%
52%
Increase turnover?
Maintain current turnover rate?
10%
Base: 838
Recruitment, retention and turnover
33. Our survey also asked some more detailed questions
Further analysis drilled down into the key reasons for
regarding the approaches organisations take to
employee turnover in organisations (Figure 17). In line
collecting and analysing labour turnover data (see
with our 2006 survey findings, a change of career was
Figure 15). The most common method is team/
the most commonly cited cause (52%) for labour
department (69%), but organisations are still unlikely to
turnover. Promotion outside of the organisation (47%),
drill down to uncover the level of turnover among their
level of pay (39%) and a lack of career development
identified high-performing staff.
opportunities (39%) also account for a large majority of
resignations. Twenty-seven per cent of employers also
In an increasingly knowledge-based economy, human
report retirement as a reason for people departing the
capital is fast becoming the most valuable business asset.
organisation in this year’s survey in relation to 19% in
While labour turnover offers one measure of human
our 2006 survey.
capital reporting, there are other types of human capital
data that, when recorded, can provide a powerful
Table 29 (page 34) examines the patterns associated
business case in influencing senior management decisions
with leavers’ length of service. Again, due to the small
and agenda. The latest guidance in this area can be
number of respondents answering this question, data in
found in our human capital factsheet and research.
this area fluctuates every year, so this result should be
treated with caution. Judging by the findings there is
Why and when people leave
still a high proportion of new starters leaving the
Ninety-five per cent of participants taking part in the
organisation within the first six months (19%). This
survey explore the reasons why people leave the
emphasises the importance of the induction process, to
organisation voluntarily. Exit interviews remain the
ensure people joining the organisation are able to
most popular method for gathering this information
integrate effectively into the workplace early on.
(Figure 16), despite the fact that organisations may
receive a truer picture from an anonymous exit survey
The Merchant Hotel in Belfast operates in a
or employee attitude survey as to why individuals leave
high-turnover industry. However, one of the objectives
the organisation.
Figure 15: Approaches taken by organisations to collecting and analysing data relating to labour turnover (%)
Team/department
69
Division
38
37
Job grade/level
Occupation
36
Gender
23
Age
22
Region
20
18
Ethnicity
Identifying high performers
14
Companywide
1
Other
7
None
1
0
Base: 646
Recruitment, retention and turnover
20
40
Percentage of respondents
60
80
34. Figure 16: Methods used to investigate why people leave (%)
Exit interviews
90
Exit surveys
(that is, anonymous questionnaires)
26
Word of mouth
23
Information from staff attitude/
satisfaction surveys
18
0
20
40
Base: 806
60
80
100
Percentage of respondents
Figure 17: Key reasons for employee turnover (%)
Change of career
52
47
Promotion outside the organisation
Level of pay
39
Lack of development or
career opportunities
39
27
Retirement
25
Redundancy
18
Leaving to have/look after children
16
Lack of support from line managers
Stress of job/role
14
13
Ill health (other than stress)
12
Level of working hours
11
Level of workload
Perception of job security
10
Leaving to look after family
members (other than children)
7
Relocation
6
2
Lack of support from colleagues
16
Other
0
10
Base: 805
20
30
40
50
60
Percentage of respondents
of their induction process was to help retain staff.
The CIPD’s factsheet on induction is a good starting
Details of their approach to inducting employees can be
point for employers that are planning to redesign an
found overleaf in our next case study.
existing or implement a new induction programme.
Recruitment, retention and turnover
35. Table 29: Job tenure – leavers’ length of service (%)
2007 survey
2006 survey
Percentage of leavers with 0–6 months’ service
19
19
Percentage of leavers with 7–23 months’ service
28
26
Percentage of leavers with 2–5 years’ service
26
26
Percentage of leavers with over 5 years’ service
24
27
Base: 255
Inducting employees at The Merchant Hotel
The five-star Merchant Hotel opened in Belfast in April 2006. It’s an intimate establishment with only 26
bedrooms and is owned by an independent businessperson. The focus is on food and beverage, with
accommodation revenue accounting for just 20% of the business.
Fiona Humphreys, HR Manager at The Merchant Hotel, says that ‘the organisation’s vision was to create
something that the city had never seen before. It wanted to be the best hotel in Ireland and quite different
from the other hotels in Belfast. For example, a highly trained mixologist was recruited for the cocktail bar and
quirky hallmarks, such as reception staff shaking hands with all guests, were designed to distinguish it from
other hotels.’
From the outset all of the management team were committed to making the business objectives a reality. But
the biggest challenge was how to get staff further down in the organisation to buy into the vision and values
and make it happen. One key initiative to help overcome this challenge was to put all 150 employees through
an induction programme.
The biggest programme HR ran was for those 80 individuals that had been recruited for the hotel opening.
This group of staff consisted of chefs, waiters, bartenders, front-of-house staff, concierge and housekeeping
employees.
The induction programme
The induction programme took place over five days – three days off-site and the remaining two days back
on-site.
Day one was a chance for everyone to get to know one another and included an introduction from the
managing director. Rather than spending time covering the more mundane administrative details, the aim was
to build in lots of teambuilding and learning activities. Taking a bus tour of the city and hearing from a
speaker who had been commissioned to research the history of the hotel building were ways of injecting
some geographical and historical knowledge into the workforce.
Because the business aimed to attract clientele from the top end of the market and knew it would capture
the interest of lots of important people, the hotel arranged for a famous butler, David Anderson from
Hillsborough Castle, to come along and give a talk. This was to share his learning on what to expect from
guests and what customers would expect in return.
Recruitment, retention and turnover
36. Inducting employees at The Merchant Hotel (continued)
On the second day inductees participated in four specifically designed short training sessions. These were on:
• diction – why it’s important, tips on how staff should address guests and what words to use, for instance
‘good morning’ as opposed to ‘hi’
• grooming – as the business had invested £60,000 on staff uniform, it was keen to ensure accessories and
make-up complemented the professional attire. Proper maintenance of the uniform was also crucial
• welcoming customers – how to greet guests, make them feel valued and the psychological impact of how
people are treated during their stay
• turning complaints into opportunities – creating the right mindset so staff understand the implications of
service that stretches above and beyond customer expectations; and how to achieve greater loyalty from
dissatisfied customers.
As customer-facing staff, it was crucial to embed the importance of service at an early stage. At the same
time it helped to set the tone for future training in this area.
By the third day it was time to quiz the new recruits on the company’s policies and procedures. On day one all
of them were given a copy of the staff handbook to read. ‘Through testing their understanding we could
determine their level of knowledge and we thought that this way individuals were more likely to retain the
most important parts of the handbook,’ said Humphreys. Instead of spending time studying the handbook in
depth, the hotel concentrated on building up cross-functional product knowledge, as this was vital in
facilitating a positive customer experience.
To continue with the theme of keeping morale and motivation levels high and developing staff commitment
to the business’s vision, the afternoon was assigned for crazy golf, another teambuilding activity. Taking the
incentive approach one step further, everyone was given the chance at some point in the first few months of
employment to stay overnight at the hotel and have dinner in the Fine Dining Great Room Restaurant. By
stepping into the shoes of the guest it was hoped that employees would understand how their role had an
impact on the customer experience. Feedback was also taken from staff and used to develop them further.
The last two induction days revolved around the more administrative tasks, statutory health and safety training
and time spent with heads of department.
Challenges
With 80 people to train and the hotel not yet operational, the general manager and HR manager had to be
realistic about the design and content of the induction programme. Enlisting the assistance of other managers
was therefore essential, but being new to training meant it was important all of them understood and were
comfortable with their roles. Ensuring part-timers were able to attend was also difficult and in the end some
were unable to go through the process.
Successes
Employee turnover at 24% is low in comparison to the industry norm. And according to Humphreys, ‘The
hotel’s reputation as a prospective employer is excellent. We have no problem attracting new staff and receive
enquiries all the time from staff contacts.’ Not only do employees communicate with one another, but there is
a sense of loyalty and an understanding of service expectations, which is reflected in the customer feedback.
Humphreys believes that ‘the induction programme has laid the foundations to help contribute to our
success’.
Information provided by Fiona Humphreys, HR Manager, The Merchant Hotel, Belfast
Recruitment, retention and turnover
37. Retaining employees
added that the common denominator is feeling valued,
Developing an employee retention strategy is one step
which translates into the need for a more holistic
organisations can take to avoid high levels of turnover.
approach where the benefits of working for the
As well as keeping costs under control, cleverly
organisation are broken down into tangibles, such as
thought-out retention objectives that support resourcing
share options, and intangibles, such as flexible working.
and business goals will also strengthen the internal
employer brand and therefore contribute to the
Someone else commented that managers play a key
organisation’s ability to attract new talent.
role in keeping hold of employees. However, at their
company, retention doesn’t stop when individuals leave,
Overall employee retention difficulties are considerably
only when people don’t respond to their emails. The
up in comparison with last year’s survey (Table 30).
outcome of their policy to call leavers three months
Voluntary and not-for-profit organisations are the only
after their departure has been successful to date in that
sector to buck this underlying trend.
most of them have returned to the organisation.
One focus group member from a private sector
Findings displayed in Table 31 highlight that the increase
organisation explains that skilled people, for instance
in retention difficulties is widespread and not
technicians, are not necessarily thinking of a career
occupation-specific. In comparison with a year ago, the
structure; they’re financially motivated and therefore will
biggest increase has been in the private sector among
move to the company offering the most pay. Obviously
managers and professionals (35%) and administrative,
people have different drivers, but another attendee
secretarial and technical employees (25%).
Table 30: Organisations experiencing retention difficulties (%)
Total
Manufacturing
and production
Voluntary,
community and
not-for-profit
Private
sector
services
Public
services
2007 survey
78
76
75
83
72
2006 survey
69
67
77
70
65
Base: 835 (2007)
Table 31: Retention difficulties, by occupation (%)
Total
Senior managers/
directors
Manufacturing
and production
Voluntary,
community
and not-for
profit
Private sector
services
Public services
8
7
8
8
9
Managers/
professionals
33
28
19
35
37
Administrative,
secretarial and
technical
23
21
20
25
26
Services (customer,
personal, protective
and sales)
22
16
25
28
11
Manual/craft workers
20
28
17
13
10
Base: 835
Recruitment, retention and turnover
38. Figure 18 also shows that employers haven’t been as
proactive in their overall approach to tackling staff
retention in 2006 as they were in 2005.
Figure 18: Steps taken specifically to address staff retention in 2006 (%)
Base: 831
Recruitment, retention and turnover
39. Key challenges and implications
in recruitment, retention and
turnover
John Philpott Chief Economist, CIPD
The media is awash with stories about employment
conditions by reducing redundancies (therefore lowering
trends. But the headline numbers that grab most
involuntary labour turnover), operating fewer
attention – how many more people are in work, what is
recruitment freezes and gradually increasing overall
happening to unemployment and so on – only tell part
recruitment (in the process raising voluntary labour
of the story. Far more interesting is what is going on
turnover by providing potential job-quitters with more
under the surface, as revealed in the CIPD’s annual
alternative job options to choose from). The offsetting
Recruitment, Retention and Turnover surveys. And this
net combination of these recruitment and redundancy
year’s survey – which relates to events in 2006 – once
patterns was thus to leave the overall labour turnover
again offers invaluable insights into the dynamics of the
rate broadly unchanged.
UK labour market, helps provide answers to a number
of puzzling questions posed in the following reflection,
This outcome is consistent with official data (published
and highlights what this means for the work of HR
by the Office for National Statistics (ONS)), which show
professionals.
that the level of job vacancies increased by 20% (to
0.63 million) in 2006, while the level of redundancies
Why is the labour turnover rate unchanged in a
fell by 5% (to 136,000 per quarter). And although
stronger economy?
these figures sit oddly with the annual CIPD survey
The total number of UK employees increased by
finding that the level of recruitment activity was lower
100,000 last year to around 24 million – a net rise of
in 2006 than in 2005, this is because – as the CIPD’s
0.4%. Unemployment meanwhile jumped by 150,000
more regular quarterly Labour Market Outlook surveys
to 1.7 million. These net changes seem quite small. But
show – the pick-up in recruitment activity did not
as the CIPD survey shows, they mask substantial flows
accelerate until the second half of 2006.
of people around the labour market.
How tight is the labour market?
An 18.1% average rate of labour turnover means that
As the annual CIPD survey shows, people leaving their
around 4.4 million people left their jobs in 2006 –
jobs voluntarily account for the bulk (80%) of overall
almost one in five employees. Interestingly, this is nearly
labour turnover – which when translated into figures for
an exact repeat of what happened in 2005 (when the
the whole economy terms amounts to around 3 million
turnover rate was 18.3%) – which is at first sight
employees in 2006. We know from ONS data that
surprising, given that 2006 was a year of much stronger
roughly two-thirds of these moved to another job, the
expansion in the UK economy (the annual rate of
remainder taking time out to search for a job.
growth rising from a well below par 1.8% to a slightly
above par 2.8%). What emerges from the survey, in
Most of the voluntary leavers represent what HR
combination with other evidence, however, is that
practitioners will have experienced as their organisation’s
employers initially responded to improved economic
retention problem – and judging by the survey the
Recruitment, retention and turnover
40. problem generally got worse in 2006 (the proportion of
engaged in recruitment overseas to ‘import’ migrant
employers experiencing retention difficulties increasing
workers to the UK (14%). What is also clear from the
in all the broad sectors of the economy and on average
survey, however, is that this did not provide anything
from 69% to 78%). But every cloud has a silver lining,
like a full solution to recruitment difficulties. The
and one HR professional’s retention problem is simply
incidence of recruitment difficulties not only remained
another’s opportunity to recruit, though recruiters can
very high in 2006 (reported by 84% of employers), but
also turn to people not already in employment – those
in fact got worse in all broad sectors of the economy
just out of school or college going into work for the
apart from the public services even though the supply
first time, students combining work and study, jobless
of labour was expanding.
people seeking work and, of increasing importance in
recent years, immigrants.
It is of course likely that recruitment difficulties would
Economists gauge changes in the total supply of labour
migration, not to mention the fact that migrants
have got worse still in the absence of large-scale
available to employers by observing trends in the
themselves are also consumers of goods and services
so-called ‘economically active’ population, that is people
and therefore add to demand for labour as well as
either in work or not in work but actively looking for
supply. But in addition, as the survey focus groups note,
jobs. This figure currently stands at around 30 million in
migrants sometimes have difficulty with English and
the UK and increased by 370,000 in 2006, boosted
don’t always have the kinds of UK-accredited skills
mainly by migrant workers, especially those from the
and/or relevant work experience employers require. This
eight central and eastern European countries that joined
explains why 80% of migrants from the new EU
the enlarged European Union (EU) in 2004. At least
member states are employed in less skilled jobs earning
580,000 people from these latter countries came to
between £4.50 and £5.99 an hour. It also helps explain
work in the UK in the first two and a half years
why the rate of growth in average earnings including
following EU enlargement. Indeed, the rise in labour
bonus payments increased from 3.6% to 4% during
supply outstripped the gradual improvement in the
2006 even though growth in regular pay slowed. The
demand for labour, which meant that unemployment
greater availability of migrants to perform low-skilled
was higher at the end of the year than at the start of
jobs enabled employers to contain basic pay
the year despite a stronger economy.
settlements, while at the same time offering higher
reward to staff with the skills and experience they want
An increase in supply relative to demand meant that the
to retain without having to greatly inflate the total
labour market overall was less ‘tight’ in 2006 than in
wage bill.
several preceding years. This helps explain why pay
pressure – which is one indicator of the tightness of the
Are employers adopting the right approach to
market – remained subdued. According to the ONS the
recruitment and retention?
annual rate of growth of ‘regular pay’ (that is, excluding
With specialist skills and required experience still in
bonuses) dropped from 3.8% to 3.6% during the
short supply, and the market for the latter therefore
course of 2006 (even though many economic
tight even though the labour supply as a whole has
commentators had raised fears that a sharp rise in price
expanded, it is little wonder that HR professionals
inflation and a higher cost of living would trigger bigger
commonly describe addressing recruitment and
pay rises).
retention pressures as their top priorities.
Are migrant workers the answer to recruitment
The range of initiatives undertaken to address both
difficulties?
problems in 2006 is similar to that identified by CIPD
A larger migrant workforce thus seems to have
surveys over several years. Once again the main
operated as a safety valve against inflationary pay
response to recruitment difficulties is to hire people with
pressure and, as the CIPD survey shows, a quarter of
potential even if they aren’t fully up to the job at the
employers in 2006 were either actively targeting newly
time of recruitment. But the degree to which
arrived EU migrants to fill job vacancies (11%) or
organisations are seeking to tap into relatively
Recruitment, retention and turnover
41. underused sources of potential labour still seems
For example, quit rates decrease with age as workers
limited. For example, the survey finds that only half of
become more settled in jobs and generally face fewer
responding organisations have an explicit diversity
opportunities to switch employers. Employers with
strategy that would guide recruitment practice, with
relatively high proportions of younger staff will therefore
three-quarters lacking a policy for recruiting
tend to have relatively high natural quit rates. This is
ex-offenders. In mitigation employers might argue that
particularly true for hotels, catering and leisure – the
available groups of jobless people, not only ex-offenders
sectors with easily the highest turnover rates in the
but also people that have been living on welfare
survey. Although high turnover in these sectors might,
benefits for long periods of time, lack skills and
as is often suggested, result from low pay, poor working
experience and offer little more, if not less, than migrant
conditions and poor management practice, the age
workers. Yet even so there would appear to be
effect should not be overlooked.
considerable scope for improving diversity practice.
Similarly, as the survey also shows, quit rates are
As for retention, according to the survey the desire for a
relatively low for managerial, professional and highly
change of career, or the possibility of promotion
skilled staff. While people in these occupations will be in
opportunities in another organisation, are the main
demand, they are typically somewhat older than
reasons why employees quit their jobs. The pay on offer
average and will normally have established stable
in a job, though clearly important, is no more significant
positions in their organisations. Yet despite their low
than lack of development or career opportunities within
propensity to quit, workers such as these are often a
an employee’s current organisation. It’s therefore
prime focus of employers’ retention strategies because,
encouraging that increased learning and development
as the survey finds, they cost much more to replace.
opportunities heads the list of initiatives taken by
employers in 2006 to address retention problems. Less
Such factors help explain why almost one in three
encouraging is that improvements in pay and benefits
employers surveyed felt that the level of turnover either
take precedence over improved line management HR
had no effect (25%) or indeed a positive effect (6%) on
skills, even though the bulk of research suggests that
the performance of their organisations, presumably
pay is far more likely to have an effect on quit rates if
because they feel that too little turnover can leave an
relations between managers and potential job-quitters is
organisation short of vibrancy. Nonetheless, the vast
poor or getting poorer. However, this might reflect the
majority of employers reckon that turnover has a serious
survey finding that lack of support from line managers
(15%) or mild (56%) detrimental effect on
came way down the list of factors identified by
organisational performance, while 52% wish to reduce
employers as causing staff to quit in 2006.
it – presenting considerable scope for HR professionals
in those organisations to raise their game.
How much does labour turnover matter?
The survey finds that the cost of labour turnover
averaged £7,750 per job leaver in 2006. The general
assumption is that this should provide an incentive for
employers to minimise turnover. But in advocating this
course it’s important to recognise that a high measured
rate of labour turnover doesn’t necessarily mean that an
employer has a turnover ‘problem’ that needs to be
better managed. While an organisation’s voluntary
labour turnover rate is usually determined in part by the
way in which it manages its people, a variety of other
factors should be adjusted for to establish its ‘natural’
rate of turnover. This, rather than the raw quit rate,
represents the most appropriate measure of how
problematic labour turnover actually is for an employer.
0
Recruitment, retention and turnover
42. Background to the survey
This survey was carried out in February and March 2007 and relates to the period 1 January
to 31 December 2006. The questionnaire was sent to HR professionals in the private, public
and voluntary sectors. In total 905 responses were received.
A profile of the location of survey respondents is
Table 32: Location of staff in respondents’
organisations (%)
provided in Figure 19.
Whole UK
32
London
20
South-east England
20
Midlands
15
North-west England
12
South-west England
10
Yorkshire/Humberside
7
East of England
7
Wales
5
Northern Ireland
9%
9
North-east England
Whole UK 32%
8
Scotland
4
Base: 892
4%
7%
12%
8%
15%
5%
7%
20%
10%
20%
Figure 19: Location of staff in
respondents’ organisations (%)
Recruitment, retention and turnover
43. Table 33 provides a profile of the survey respondents, by
This report uses the standard ‘crude wastage’ method
industrial sector. Figure 20 shows a breakdown of the
to calculate the rate of turnover. This method is
survey sample, by organisation size.
calculated as follows:
Labour turnover =
Table 33: Breakdown of respondent organisations,
by industrial sector (%)
Number of leavers in a set period
x 100
Average number employed in the same period
Manufacturing and
production
27
Private sector services
49
Voluntary, community
and not-for-profit
12
Public services
22
(Please note: leavers includes those leaving the
organisation by way of voluntary or involuntary
severance, redundancies or retirements, but does not
include internal transfers.)
However, readers should be aware that this method has
Base: 897
some shortcomings. For example, it takes no account of
the characteristics of the workforce or the length of
Recruitment
service of the leaver.
A total of 905 respondents supplied information relating
to their organisation’s recruitment practices. Of these,
‘Average’ in the report is used to refer to the statistical
768 were able to supply information relating to the
mean where the data is normally distributed and to the
whole organisation and the remainder supplied
median in the cases where the distribution is
information relating to only one particular unit,
significantly skewed. Note that, in cases where the
department or region.
group sample sizes are small (that is, fewer than ten),
the results should be interpreted with caution.
Labour turnover
A total of 478 survey respondents were able to supply
With the exception of labour turnover rates, all
all the information for us necessary to calculate labour
figures in tables have been rounded to the nearest
turnover on a whole-organisation basis – in keeping
percentage point.
with the previous year’s survey.
Figure 20: Breakdown of samples, by organisation size – UK employees (%)
10%
5%
Fewer than 250
251– 500
16%
46%
501–1,000
1,001–5,000
11%
14%
Base: 891
Recruitment, retention and turnover
5,001–10,000
10,001 or more
44. Further reading
CIPD. (2007) Diversity in business: a focus for progress.
CIPD. (2006) Induction. Factsheet. London: Chartered
Survey report. London: Chartered Institute of Personnel
Institute of Personnel and Development. Available at
and Development. Available at http://www.cipd.co.uk/
http://www.cipd.co.uk/onlineinfodocuments/factsheets.
subjects/dvsequl/general/_dvstybsfcs.htm [Accessed 14
htm [Accessed 14 May 2007].
May 2007].
CIPD. (2006) Labour market outlook: a quarterly report
CIPD. (2007) Employing people with criminal records.
monitoring the state of the UK labour market. London:
Factsheet. London: Chartered Institute of Personnel and
Chartered Institute of Personnel and Development. (4
Development. Available at http://www.cipd.co.uk/
issues) Available at: http://www.cipd.co.uk/
onlineinfodocuments/factsheets.htm [Accessed 14 May
onlineinfodocuments/atozresources.htm [Accessed 14
2007].
May 2007].
CIPD. (2007) Immigration law changes: what employers
All of the above are available for CIPD members to
should know. Factsheet. London: Chartered Institute of
download from the Information Resources section of
Personnel and Development. Available at http://www.
the CIPD website at www.cipd.co.uk
cipd.co.uk/onlineinfodocuments/factsheets.htm
[Accessed 14 May 2007].
Available from the CIPD Bookstore at www.cipd.co.uk/
bookstore:
CIPD. (2006) Diversity in business: how much progress
have employers made? First findings. Survey report.
KEARNS, P., WALTERS, M. and MAYO, A. (2006) What’s
London: Chartered Institute of Personnel and
the future of human capital? Executive briefing. London:
Development. Available at http://www.cipd.co.uk/
Chartered Institute of Personnel and Development.
subjects/dvsequl/general/_dvrstybus.htm?IsSrchRes=1
[Accessed 14 May 2007].
CIPD. (2006) Employee turnover and retention.
Factsheet. London: Chartered Institute of Personnel and
Development. Available at http://www.cipd.co.uk/
onlineinfodocuments/factsheets.htm [Accessed 14 May
2007].
CIPD. (2006) Human capital. Factsheet. London:
Chartered Institute of Personnel and Development.
Available at http://www.cipd.co.uk/
onlineinfodocuments/factsheets.htm [Accessed 14 May
2007].
Recruitment, retention and turnover
45. Acknowledgements
The CIPD is very grateful to those organisations and
individuals who gave their time to take part in this
research. They include:
• Neil Conway of Birkbeck College
• members of the Recruitment Forum Steering
Committee for their input into the survey design
and assistance in piloting the questionnaire
• focus group members whose thoughts and
experiences helped shape the report’s commentary
on the findings
• all those who shared examples of their
organisation’s practices.
We hope that you find the research useful when
considering your own recruitment and retention
practices. Please contact us if you have any questions or
ideas based on our findings (research@cipd.co.uk).
Recruitment, retention and turnover