Download to read offline
![Real Estate Data: Trends & Applications
1Copyright © 2016 ATTOM Data Solutions. All rights reserved. [ CONFIDENTIAL ]](https://image.slidesharecdn.com/attomfayservicingpresentationaugust2018v3-180828232947/85/Real-Estate-Data-Trends-Applications-1-320.jpg)
![Real Estate Data: Trends & Applications
1Copyright © 2016 ATTOM Data Solutions. All rights reserved. [ CONFIDENTIAL ]](https://image.slidesharecdn.com/attomfayservicingpresentationaugust2018v3-180828232947/75/Real-Estate-Data-Trends-Applications-1-2048.jpg)
![What we’ll cover
• Macro housing trends
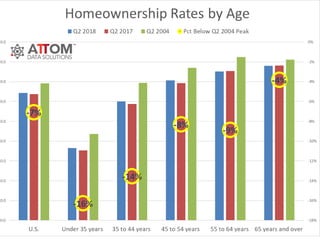
• Homeownership
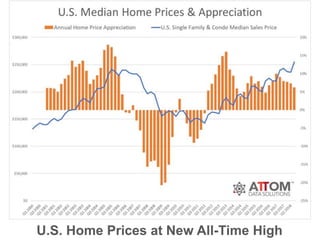
• Home prices
• Affordability
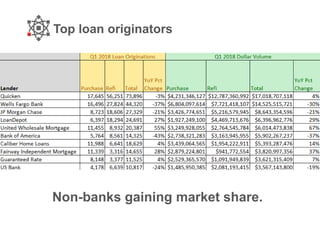
• Loan origination
• Investor-focused housing trends
• Foreclosure
• Home Flipping
• Single Family Rental
• Neighborhood rankings
• Real-Life Applications of Real Estate Data
• Peppered in
2Copyright © 2016 ATTOM Data Solutions. All rights reserved. [ CONFIDENTIAL ]](https://image.slidesharecdn.com/attomfayservicingpresentationaugust2018v3-180828232947/85/Real-Estate-Data-Trends-Applications-2-320.jpg)
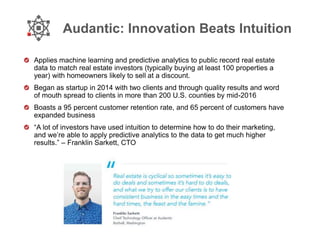
![Clear Capital: Property Valuation
7Copyright © 2018 ATTOM Data Solutions. All rights reserved. [ CONFIDENTIAL ]
Fueling Property Valuation
and Analytics
“ATTOM’s property data solutions are key
to Clear Capital providing accurate and
innovative property valuation products to
the mortgage industry. Whether fueling
our automated analytics like ClearAVM, or
assisting our staff with quality review,
ATTOM’s datasets allow us to set the bar
as a property valuation leader."
Kenon Chen
Clear Capital EVP ProductData Solution
Bulk tax assessor,
recorder deed/mortgage
and pre-foreclosure
Use Case No.1
Integrates public record
property data into various
lender valuation products
Provides tech-driven real estate valuation solutions
to mortgage originators, servicers, GSEs and
capital markets participants](https://image.slidesharecdn.com/attomfayservicingpresentationaugust2018v3-180828232947/85/Real-Estate-Data-Trends-Applications-7-320.jpg)
![15Copyright © 2018 ATTOM Data Solutions. All rights reserved. [ CONFIDENTIAL ]
Designing the Digital Mortgage
Digital mortgage origination for investment
properties (fix-and-flip)
Data Solution
Bulk tax assessor,
recorder deed,
foreclosure
Use Case No.1
Automation of online mortgage
application process and
borrower pre-qualification
Matt Humphrey
LendingHome CEO
“Online lenders like us exist because banks
and large lenders don’t play in this space,
and they aren’t using technology to be
efficient, nimble and fast. Now that
investors have digital-native lenders
catering to them, financing becomes an
attractive alternative to cash. We predict
this trend will continue because 2018 is
already off to an incredible start for us.”
Designing a Digital Mortgage](https://image.slidesharecdn.com/attomfayservicingpresentationaugust2018v3-180828232947/85/Real-Estate-Data-Trends-Applications-15-320.jpg)
![Powering an Online Mortgage Marketplace
16Copyright © 2018 ATTOM Data Solutions. All rights reserved. [ CONFIDENTIAL ]
A leading online loan marketplace helping consumers connect with
multiple lenders for various financial borrowing needs
Data Solution
Bulk tax assessor, recorder
deed/mortgage, AVM
Use Case No.1
Online mortgage application pre-fill and validation with
property characteristics, ownership details, transaction
history and automated valuation model
Powering an Online Mortgage Marketplace](https://image.slidesharecdn.com/attomfayservicingpresentationaugust2018v3-180828232947/85/Real-Estate-Data-Trends-Applications-16-320.jpg)
![LendingHome: Fix-and-Flip Lending
34Copyright © 2018 ATTOM Data Solutions. All rights reserved. [ CONFIDENTIAL ]
Defining a New Industry
Use Case No.2
Market analytics and marketing for the fix-and-flip
lending space
Digital mortgage origination for investment
properties (fix-and-flip)
“Wall Street has become more comfortable
with the fix-and-flip space because they now
have access to four years of performance
data, and they’ve actively watched the
development of this asset class. Large-
scale, low-cost financing coupled with
efficient tech-driven operations — like ours
at LendingHome — means lower fees to
borrowers with terms that work for them.”
Matt Humphrey
LendingHome CEO](https://image.slidesharecdn.com/attomfayservicingpresentationaugust2018v3-180828232947/85/Real-Estate-Data-Trends-Applications-34-320.jpg)
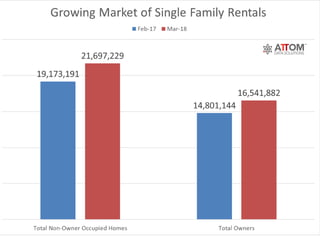
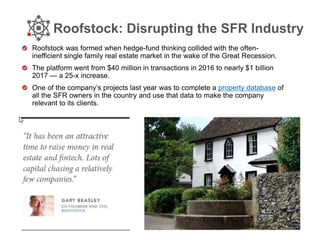

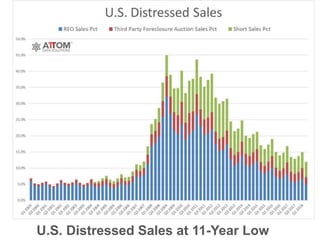
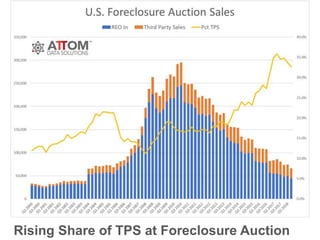
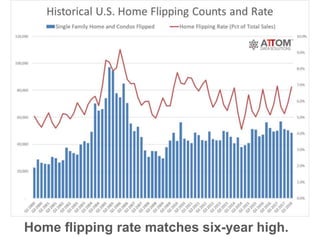
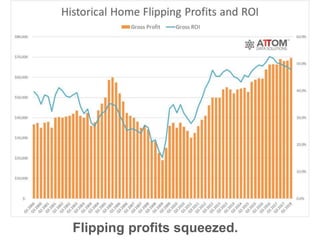
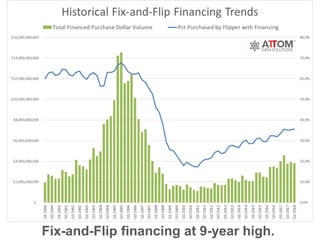
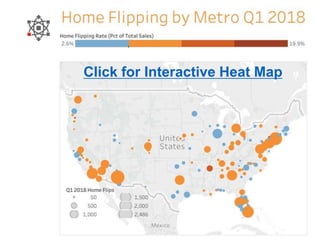
The document discusses various trends and applications in the real estate market, including home prices, loan origination, foreclosure rates, and investor behaviors. It highlights the increasing role of technology in real estate, specifically through data solutions that enhance property valuation and mortgage processes. The report outlines insights from industry leaders and the impact of macroeconomic factors on homeownership and market dynamics.


![[PreMoney SF 2015] Govtech Fund >> Ron Bouganim, "Out With The Old, In With T...](https://cdn.slidesharecdn.com/ss_thumbnails/govtechfundpremoneyv1-150612023447-lva1-app6892-thumbnail.jpg?width=640&height=640&fit=bounds)


