RDDFS Instant INSIGHT is a data analysis tool that provides immediate, intuitive insight into study findings beyond traditional charts. It allows quick identification and analysis of sample subgroups, on-the-fly testing of criteria, and customization for company branding. Users can select which questions appear on interactive charts and tables and then analyze any sample subset by manipulating the selection area. The tool aims to shorten the path from data collection to analysis to presentation.
A seminar on helpful mobile tools and web shortcuts for reporting, source searching, publishing and being productive while reporting from the field. Given 3/27/2013 to the Ontario Community Newspapers Association
Tools and tactics for searching social networks on a real-time basis - and how to verify sources, users, info and photos received via these searches. Presented August 2013 at the Summer School for Investigative Reporting at SSE Riga, Latvia.
Lacoste event of photography and fashion carried out in 2011, at the brazilian cities of São Paulo, Rio de Janeiro an Brasília.
Photos by Bob Wolfenson and Ludovic Careme, styling by Paulo Martinez and copy by Ignácio de Loyola Brandão and a cast of beatiful celebrities.
A presentation aimed at NGOs, non-profit organizations and activists in India about how social media has changed the dynamic with the audience. Delivered in September 2014.
There are many useful Data Mining tools available.
The following is a compiled collection of top handpicked Data Mining tools with their prominent features. The reference list includes both open source and commercial resources.
https://www.datatobiz.com/blog/data-mining-tools/
Extracted data can give you useful insights into what is going on inside and outside your organization, which you can use to make important decisions. You can also take business intelligence services to get valuable insights from big data. To Know more about Business Intelligence Services,visit our website.
https://www.impressico.com/services/technical-capabilities/data-analytics-bi/
Visualr is a Data Visualization Tool. It's been designed to ease the overall process of Dashboarding. Dashboards are basically required to help in the managerial decision making.
Instant Data Discovery with Dashboards and Visual AnalyticsMia Yuan Cao
Join us to learn how you can uncover deeper insights from your data through instant data discovery with JReport. Get a preview of our ad hoc analysis tool called Visual Analytics that enables self-service interactive data analysis powered by in-memory cube technology. With visual feedback and drag and drop actions, JReport let's you explore your data from different perspectives resulting in fast discovery of actionable information.
Program for Show & Tell #1 (10 December 2013)nihshowandtell
This guide describes the applications demonstrated during the inaugural IC Applications Show & Tell event. A brief description of each application is included, along with contact information for the current provider or owner of the application.
This is the introduction of the data visualization software, Visualr. It contains brief detail of the features of Visualr and how data visualization can help your organization in effective decision making.
Top Big data Analytics tools: Emerging trends and Best practicesSpringPeople
For many IT experts, big data analytics tools and technologies are now a top priority. Let's find out the top big data analytics tools in this slide to initialize and advance the process of big data analysis.
Agile Testing Days 2017 Intoducing AgileBI Sustainably - ExcercisesRaphael Branger
"We now do Agile BI too” is often heard in todays BI community. But can you really "create" agile in Business Intelligence projects? This presentation shows that Agile BI doesn't necessarily start with the introduction of an iterative project approach. An organisation is well advised to establish first the necessary foundations in regards to organisation, business and technology in order to become capable of an iterative, incremental project approach in the BI domain.
In this session you learn which building blocks you need to consider. In addition you will see what a meaningful sequence to these building blocks is. Selected aspects like test automation, BI specific design patterns as well as the Disciplined Agile Framework will be explained in more and practical details.
BizViz is a unique BI platform that was built to give users better knowledge and insight into their business. It enables users to assemble data from multiple structured, semi-structured, and unstructured data sources.
BizViz helps analysts provide Descriptive, Diagnostic, Predictive, and Prescriptive analytics in the cloud, on mobile devices, and on-premise. The BizViz platform intersects SMAC (Social Media, Mobility, Analytics, and Cloud). Users can build and interact with dynamic, information-rich dashboards from any device and will be able to enter real-time data from mobile devices.
Looking to learn about Jaspersoft’s dashboards? Our dashboard software combines data and graphical indicators to deliver at-a-glance summaries of information for users to view the state of their business and quickly respond. They can become highly interactive with hyperlinks and filters, what’s the best way to get started? View the ondemand webinar now.
LF Energy Webinar: Electrical Grid Modelling and Simulation Through PowSyBl -...DanBrown980551
Do you want to learn how to model and simulate an electrical network from scratch in under an hour?
Then welcome to this PowSyBl workshop, hosted by Rte, the French Transmission System Operator (TSO)!
During the webinar, you will discover the PowSyBl ecosystem as well as handle and study an electrical network through an interactive Python notebook.
PowSyBl is an open source project hosted by LF Energy, which offers a comprehensive set of features for electrical grid modelling and simulation. Among other advanced features, PowSyBl provides:
- A fully editable and extendable library for grid component modelling;
- Visualization tools to display your network;
- Grid simulation tools, such as power flows, security analyses (with or without remedial actions) and sensitivity analyses;
The framework is mostly written in Java, with a Python binding so that Python developers can access PowSyBl functionalities as well.
What you will learn during the webinar:
- For beginners: discover PowSyBl's functionalities through a quick general presentation and the notebook, without needing any expert coding skills;
- For advanced developers: master the skills to efficiently apply PowSyBl functionalities to your real-world scenarios.
The Metaverse and AI: how can decision-makers harness the Metaverse for their...Jen Stirrup
The Metaverse is popularized in science fiction, and now it is becoming closer to being a part of our daily lives through the use of social media and shopping companies. How can businesses survive in a world where Artificial Intelligence is becoming the present as well as the future of technology, and how does the Metaverse fit into business strategy when futurist ideas are developing into reality at accelerated rates? How do we do this when our data isn't up to scratch? How can we move towards success with our data so we are set up for the Metaverse when it arrives?
How can you help your company evolve, adapt, and succeed using Artificial Intelligence and the Metaverse to stay ahead of the competition? What are the potential issues, complications, and benefits that these technologies could bring to us and our organizations? In this session, Jen Stirrup will explain how to start thinking about these technologies as an organisation.
Securing your Kubernetes cluster_ a step-by-step guide to success !KatiaHIMEUR1
Today, after several years of existence, an extremely active community and an ultra-dynamic ecosystem, Kubernetes has established itself as the de facto standard in container orchestration. Thanks to a wide range of managed services, it has never been so easy to set up a ready-to-use Kubernetes cluster.
However, this ease of use means that the subject of security in Kubernetes is often left for later, or even neglected. This exposes companies to significant risks.
In this talk, I'll show you step-by-step how to secure your Kubernetes cluster for greater peace of mind and reliability.
SAP Sapphire 2024 - ASUG301 building better apps with SAP Fiori.pdfPeter Spielvogel
Building better applications for business users with SAP Fiori.
• What is SAP Fiori and why it matters to you
• How a better user experience drives measurable business benefits
• How to get started with SAP Fiori today
• How SAP Fiori elements accelerates application development
• How SAP Build Code includes SAP Fiori tools and other generative artificial intelligence capabilities
• How SAP Fiori paves the way for using AI in SAP apps
Le nuove frontiere dell'AI nell'RPA con UiPath Autopilot™UiPathCommunity
In questo evento online gratuito, organizzato dalla Community Italiana di UiPath, potrai esplorare le nuove funzionalità di Autopilot, il tool che integra l'Intelligenza Artificiale nei processi di sviluppo e utilizzo delle Automazioni.
📕 Vedremo insieme alcuni esempi dell'utilizzo di Autopilot in diversi tool della Suite UiPath:
Autopilot per Studio Web
Autopilot per Studio
Autopilot per Apps
Clipboard AI
GenAI applicata alla Document Understanding
👨🏫👨💻 Speakers:
Stefano Negro, UiPath MVPx3, RPA Tech Lead @ BSP Consultant
Flavio Martinelli, UiPath MVP 2023, Technical Account Manager @UiPath
Andrei Tasca, RPA Solutions Team Lead @NTT Data
Enhancing Performance with Globus and the Science DMZGlobus
ESnet has led the way in helping national facilities—and many other institutions in the research community—configure Science DMZs and troubleshoot network issues to maximize data transfer performance. In this talk we will present a summary of approaches and tips for getting the most out of your network infrastructure using Globus Connect Server.
Epistemic Interaction - tuning interfaces to provide information for AI supportAlan Dix
Paper presented at SYNERGY workshop at AVI 2024, Genoa, Italy. 3rd June 2024
https://alandix.com/academic/papers/synergy2024-epistemic/
As machine learning integrates deeper into human-computer interactions, the concept of epistemic interaction emerges, aiming to refine these interactions to enhance system adaptability. This approach encourages minor, intentional adjustments in user behaviour to enrich the data available for system learning. This paper introduces epistemic interaction within the context of human-system communication, illustrating how deliberate interaction design can improve system understanding and adaptation. Through concrete examples, we demonstrate the potential of epistemic interaction to significantly advance human-computer interaction by leveraging intuitive human communication strategies to inform system design and functionality, offering a novel pathway for enriching user-system engagements.
Climate Impact of Software Testing at Nordic Testing DaysKari Kakkonen
My slides at Nordic Testing Days 6.6.2024
Climate impact / sustainability of software testing discussed on the talk. ICT and testing must carry their part of global responsibility to help with the climat warming. We can minimize the carbon footprint but we can also have a carbon handprint, a positive impact on the climate. Quality characteristics can be added with sustainability, and then measured continuously. Test environments can be used less, and in smaller scale and on demand. Test techniques can be used in optimizing or minimizing number of tests. Test automation can be used to speed up testing.
zkStudyClub - Reef: Fast Succinct Non-Interactive Zero-Knowledge Regex ProofsAlex Pruden
This paper presents Reef, a system for generating publicly verifiable succinct non-interactive zero-knowledge proofs that a committed document matches or does not match a regular expression. We describe applications such as proving the strength of passwords, the provenance of email despite redactions, the validity of oblivious DNS queries, and the existence of mutations in DNA. Reef supports the Perl Compatible Regular Expression syntax, including wildcards, alternation, ranges, capture groups, Kleene star, negations, and lookarounds. Reef introduces a new type of automata, Skipping Alternating Finite Automata (SAFA), that skips irrelevant parts of a document when producing proofs without undermining soundness, and instantiates SAFA with a lookup argument. Our experimental evaluation confirms that Reef can generate proofs for documents with 32M characters; the proofs are small and cheap to verify (under a second).
Paper: https://eprint.iacr.org/2023/1886
Removing Uninteresting Bytes in Software FuzzingAftab Hussain
Imagine a world where software fuzzing, the process of mutating bytes in test seeds to uncover hidden and erroneous program behaviors, becomes faster and more effective. A lot depends on the initial seeds, which can significantly dictate the trajectory of a fuzzing campaign, particularly in terms of how long it takes to uncover interesting behaviour in your code. We introduce DIAR, a technique designed to speedup fuzzing campaigns by pinpointing and eliminating those uninteresting bytes in the seeds. Picture this: instead of wasting valuable resources on meaningless mutations in large, bloated seeds, DIAR removes the unnecessary bytes, streamlining the entire process.
In this work, we equipped AFL, a popular fuzzer, with DIAR and examined two critical Linux libraries -- Libxml's xmllint, a tool for parsing xml documents, and Binutil's readelf, an essential debugging and security analysis command-line tool used to display detailed information about ELF (Executable and Linkable Format). Our preliminary results show that AFL+DIAR does not only discover new paths more quickly but also achieves higher coverage overall. This work thus showcases how starting with lean and optimized seeds can lead to faster, more comprehensive fuzzing campaigns -- and DIAR helps you find such seeds.
- These are slides of the talk given at IEEE International Conference on Software Testing Verification and Validation Workshop, ICSTW 2022.
Encryption in Microsoft 365 - ExpertsLive Netherlands 2024Albert Hoitingh
In this session I delve into the encryption technology used in Microsoft 365 and Microsoft Purview. Including the concepts of Customer Key and Double Key Encryption.
Elevating Tactical DDD Patterns Through Object CalisthenicsDorra BARTAGUIZ
After immersing yourself in the blue book and its red counterpart, attending DDD-focused conferences, and applying tactical patterns, you're left with a crucial question: How do I ensure my design is effective? Tactical patterns within Domain-Driven Design (DDD) serve as guiding principles for creating clear and manageable domain models. However, achieving success with these patterns requires additional guidance. Interestingly, we've observed that a set of constraints initially designed for training purposes remarkably aligns with effective pattern implementation, offering a more ‘mechanical’ approach. Let's explore together how Object Calisthenics can elevate the design of your tactical DDD patterns, offering concrete help for those venturing into DDD for the first time!
Why You Should Replace Windows 11 with Nitrux Linux 3.5.0 for enhanced perfor...SOFTTECHHUB
The choice of an operating system plays a pivotal role in shaping our computing experience. For decades, Microsoft's Windows has dominated the market, offering a familiar and widely adopted platform for personal and professional use. However, as technological advancements continue to push the boundaries of innovation, alternative operating systems have emerged, challenging the status quo and offering users a fresh perspective on computing.
One such alternative that has garnered significant attention and acclaim is Nitrux Linux 3.5.0, a sleek, powerful, and user-friendly Linux distribution that promises to redefine the way we interact with our devices. With its focus on performance, security, and customization, Nitrux Linux presents a compelling case for those seeking to break free from the constraints of proprietary software and embrace the freedom and flexibility of open-source computing.
Dev Dives: Train smarter, not harder – active learning and UiPath LLMs for do...UiPathCommunity
💥 Speed, accuracy, and scaling – discover the superpowers of GenAI in action with UiPath Document Understanding and Communications Mining™:
See how to accelerate model training and optimize model performance with active learning
Learn about the latest enhancements to out-of-the-box document processing – with little to no training required
Get an exclusive demo of the new family of UiPath LLMs – GenAI models specialized for processing different types of documents and messages
This is a hands-on session specifically designed for automation developers and AI enthusiasts seeking to enhance their knowledge in leveraging the latest intelligent document processing capabilities offered by UiPath.
Speakers:
👨🏫 Andras Palfi, Senior Product Manager, UiPath
👩🏫 Lenka Dulovicova, Product Program Manager, UiPath
Dev Dives: Train smarter, not harder – active learning and UiPath LLMs for do...
Rddfs instant insight
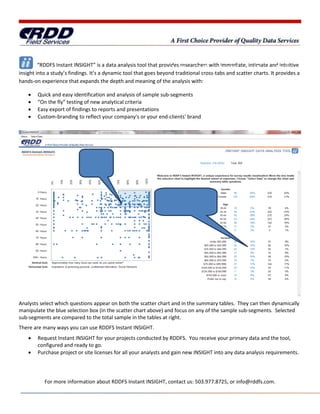
1. RDDFS Instant INSIGHT
“RDDFS Instant INSIGHT” is a data analysis tool that provides researchers with immediate, intimate and intuitive
A New Way to View Your Data
insight into a study’s findings. It’s a dynamic tool that goes beyond traditional cross tabs and scatter charts. It provides a
cross-tabs
hands-on experience that expands the depth and meaning of the analysis with:
pth
• Quick and easy identification and analysis of sample sub
sub-segments
• “On the fly” testing of new analytical criteria
• Easy export of findings to reports and presentations
rts
• Custom-branding to reflect your cocompany's or your end-clients' brand
Dynamic
selection
box.
Blue column provides a
profile of selected
segment.
Analysts select which questions appear on both the scatter chart and in the summary tables. They can then dynamically
manipulate the blue selection box (in the scatter chart above) and focus on any of the sample sub-segments. Selected
sub
sub-segments are compared to the total sample in the tables at right.
segments
There are many ways you can use RDDFS Instant INSIGHT.
• Request Instant INSIGHT for your projects conducted by RDDFS. You receive your primary data and the tool,
r RDDFS.
configured and ready to go.
• Purchase project or site licenses for all your analysts and gain new INSIGHT into any data analysis requirements.
new analysi
For more information about RDDFS Instant INSIGHT, contact us: 503.977.8725, or info@rddfs.com.
,
2. Instant INSIGHT FAQs
1. What is Instant INSIGHT? RDDFS Instant INSIGHT is a data analysis tool that provides researchers with
immediate, intimate and intuitive insight into a study’s findings. Instant INSIGHT is a dynamic tool that goes
beyond traditional cross-tabs and scatter charts.
tabs
2. Why is Instant INSIGHT useful? Instant INSIGHT is a flexible and powerful tool for shortening the path
between survey data collection, analysis, and display. Any RDDFS client can rapidly deliver survey data in
customer-ready Instant INSIGHT format fast and effectively.
3. How do I use Instant INSIGHT? Go to http://www.rddfs.com to download and install the Instant INSIGHT
Viewer on a Win7, Vista, or XP computer with Excel 2007 version or later using the “getting Started”
instructions below.
4. What type of survey data can Instant INSIGHT display? Instant INSIGHT’s display and selection chart is
compatible with survey data for up to 11 point answers as well as continuous data. Instant IN
INSIGHT’s tables use
any type, number or combination of data codes for segment display and analysis.
5. Can I use my own survey data with Instant INSIGHT? Yes! Existing or non RDDFS sourced data can be used by
any authorized Instant INSIGHT user.
6. How can I purchase Instant INSIGHT? There are two easy options. First, purchase pre-configured data from
pre
RDDFS. Second, purchase a single project or unlimited project configuration site license from RDDFS.
7. Is Instant INSIGHT training available? Yes! RDDFS and its authorized partners provide flexible training options
to meet any need. Please contact your RDDFS account representative for a quote.
8. How is Instant INSIGHT supported? RDDFS and its authorized partners issue periodic program updates. Simply
say “yes” when Instant INSIGHT asks for permission to install an update and follow the instructions.
s”
9. Can Instant INSIGHT be rebranded for my purposes? Yes! Individual project files can be branded as you desire
during configuration. Instant INSIGHT can also be branded as desired (new name, icons, splash screens, etc.) as
desired for preferred partners. Please contact RDDFS for more information.
10. Can my firm resell Instant INSIGHT services? Yes! Simply purchase a quantity of project licenses at an agreed
upon price, add value with customer configuration services, and resell the project to your clients.
For more information about RDDFS Instant INSIGHT, contact us: 503.977.8725, or info@rddfs.com.
,
3. Getting Started With RDDFS Instant INSIGHT
1. View Project Data Before Installing the Free Application
An email attached zip file from RDDFS contains thre Instant INSIGHT screen shots. View these screen shots to better
three
understand how Instant Insight users select segments and view detail results.
detailed
2. Installing the Application
Select and install the Instant INSIGHT application sent by an email attachment (zip file) or go to http://www.rddfs.com to
download and install Instant INSIGHT on a Win7, Vista, or XP computer with Excel 2007 version or later. Despite
version
common security warnings that apply to all programs, Instant INSIGHT is a safe digitally signed application.
ll
3. Viewing Sample Project Data
Open one of the RDDFS Instant INSIGHT sample project files sent by email attachment (zip file) or download the
demonstration project data file at http://www.rddfs.com Double-click any file with the “ii” icon and “.viewer”
http://www.rddfs.com.
extension to open the file in Instant INSIGHT.
4. Exploring Project Data
To change display data: Select “Select Data” at the top of the Instant INSIGHT screen and choose the questions to display
on the chart axes and which tables to display.
To select a data subset: Drag or reshape the selection box to the segment of interest. The first two table data columns
display the count and percentage of the box selection, the second two columns show sample count and percentage
values.
5. Authoring Project Data Files
The same Instant INSIGHT application is used to view and author project data files. Please contact an RDDFS Account
lease
Executive at info@rddfs.com for more details
details.
For more information about RDDFS Instant INSIGHT, contact us: 503.977.8725, or info@rddfs.com.
,