RAVI YADAV(2019-20) Departmentof Horticulture Vegetable Science, Email ID
raja.hiran8982@gmail.com
Randomized Block Experiment With Excel
How to Install the Data Analysis Tool Pak in Excel:
To access advanced analytical functions in Excel, you need a free Microsoft add-in called the Analysis
ToolPak, which may or may not be already installed on your copy of Excel.
To determine whether you have the Analysis ToolPak, click the Data tab in the main Excel menu. If you
see Data Analysis in the Analysis section, you're good. You have the ToolPak.
एक्सेल में उन्नत विश्लेषणात्मक कार्यों तक पहुंचने के ललए, आपको एक मफ्त Microsoft ऐड-इन नामक विश्लेषण टूलपैक
की आिश्र्यकता है, जो आपके एक्सेल की प्रततललवप पर पहले से ही स्थावपत हो भी सकता है और नहीुं भी।
र्यह तनर्ााररत करने के ललए कक आपके पास विश्लेषण टूलपैक है, मख्र्य एक्सेल मेनू में डेटा टैब पर क्क्लक करें। र्यदि आप
विश्लेषण अनभाग में डेटा विश्लेषण िेखते हैं, तो आप अच्छे हैं। आपके पास टूलपैक है।
If you don't have the Tool Pak, here's how to get it:
• Click the File tab in the main
menu.
• In the list of menu items under
the File tab, click the Options
item to display the Excel
Options dialog box.
र्यदि आपके पास टूलपैक नहीुं है, तो इसे प्राप्त
करने का तरीका र्यहाुं बतार्या गर्या है:
• मख्र्य मेनू में फाइल टैब पर क्क्लक
करें।
• फाइल टैब के अुंतगात मेनू आइटम की
सूची में, Excel विकल्प सुंिाि बॉक्स
2.
RAVI YADAV(2019-20) Departmentof Horticulture Vegetable Science, Email ID
raja.hiran8982@gmail.com
प्रिलशात करने के ललए विकल्प आइटम पर क्क्लक करें।
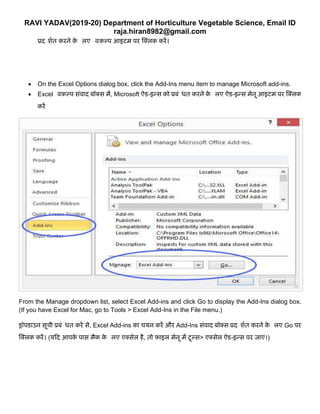
• On the Excel Options dialog box, click the Add-Ins menu item to manage Microsoft add-ins.
• Excel विकल्प सुंिाि बॉक्स में, Microsoft ऐड-इन्स को प्रबुंधर्त करने के ललए ऐड-इन्स मेनू आइटम पर क्क्लक
करें
From the Manage dropdown list, select Excel Add-ins and click Go to display the Add-Ins dialog box.
(If you have Excel for Mac, go to Tools > Excel Add-Ins in the File menu.)
ड्रॉपडाउन सूची प्रबुंधर्त करें से, Excel Add-ins का चर्यन करें और Add-Ins सुंिाि बॉक्स प्रिलशात करने के ललए Go पर
क्क्लक करें। (र्यदि आपके पास मैक के ललए एक्सेल है, तो फाइल मेनू में टूल्स> एक्सेल ऐड-इन्स पर जाएुं।)
3.
RAVI YADAV(2019-20) Departmentof Horticulture Vegetable Science, Email ID
raja.hiran8982@gmail.com
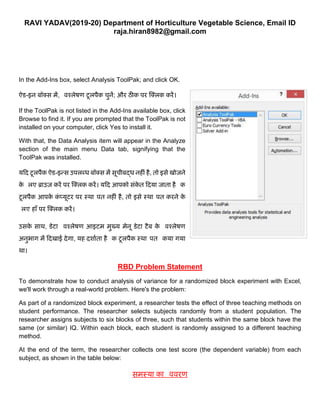
In the Add-Ins box, select Analysis ToolPak; and click OK.
ऐड-इन बॉक्स में, विश्लेषण टूलपैक चनें; और ठीक पर क्क्लक करें।
If the ToolPak is not listed in the Add-Ins available box, click
Browse to find it. If you are prompted that the ToolPak is not
installed on your computer, click Yes to install it.
With that, the Data Analysis item will appear in the Analyze
section of the main menu Data tab, signifying that the
ToolPak was installed.
र्यदि टूलपैक ऐड-इन्स उपलब्र् बॉक्स में सूचीबद्र् नहीुं है, तो इसे खोजने
के ललए ब्राउज़ करें पर क्क्लक करें। र्यदि आपको सुंके त दिर्या जाता है कक
टूलपैक आपके कुं प्र्यूटर पर स्थावपत नहीुं है, तो इसे स्थावपत करने के
ललए हााँ पर क्क्लक करें।
उसके साथ, डेटा विश्लेषण आइटम मख्र्य मेनू डेटा टैब के विश्लेषण
अनभाग में दिखाई िेगा, र्यह िशााता है कक टूलपैक स्थावपत ककर्या गर्या
था।
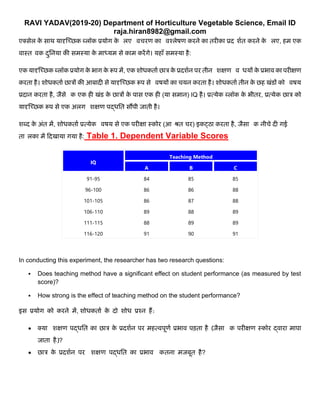
RBD Problem Statement
To demonstrate how to conduct analysis of variance for a randomized block experiment with Excel,
we'll work through a real-world problem. Here's the problem:
As part of a randomized block experiment, a researcher tests the effect of three teaching methods on
student performance. The researcher selects subjects randomly from a student population. The
researcher assigns subjects to six blocks of three, such that students within the same block have the
same (or similar) IQ. Within each block, each student is randomly assigned to a different teaching
method.
At the end of the term, the researcher collects one test score (the dependent variable) from each
subject, as shown in the table below:
समस्र्या का वििरण
4.
RAVI YADAV(2019-20) Departmentof Horticulture Vegetable Science, Email ID
raja.hiran8982@gmail.com
एक्सेल के साथ र्यादृक्च्छक ब्लॉक प्रर्योग के ललए विचरण का विश्लेषण करने का तरीका प्रिलशात करने के ललए, हम एक
िास्तविक ितनर्या की समस्र्या के माध्र्यम से काम करेंगे। र्यहााँ समस्र्या है:
एक र्यादृक्च्छक ब्लॉक प्रर्योग के भाग के रूप में, एक शोर्कताा छात्र के प्रिशान पर तीन लशक्षण विधर्र्यों के प्रभाि का परीक्षण
करता है। शोर्कताा छात्रों की आबािी से र्यादृक्च्छक रूप से विषर्यों का चर्यन करता है। शोर्कताा तीन के छह खुंडों को विषर्य
प्रिान करता है, जैसे कक एक ही खुंड के छात्रों के पास एक ही (र्या समान) IQ है। प्रत्र्येक ब्लॉक के भीतर, प्रत्र्येक छात्र को
र्यादृक्च्छक रूप से एक अलग लशक्षण पद्र्तत सौंपी जाती है।
शब्ि के अुंत में, शोर्कताा प्रत्र्येक विषर्य से एक परीक्षा स्कोर (आधित चर) इकट्ठा करता है, जैसा कक नीचे िी गई
ताललका में दिखार्या गर्या है: Table 1. Dependent Variable Scores
In conducting this experiment, the researcher has two research questions:
▪ Does teaching method have a significant effect on student performance (as measured by test
score)?
▪ How strong is the effect of teaching method on the student performance?
इस प्रर्योग को करने में, शोर्कताा के िो शोर् प्रश्न हैं:
• क्र्या लशक्षण पद्र्तत का छात्र के प्रिशान पर महत्िपूणा प्रभाि पड़ता है (जैसा कक परीक्षण स्कोर द्िारा मापा
जाता है)?
• छात्र के प्रिशान पर लशक्षण पद्र्तत का प्रभाि ककतना मजबूत है?
IQ
Teaching Method
A B C
91-95 84 85 85
96-100 86 86 88
101-105 86 87 88
106-110 89 88 89
111-115 88 89 89
116-120 91 90 91
5.
RAVI YADAV(2019-20) Departmentof Horticulture Vegetable Science, Email ID
raja.hiran8982@gmail.com
Randomized Block ANOVA With Excel
When you conduct a one-way analysis of variance with Excel, the main output is an ANOVA summary
table. As we've seen in previous lessons, an ANOVA summary table holds all the information we need
to answer the research questions posed above.
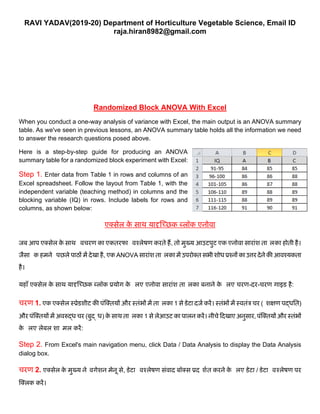
Here is a step-by-step guide for producing an ANOVA
summary table for a randomized block experiment with Excel:
Step 1. Enter data from Table 1 in rows and columns of an
Excel spreadsheet. Follow the layout from Table 1, with the
independent variable (teaching method) in columns and the
blocking variable (IQ) in rows. Include labels for rows and
columns, as shown below:
एक्सेल के साथ र्यादृक्च्छक ब्लॉक एनोिा
जब आप एक्सेल के साथ विचरण का एकतरफा विश्लेषण करते हैं, तो मख्र्य आउटपट एक एनोिा साराुंश ताललका होती है।
जैसा कक हमने वपछले पाठों में िेखा है, एक ANOVA साराुंश ताललका में उपरोक्त सभी शोर् प्रश्नों का उत्तर िेने की आिश्र्यकता
है।
र्यहााँ एक्सेल के साथ र्यादृक्च्छक ब्लॉक प्रर्योग के ललए एनोिा साराुंश ताललका बनाने के ललए चरण-िर-चरण गाइड है:
चरण 1. एक एक्सेल स्प्रेडशीट की पुंक्क्तर्यों और स्तुंभों में ताललका 1 से डेटा िजा करें। स्तुंभों में स्ितुंत्र चर (लशक्षण पद्र्तत)
और पुंक्क्तर्यों में अिरुद्र् चर (बद्धर्) के साथ ताललका 1 से लेआउट का पालन करें। नीचे दिखाए अनसार, पुंक्क्तर्यों और स्तुंभों
के ललए लेबल शालमल करें:
Step 2. From Excel's main navigation menu, click Data / Data Analysis to display the Data Analysis
dialog box.
चरण 2. एक्सेल के मख्र्य नेविगेशन मेनू से, डेटा विश्लेषण सुंिाि बॉक्स प्रिलशात करने के ललए डेटा / डेटा विश्लेषण पर
क्क्लक करें।
6.
RAVI YADAV(2019-20) Departmentof Horticulture Vegetable Science, Email ID
raja.hiran8982@gmail.com
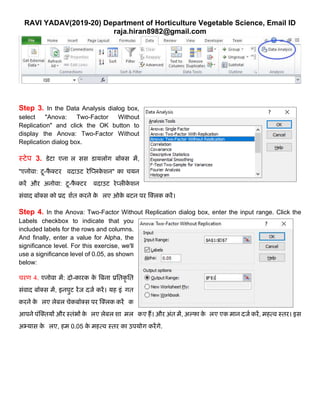
Step 3. In the Data Analysis dialog box,
select "Anova: Two-Factor Without
Replication" and click the OK button to
display the Anova: Two-Factor Without
Replication dialog box.
स्टेप 3. डेटा एनालललसस डार्यलॉग बॉक्स में,
"एनोिा: टू-फै क्टर वििाउट रेक्प्लके शन" का चर्यन
करें और अनोिा: टू-फै क्टर वििाउट रेप्लीके शन
सुंिाि बॉक्स को प्रिलशात करने के ललए ओके बटन पर क्क्लक करें।
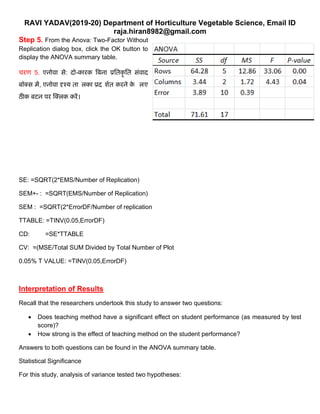
Step 4. In the Anova: Two-Factor Without Replication dialog box, enter the input range. Click the
Labels checkbox to indicate that you
included labels for the rows and columns.
And finally, enter a value for Alpha, the
significance level. For this exercise, we'll
use a significance level of 0.05, as shown
below:
चरण 4. एनोिा में: िो-कारक के बबना प्रततकृ तत
सुंिाि बॉक्स में, इनपट रेंज िजा करें। र्यह इुंधगत
करने के ललए लेबल चेकबॉक्स पर क्क्लक करें कक
आपने पुंक्क्तर्यों और स्तुंभों के ललए लेबल शालमल ककए हैं। और अुंत में, अल्फा के ललए एक मान िजा करें, महत्ि स्तर। इस
अभ्र्यास के ललए, हम 0.05 के महत्ि स्तर का उपर्योग करेंगे.
7.
RAVI YADAV(2019-20) Departmentof Horticulture Vegetable Science, Email ID
raja.hiran8982@gmail.com
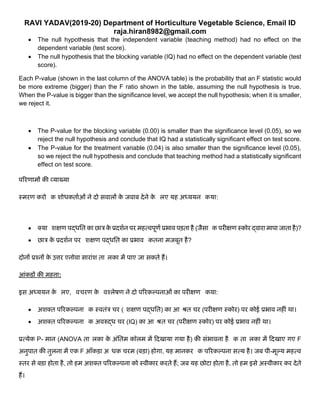
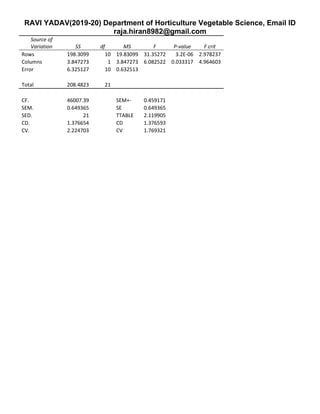
Step 5. From the Anova: Two-Factor Without
Replication dialog box, click the OK button to
display the ANOVA summary table.
चरण 5. एनोिा से: िो-कारक बबना प्रततकृ तत सुंिाि
बॉक्स में, एनोिा दृश्र्य ताललका प्रिलशात करने के ललए
ठीक बटन पर क्क्लक करें।
SE: =SQRT(2*EMS/Number of Replication)
SEM+- : =SQRT(EMS/Number of Replication)
SEM : =SQRT(2*ErrorDF/Number of replication
TTABLE: =TINV(0.05,ErrorDF)
CD: =SE*TTABLE
CV: =(MSE/Total SUM Divided by Total Number of Plot
0.05% T VALUE: =TINV(0.05,ErrorDF)
Interpretation of Results
Recall that the researchers undertook this study to answer two questions:
• Does teaching method have a significant effect on student performance (as measured by test
score)?
• How strong is the effect of teaching method on the student performance?
Answers to both questions can be found in the ANOVA summary table.
Statistical Significance
For this study, analysis of variance tested two hypotheses:
8.
RAVI YADAV(2019-20) Departmentof Horticulture Vegetable Science, Email ID
raja.hiran8982@gmail.com
• The null hypothesis that the independent variable (teaching method) had no effect on the
dependent variable (test score).
• The null hypothesis that the blocking variable (IQ) had no effect on the dependent variable (test
score).
Each P-value (shown in the last column of the ANOVA table) is the probability that an F statistic would
be more extreme (bigger) than the F ratio shown in the table, assuming the null hypothesis is true.
When the P-value is bigger than the significance level, we accept the null hypothesis; when it is smaller,
we reject it.
• The P-value for the blocking variable (0.00) is smaller than the significance level (0.05), so we
reject the null hypothesis and conclude that IQ had a statistically significant effect on test score.
• The P-value for the treatment variable (0.04) is also smaller than the significance level (0.05),
so we reject the null hypothesis and conclude that teaching method had a statistically significant
effect on test score.
पररणामों की व्र्याख्र्या
स्मरण करो कक शोर्कतााओुं ने िो सिालों के जिाब िेने के ललए र्यह अध्र्यर्यन ककर्या:
• क्र्या लशक्षण पद्र्तत का छात्र के प्रिशान पर महत्िपूणा प्रभाि पड़ता है (जैसा कक परीक्षण स्कोर द्िारा मापा जाता है)?
• छात्र के प्रिशान पर लशक्षण पद्र्तत का प्रभाि ककतना मजबूत है?
िोनों प्रश्नों के उत्तर एनोिा साराुंश ताललका में पाए जा सकते हैं।
आंकड़ों की महत्ता:
इस अध्र्यर्यन के ललए, विचरण के विश्लेषण ने िो पररकल्पनाओुं का परीक्षण ककर्या:
• अशक्त पररकल्पना कक स्ितुंत्र चर (लशक्षण पद्र्तत) का आधित चर (परीक्षण स्कोर) पर कोई प्रभाि नहीुं था।
• अशक्त पररकल्पना कक अिरुद्र् चर (IQ) का आधित चर (परीक्षण स्कोर) पर कोई प्रभाि नहीुं था।
प्रत्र्येक P- मान (ANOVA ताललका के अुंततम कॉलम में दिखार्या गर्या है) की सुंभािना है कक ताललका में दिखाए गए F
अनपात की तलना में एक F आाँकड़ा अधर्क चरम (बड़ा) होगा, र्यह मानकर कक पररकल्पना सत्र्य है। जब पी-मूल्र्य महत्ि
स्तर से बड़ा होता है, तो हम अशक्त पररकल्पना को स्िीकार करते हैं; जब र्यह छोटा होता है, तो हम इसे अस्िीकार कर िेते
हैं।
9.
RAVI YADAV(2019-20) Departmentof Horticulture Vegetable Science, Email ID
raja.hiran8982@gmail.com
• अिरुद्र् चर (0.00) के ललए पी-मान महत्ि स्तर (0.05) से छोटा है, इसललए हम अशक्त पररकल्पना को अस्िीकार
करते हैं और तनष्कषा तनकालते हैं कक बद्धर् का परीक्षण स्कोर पर साुंक्ख्र्यकीर्य रूप से महत्िपूणा प्रभाि था।
• उपचार चर (0.04) के ललए पी-मान भी महत्ि स्तर (0.05) से छोटा है, इसललए हम अशक्त पररकल्पना को
अस्िीकार करते हैं और तनष्कषा तनकालते हैं कक लशक्षण पद्र्तत का परीक्षण स्कोर पर साुंक्ख्र्यकीर्य रूप से महत्िपूणा
प्रभाि था।
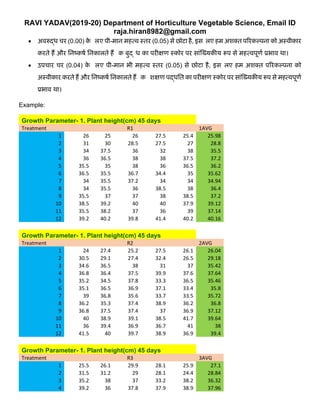
Example:
Growth Parameter- 1. Plant height(cm) 45 days
Treatment R1 1AVG
1 26 25 26 27.5 25.4 25.98
2 31 30 28.5 27.5 27 28.8
3 34 37.5 36 32 38 35.5
4 36 36.5 38 38 37.5 37.2
5 35.5 35 38 36 36.5 36.2
6 36.5 35.5 36.7 34.4 35 35.62
7 34 35.5 37.2 34 34 34.94
8 34 35.5 36 38.5 38 36.4
9 35.5 37 37 38 38.5 37.2
10 38.5 39.2 40 40 37.9 39.12
11 35.5 38.2 37 36 39 37.14
12 39.2 40.2 39.8 41.4 40.2 40.16
Growth Parameter- 1. Plant height(cm) 45 days
Treatment R2 2AVG
1 24 27.4 25.2 27.5 26.1 26.04
2 30.5 29.1 27.4 32.4 26.5 29.18
3 34.6 36.5 38 31 37 35.42
4 36.8 36.4 37.5 39.9 37.6 37.64
5 35.2 34.5 37.8 33.3 36.5 35.46
6 35.1 36.5 36.9 37.1 33.4 35.8
7 39 36.8 35.6 33.7 33.5 35.72
8 36.2 35.3 37.4 38.9 36.2 36.8
9 36.8 37.5 37.4 37 36.9 37.12
10 40 38.9 39.1 38.5 41.7 39.64
11 36 39.4 36.9 36.7 41 38
12 41.5 40 39.7 38.9 36.9 39.4
Growth Parameter- 1. Plant height(cm) 45 days
Treatment R3 3AVG
1 25.5 26.1 29.9 28.1 25.9 27.1
2 31.5 31.2 29 28.1 24.4 28.84
3 35.2 38 37 33.2 38.2 36.32
4 39.2 36 37.8 37.9 38.9 37.96