Downloaded 10 times

![Overview what will happen (a bit under the hood)
Spring boot applica.on
Spring Cloud Sleuth
Spring Cloud Zipkin
Brave’s
Tracing
Zipkin’s
Reporter
Traces, span
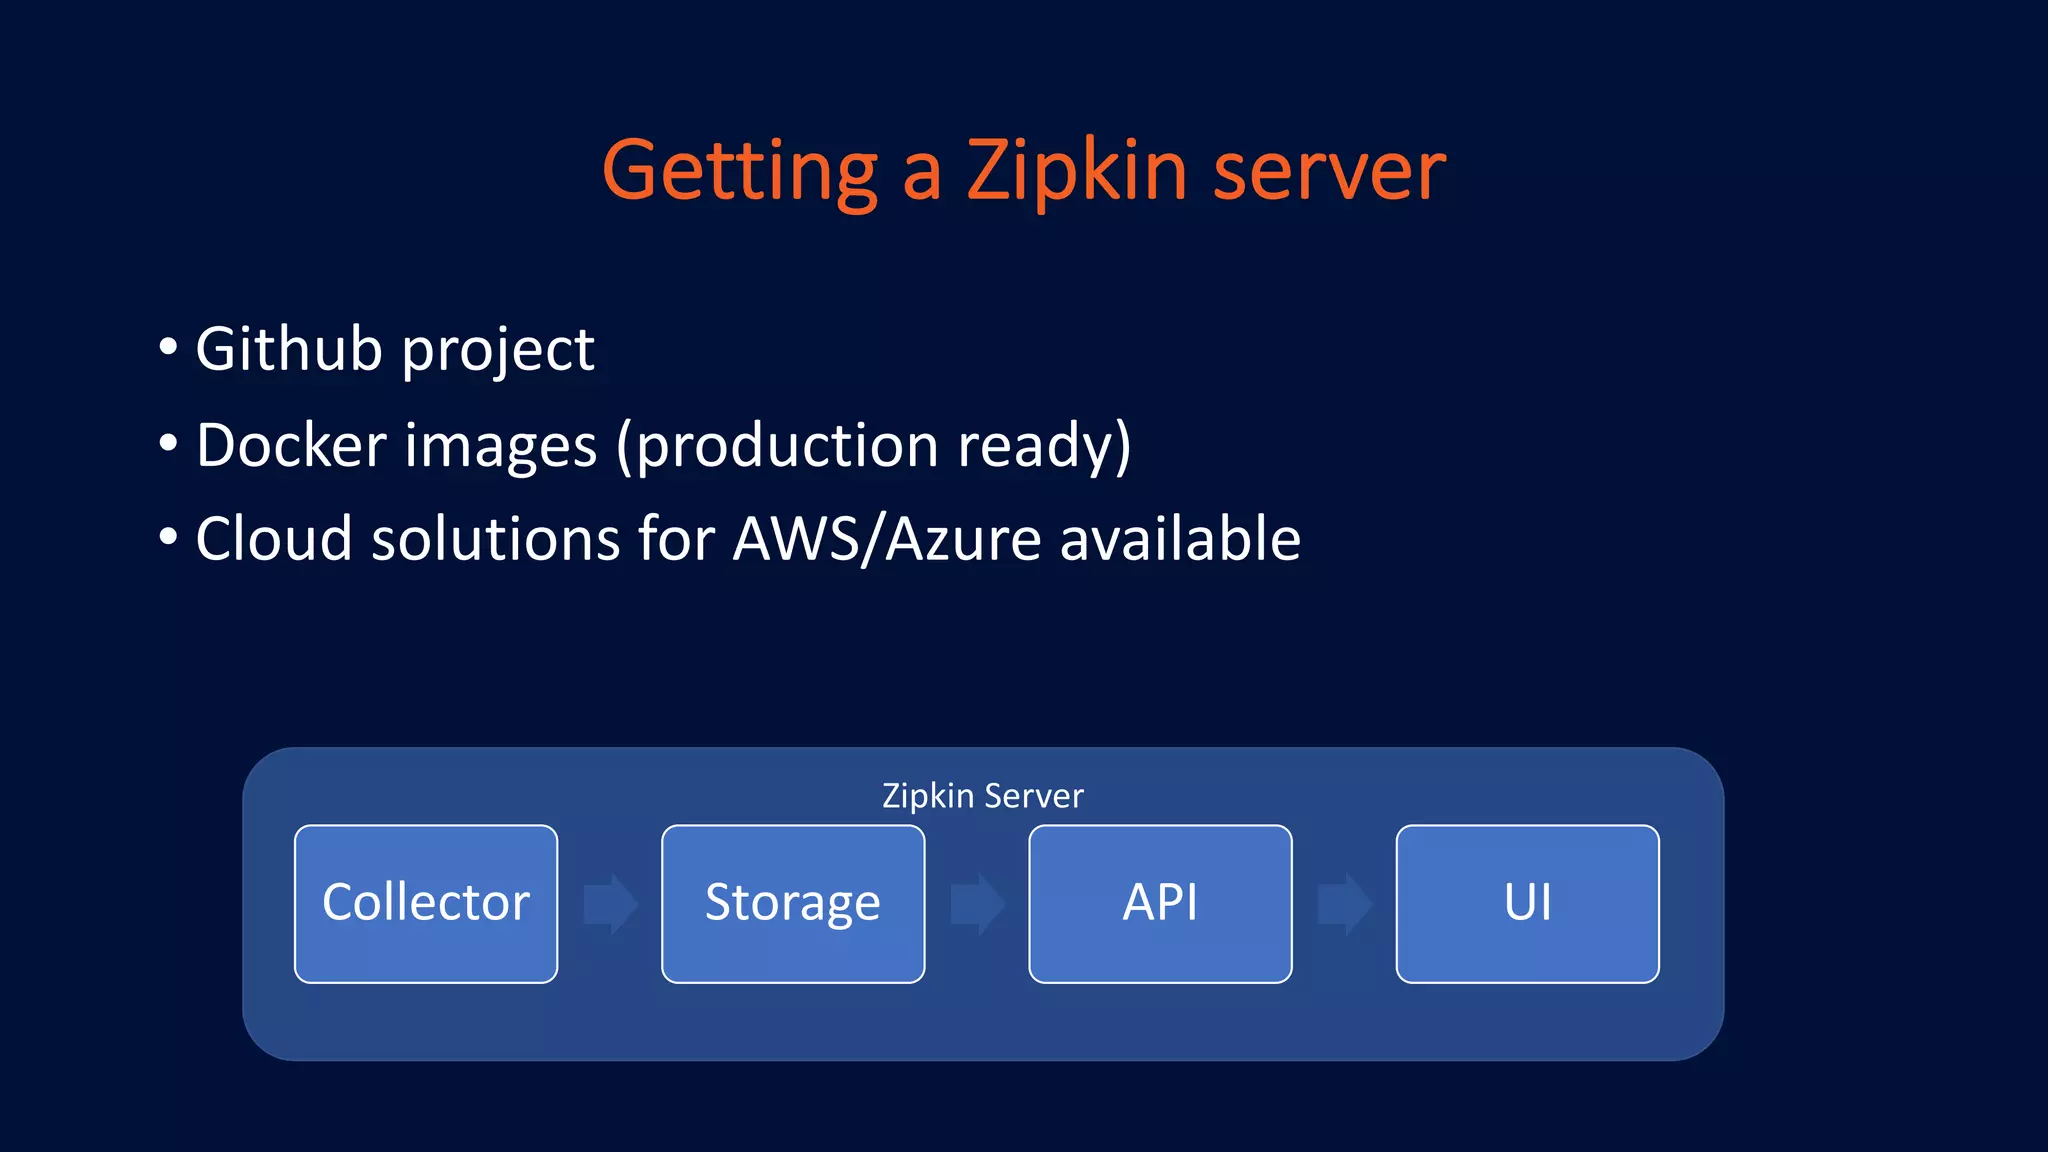
Zipkin server
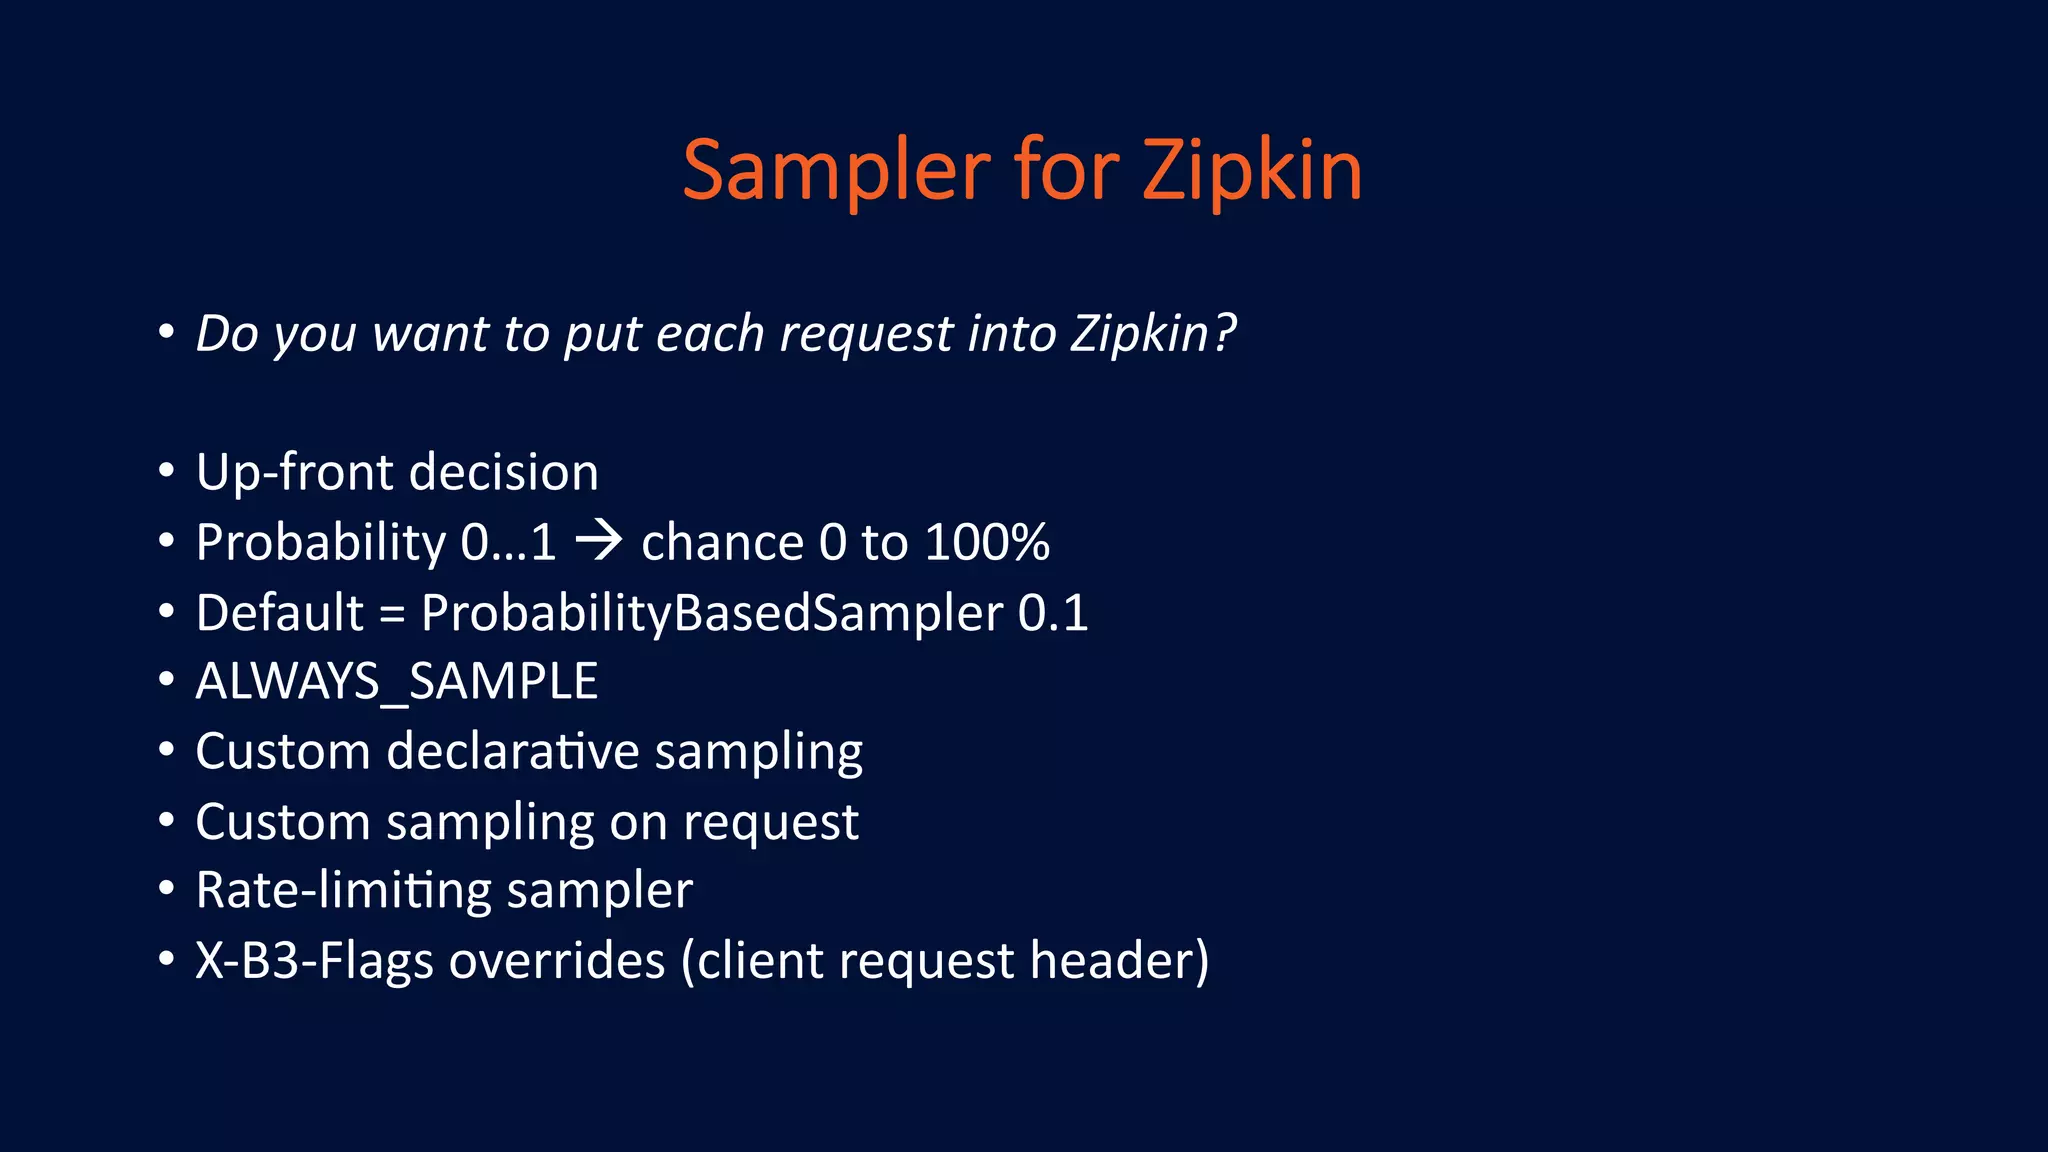
Sampler
Zipkin’s
Sender ->
[KAFKA, RABBIT, WEB]](https://image.slidesharecdn.com/sleuth-zipkin-codemotion-2019-190519110454/75/Rafaela-Breed-Tracing-performance-of-your-service-calls-Codemotion-Amsterdam-2019-24-2048.jpg)


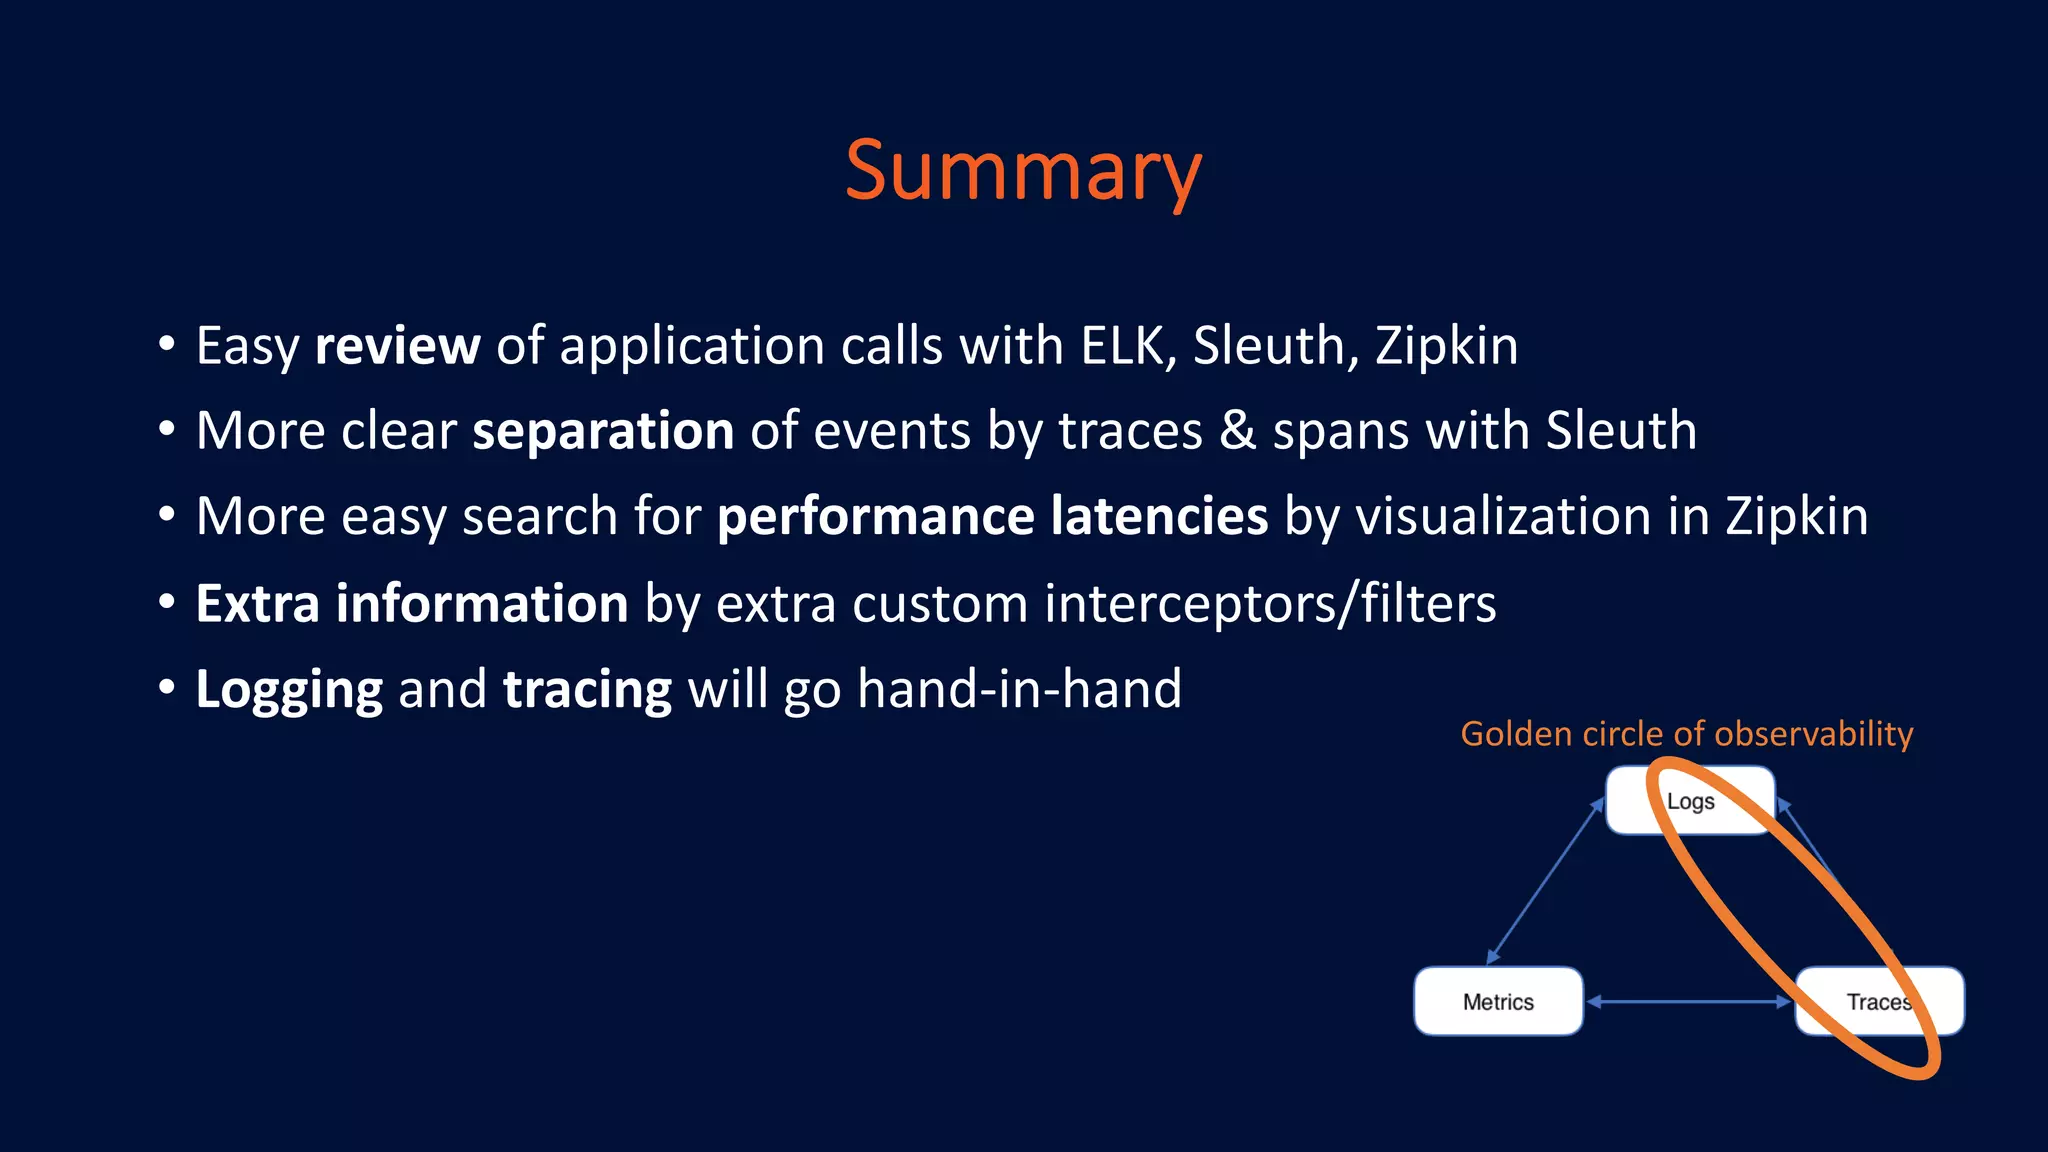

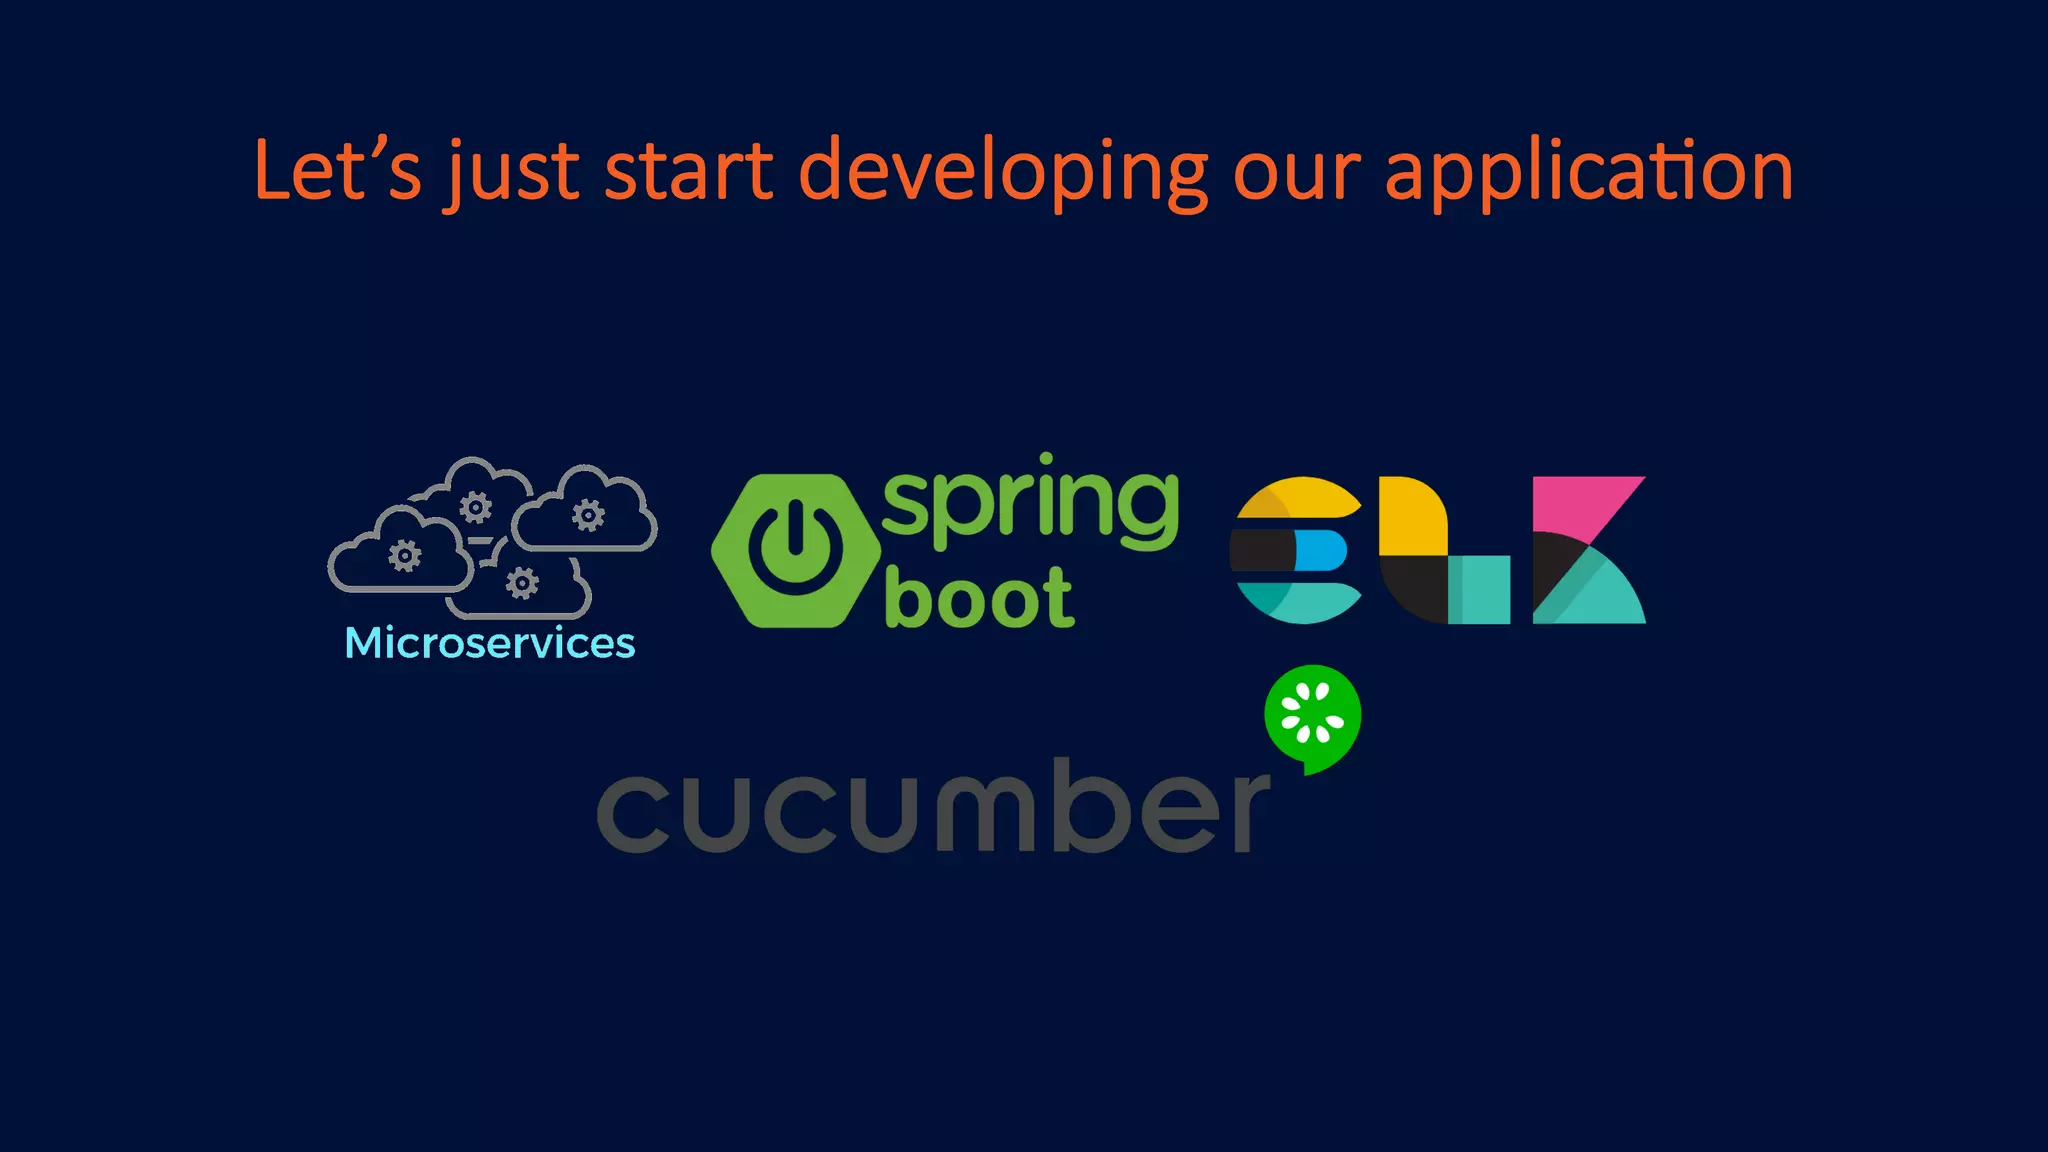
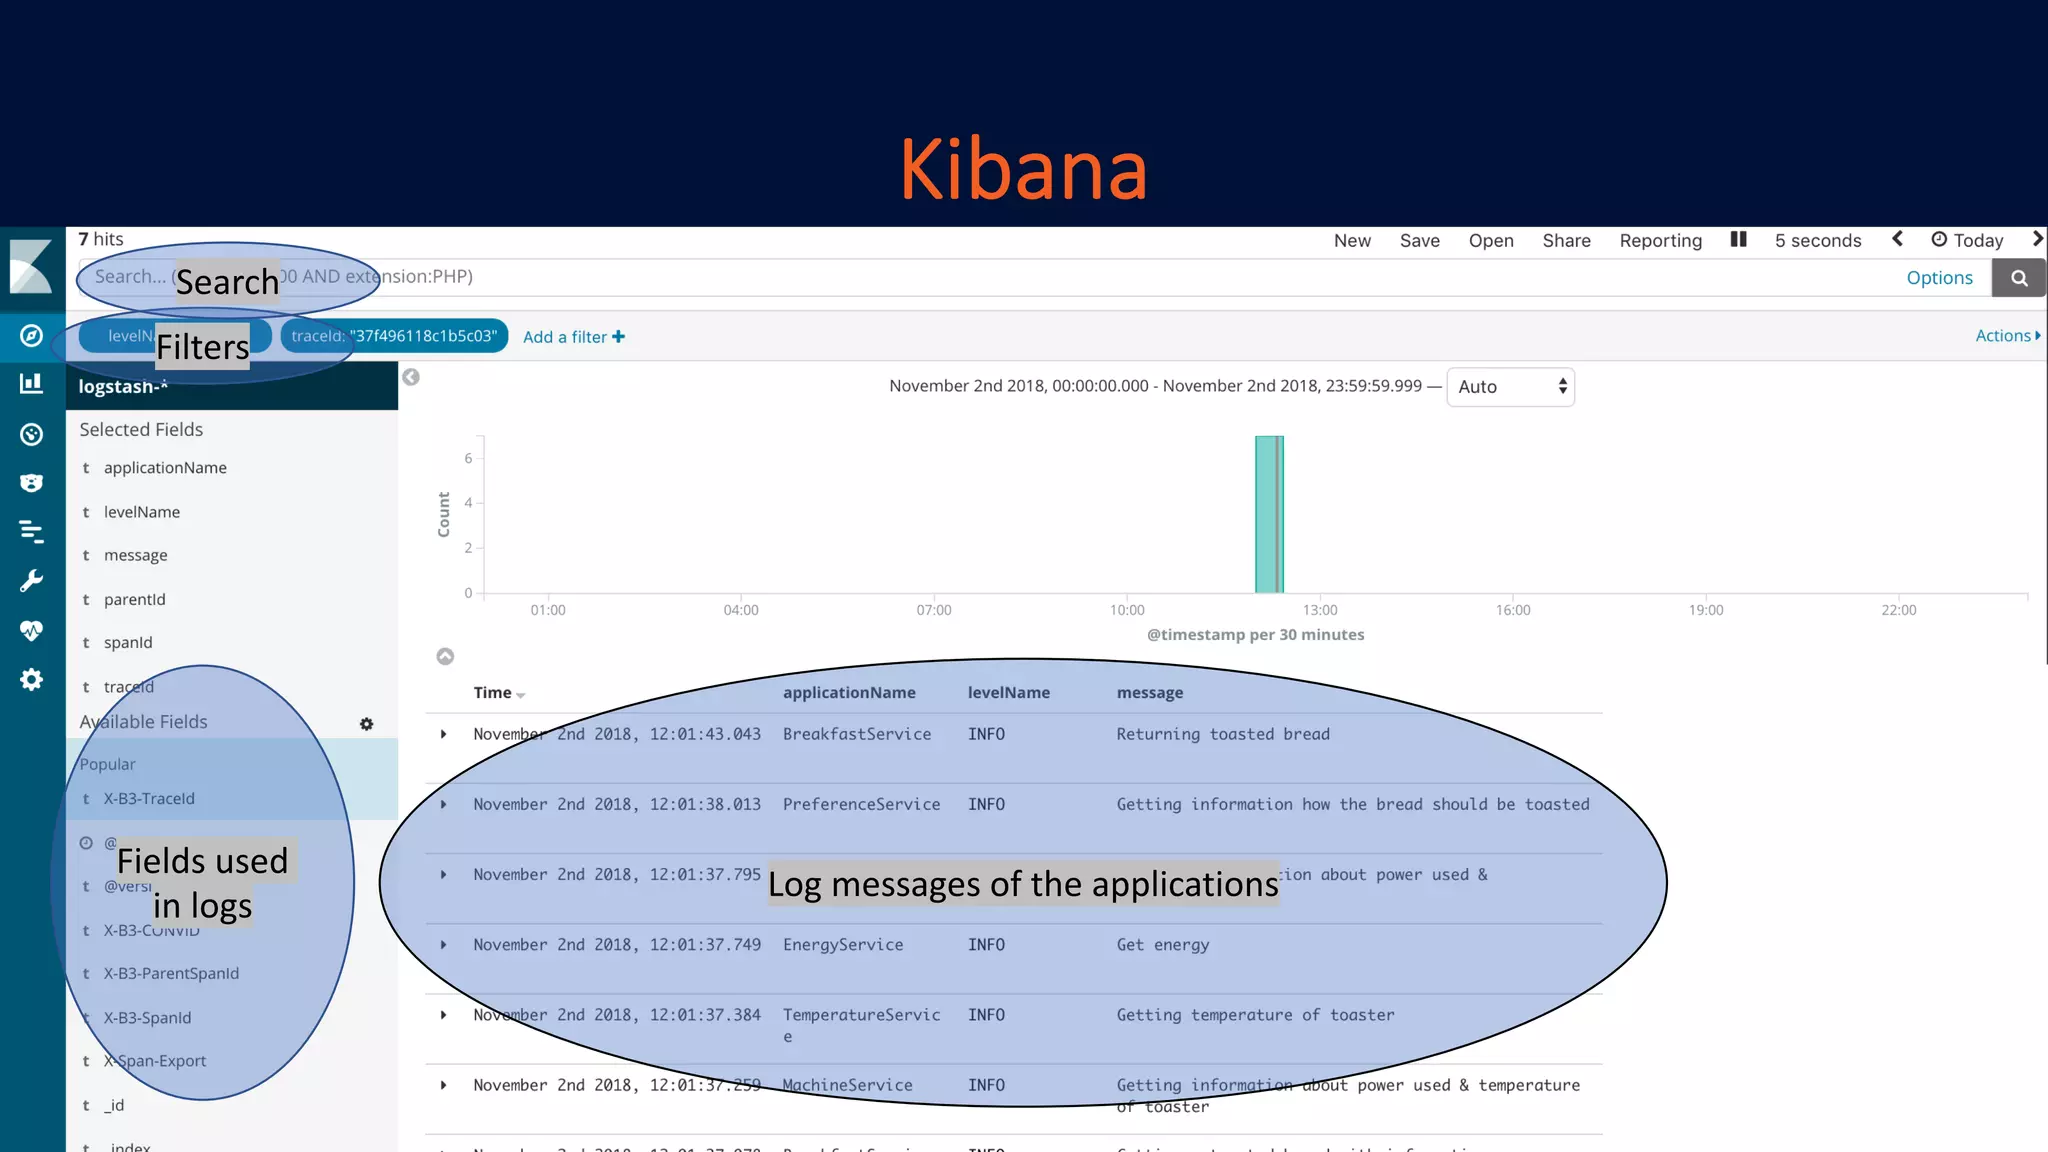
The document discusses the use of Sleuth, Zipkin, and ELK for tracing performance in microservices applications. It covers how to set up and implement these tools for tracking requests and responses, improving observability, and identifying performance bottlenecks. Additionally, it highlights the integration with Spring Boot and the use of unique identifiers to manage tracing across distributed systems.


![[네이버오픈소스세미나] What’s new in Zipkin - Adrian Cole](https://cdn.slidesharecdn.com/ss_thumbnails/3adrianwhatsnewinzipkin-190716062901-thumbnail.jpg?width=640&height=640&fit=bounds)


![Vibe Coding vs. Spec-Driven Development [Free Meetup]](https://cdn.slidesharecdn.com/ss_thumbnails/vibecodingvsspecdrivendevelopment-251209105622-43f455e7-thumbnail.jpg?width=640&height=640&fit=bounds)


