Downloaded 26 times


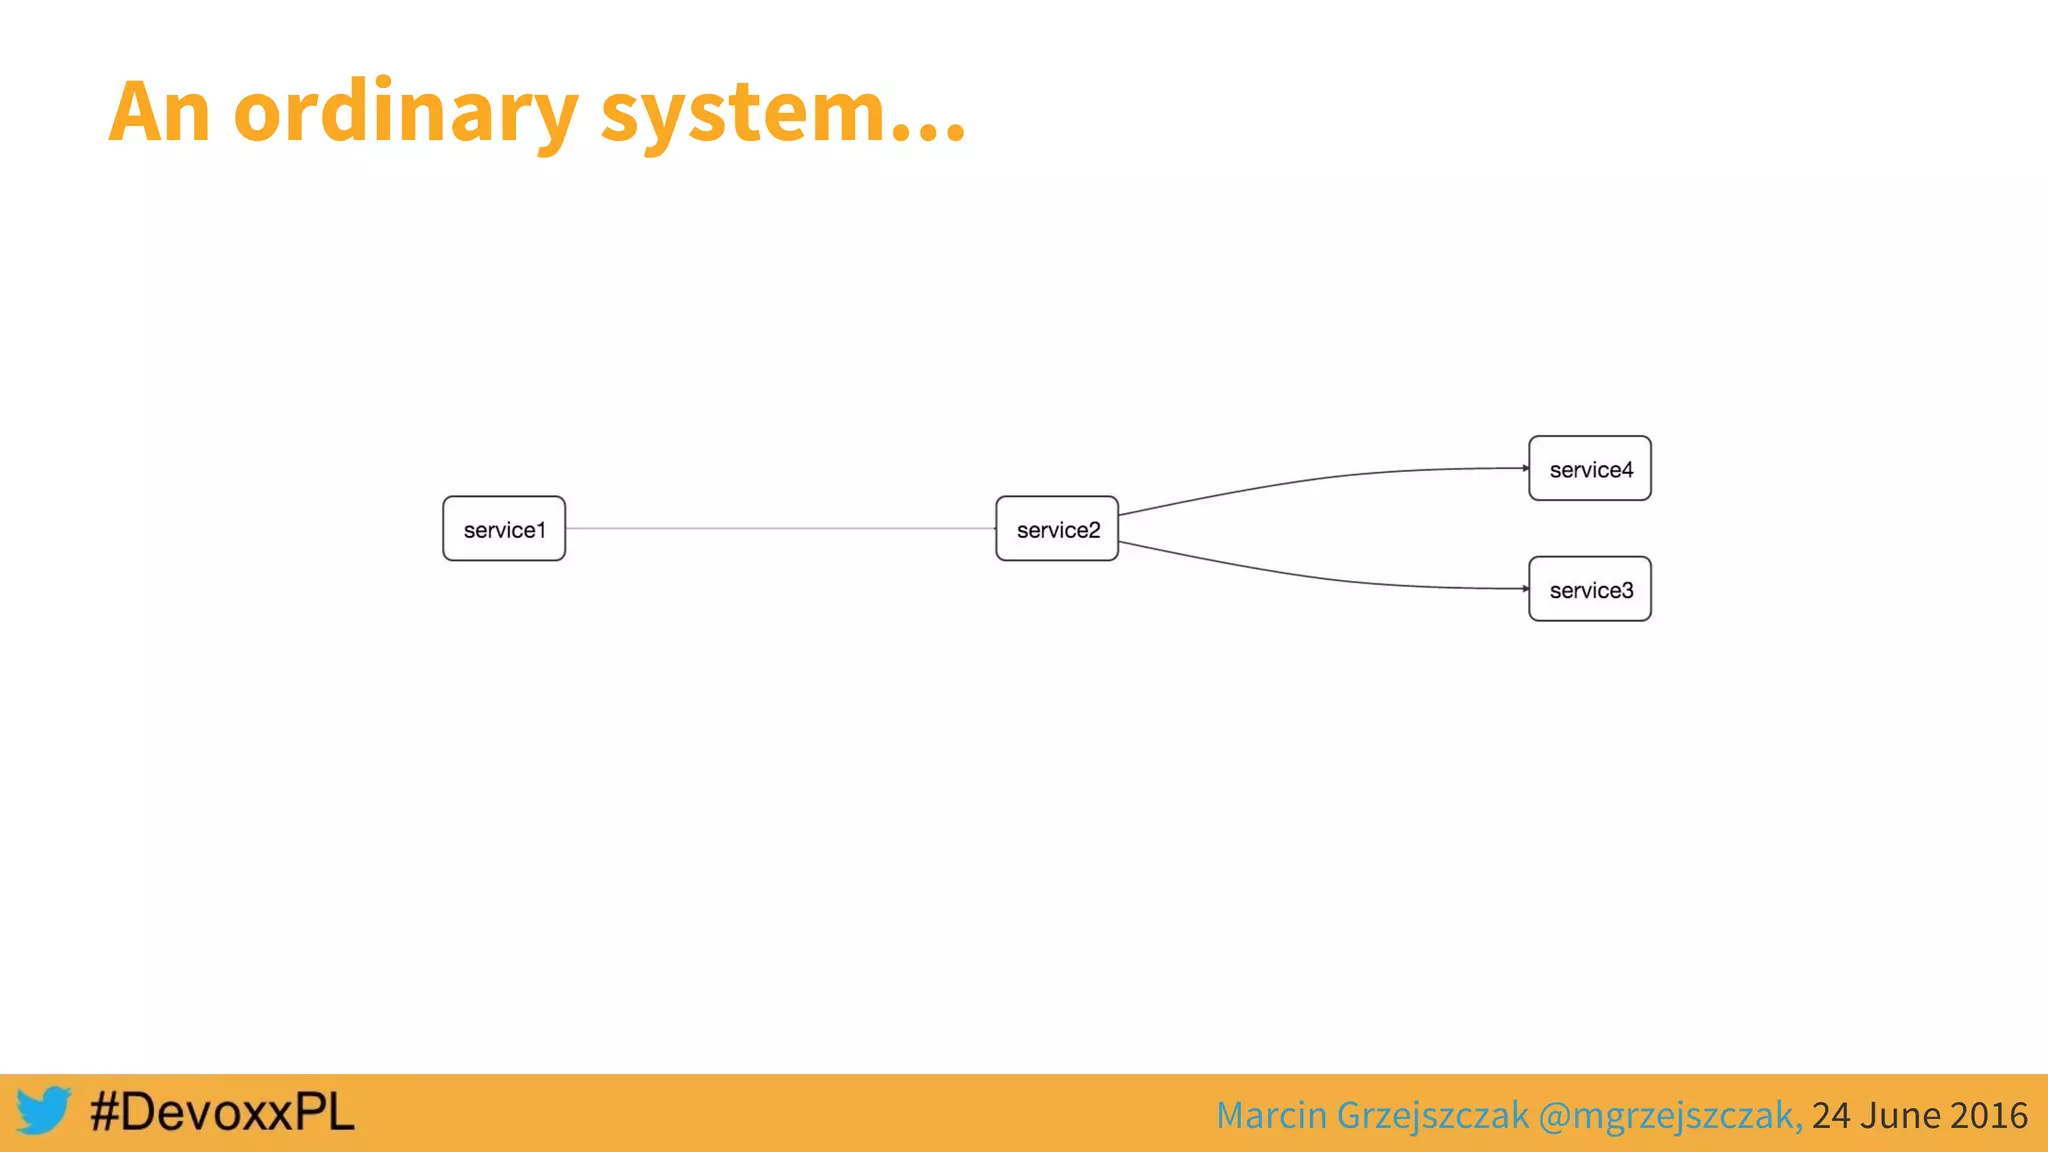


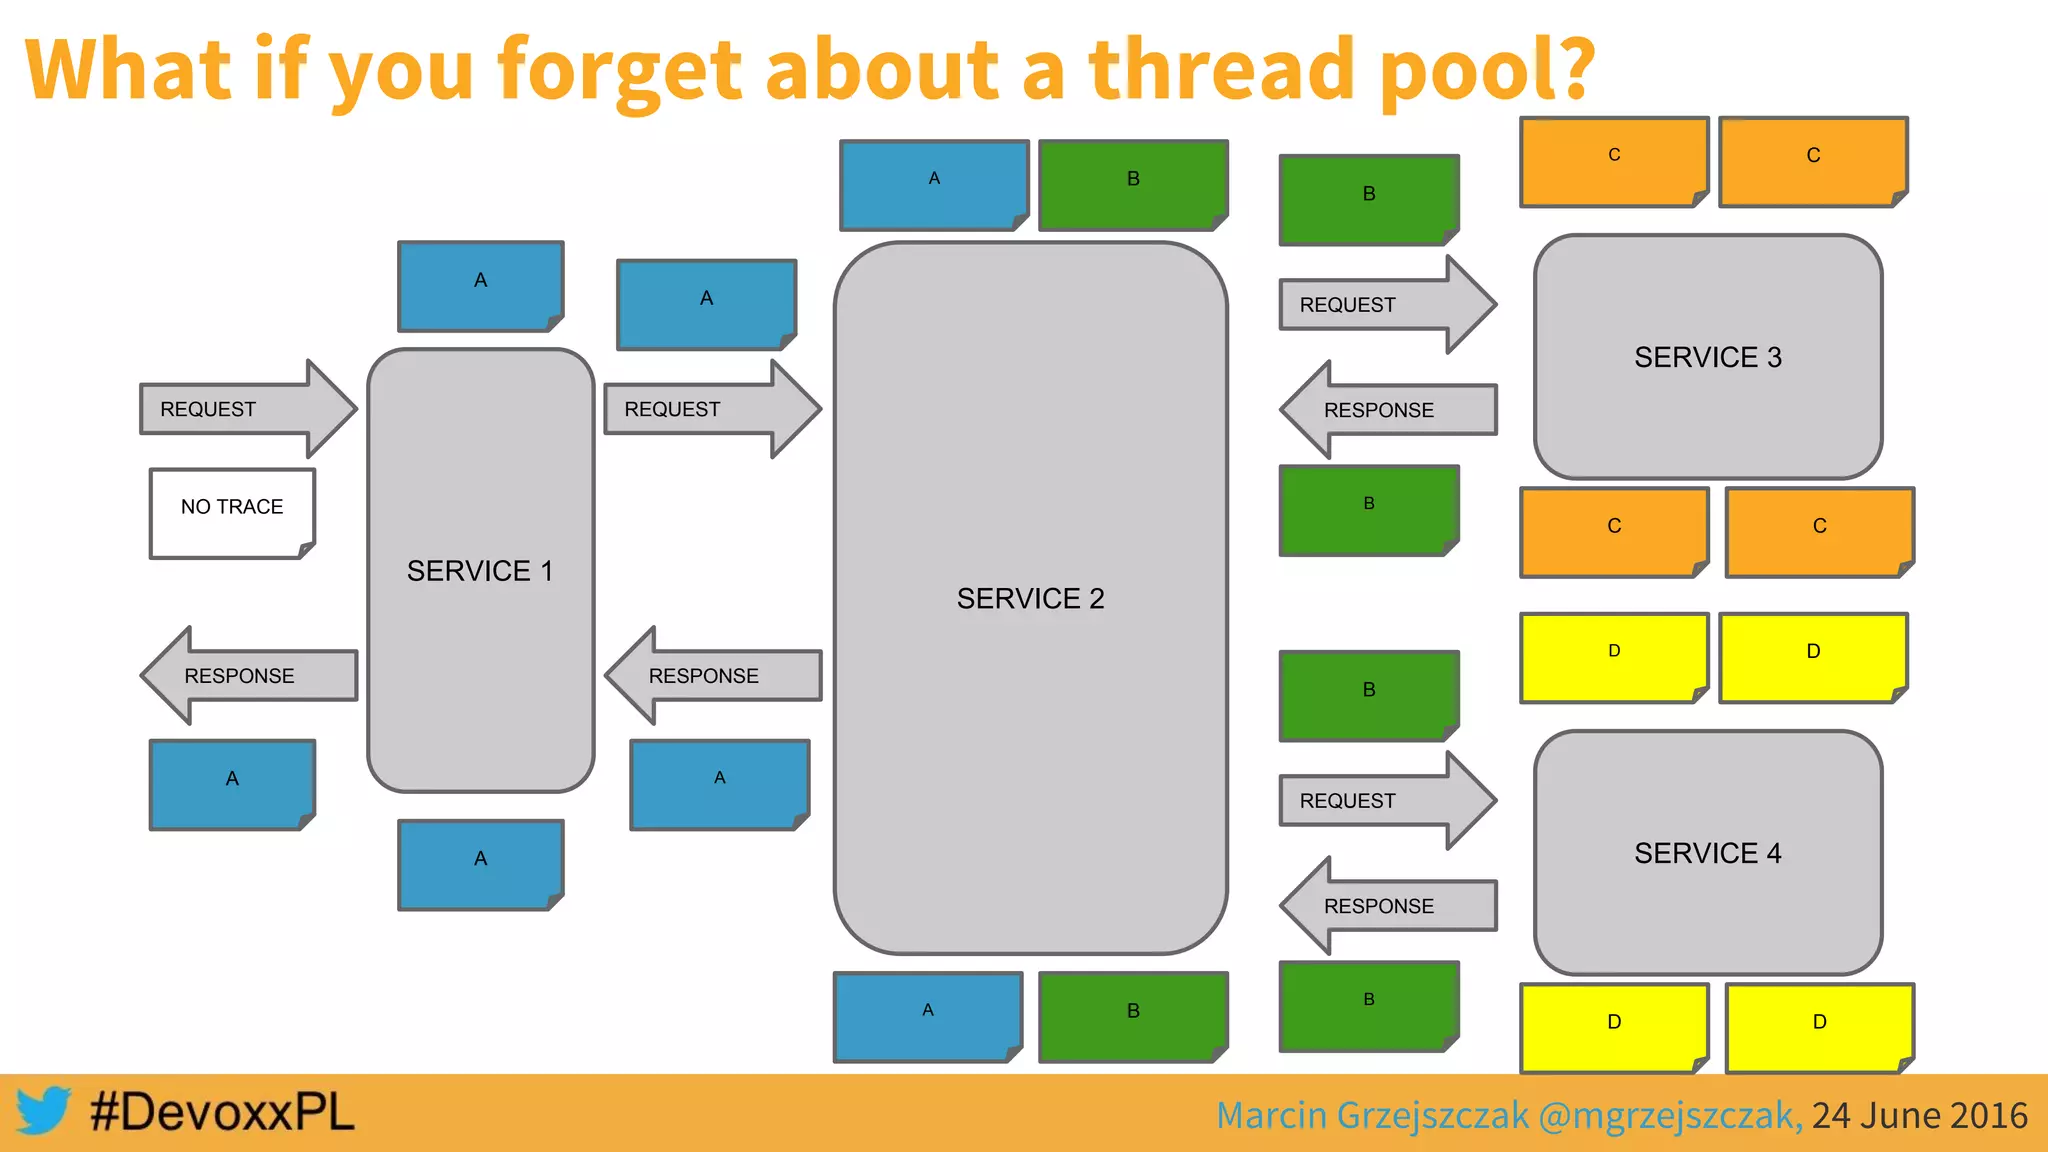

![SERVICE 1
/start
REQUEST
RESPONSE
SERVICE 2
SERVICE 3
REQUEST
RESPONSE
REQUEST
RESPONSE
SERVICE 4
REQUEST
RESPONSE
“Hello from service3”
“Hello from service4”
“Hello from service2, response from
service3 [Hello from service3] and from
service4 [Hello from service4]”](https://image.slidesharecdn.com/microservicestracingwithspringcloudandzipkindevoxx-160624222537/75/Microservices-Tracing-with-Spring-Cloud-and-Zipkin-devoxx-28-2048.jpg)

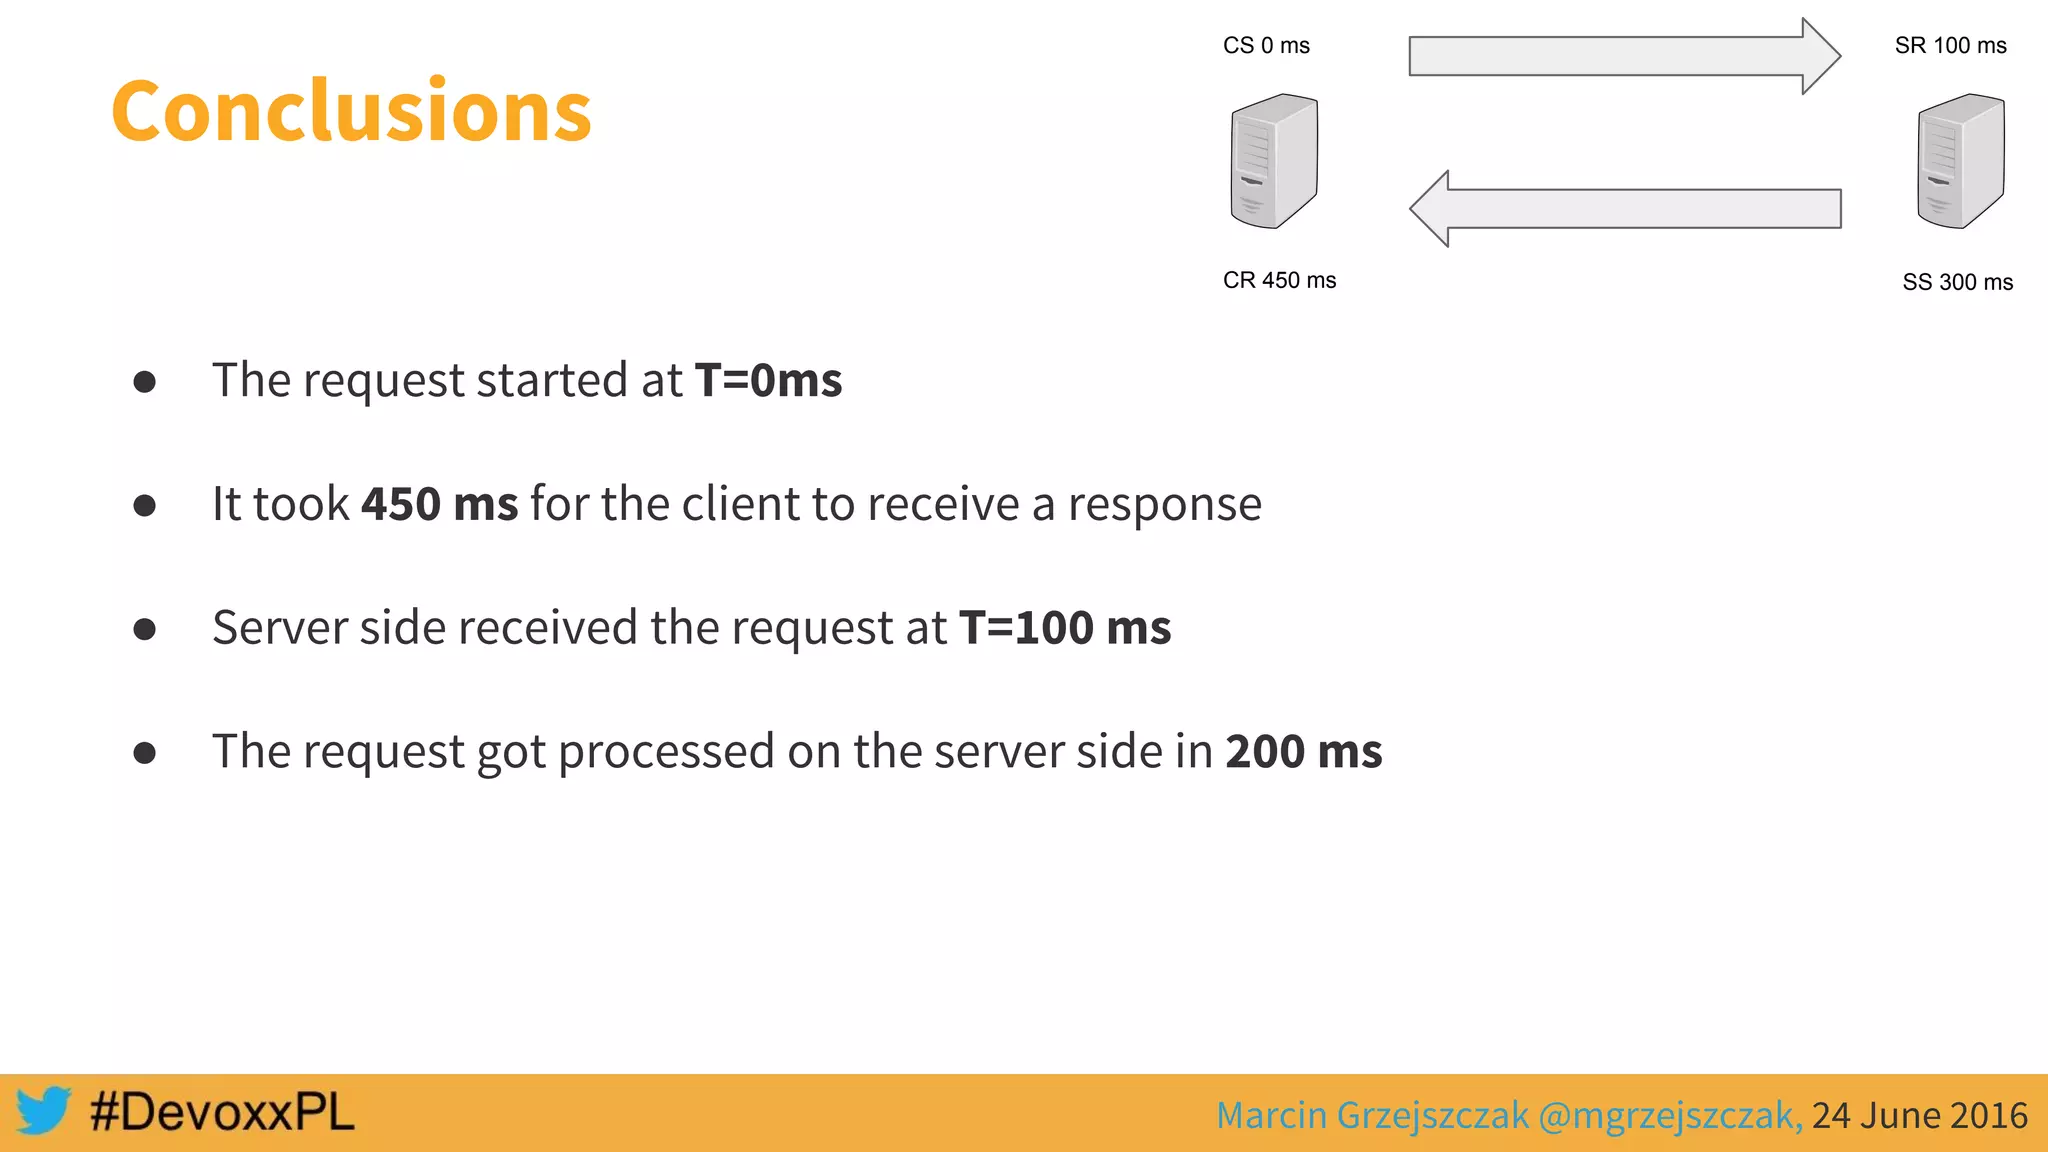

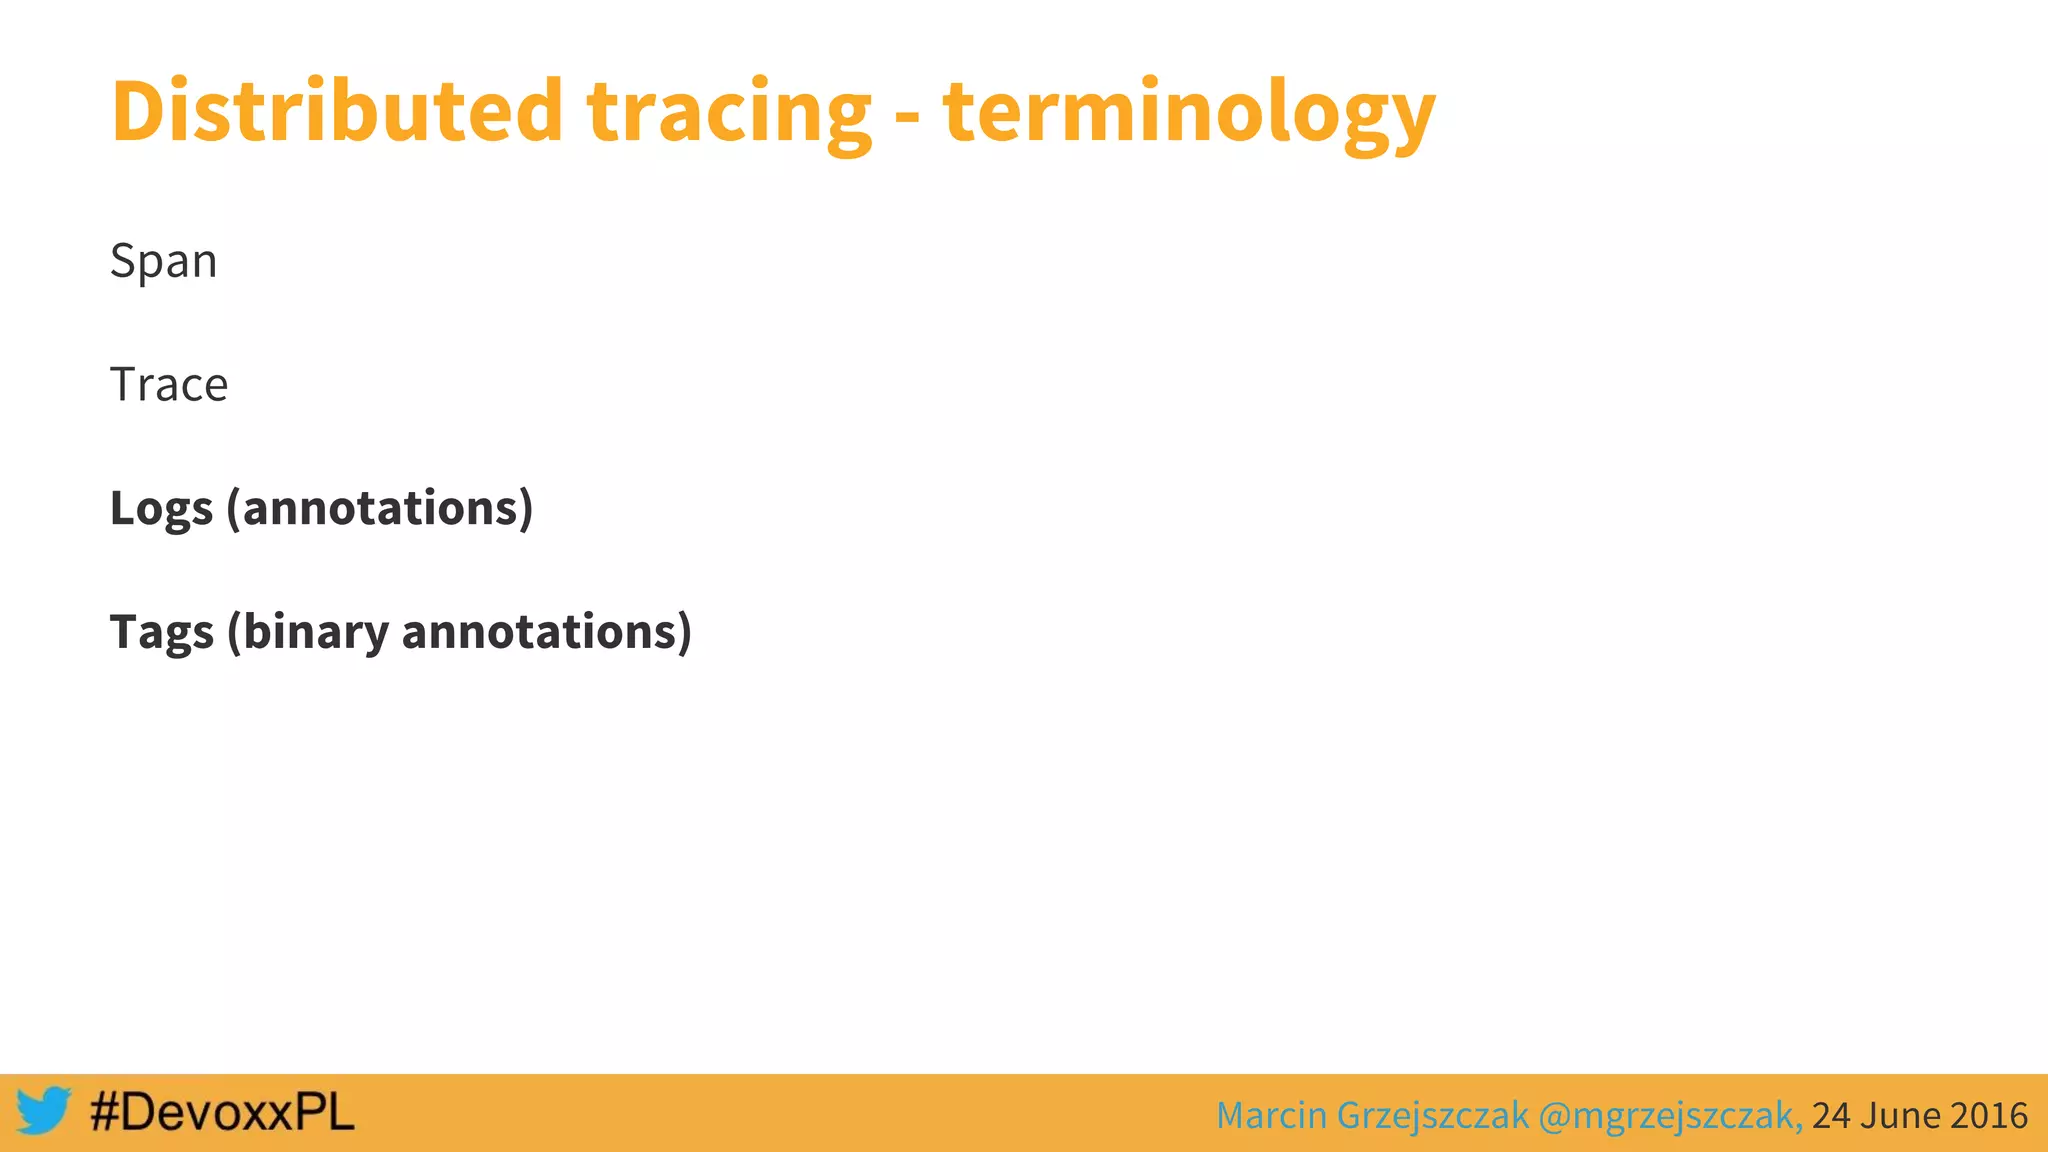
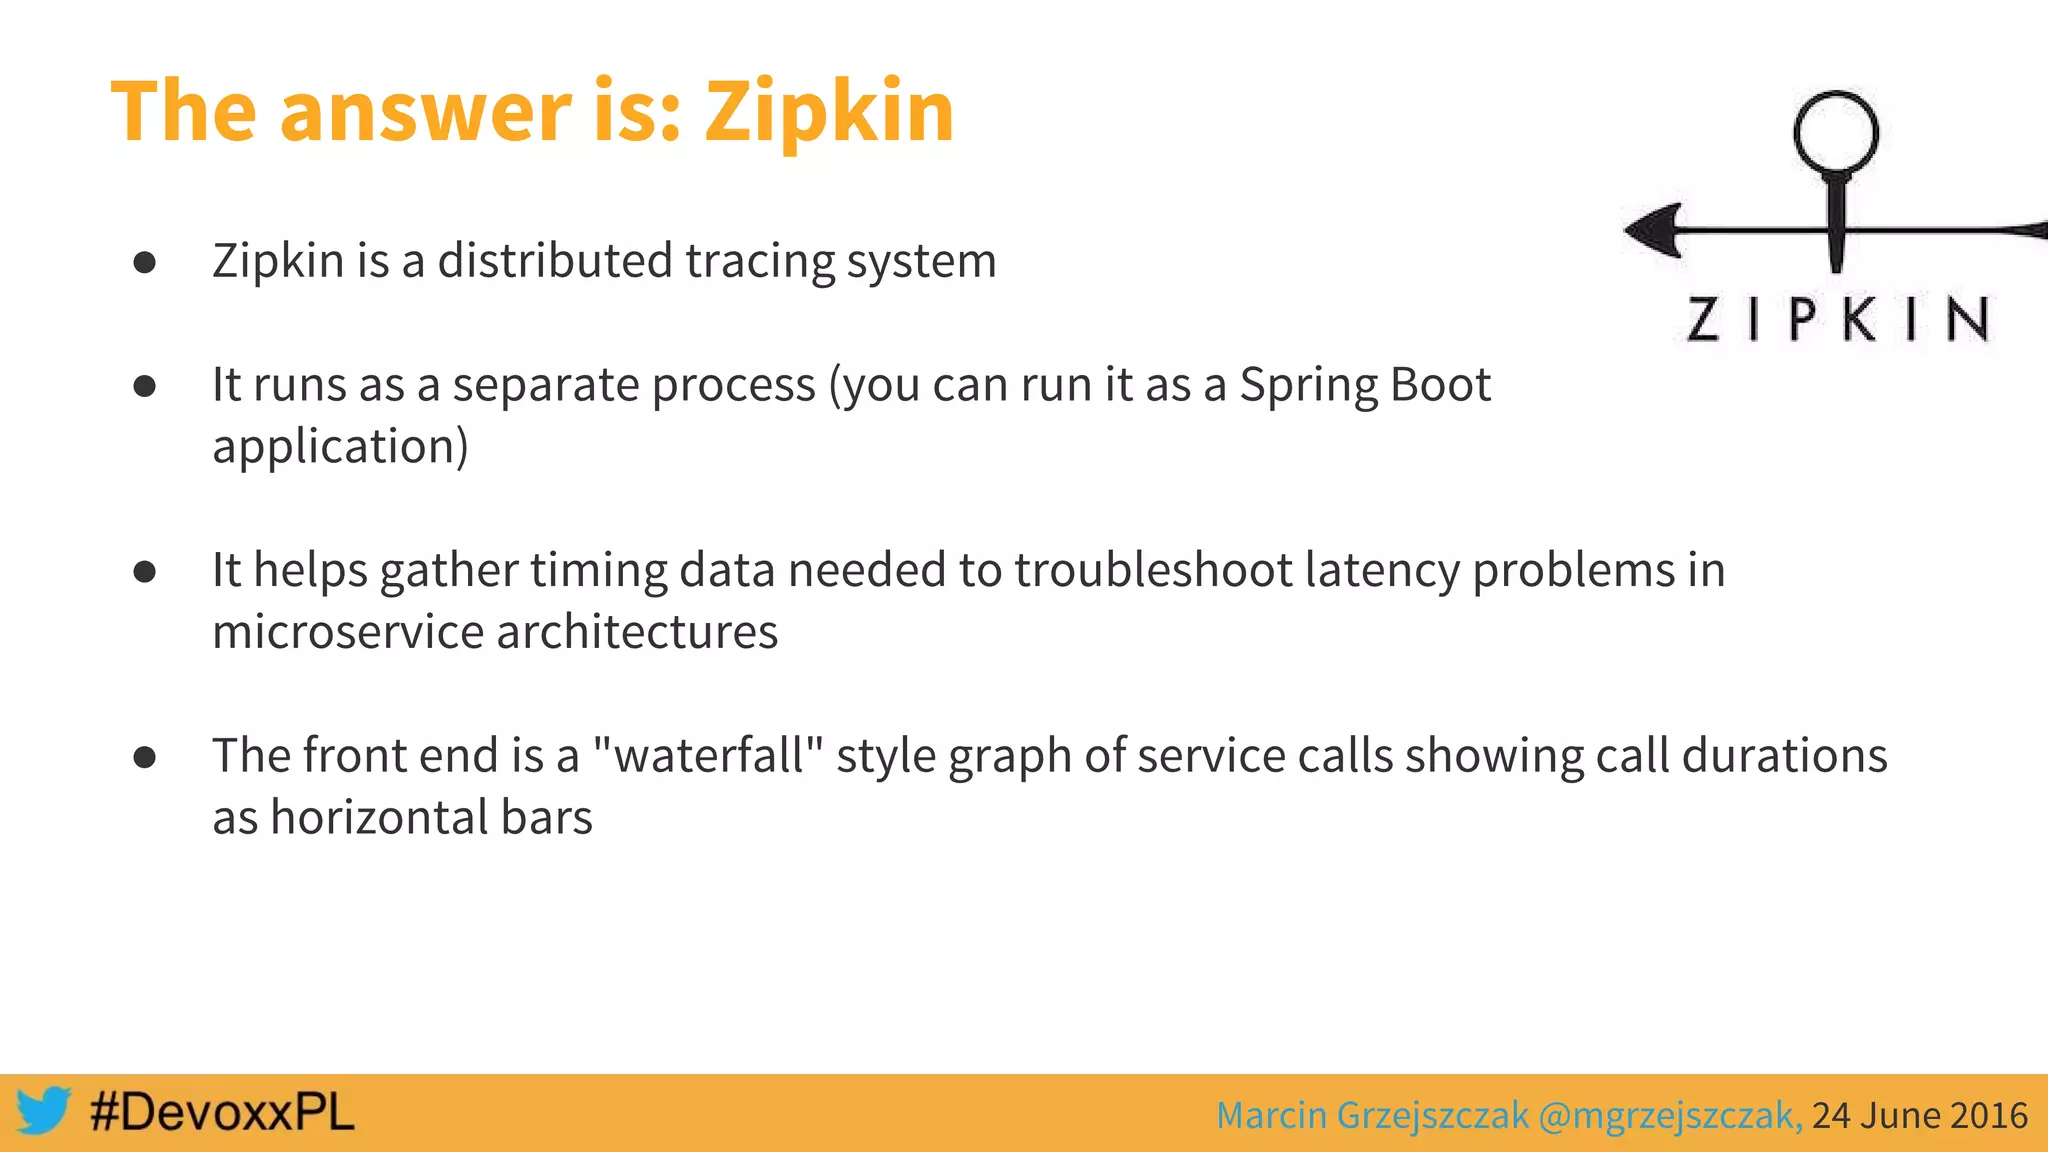

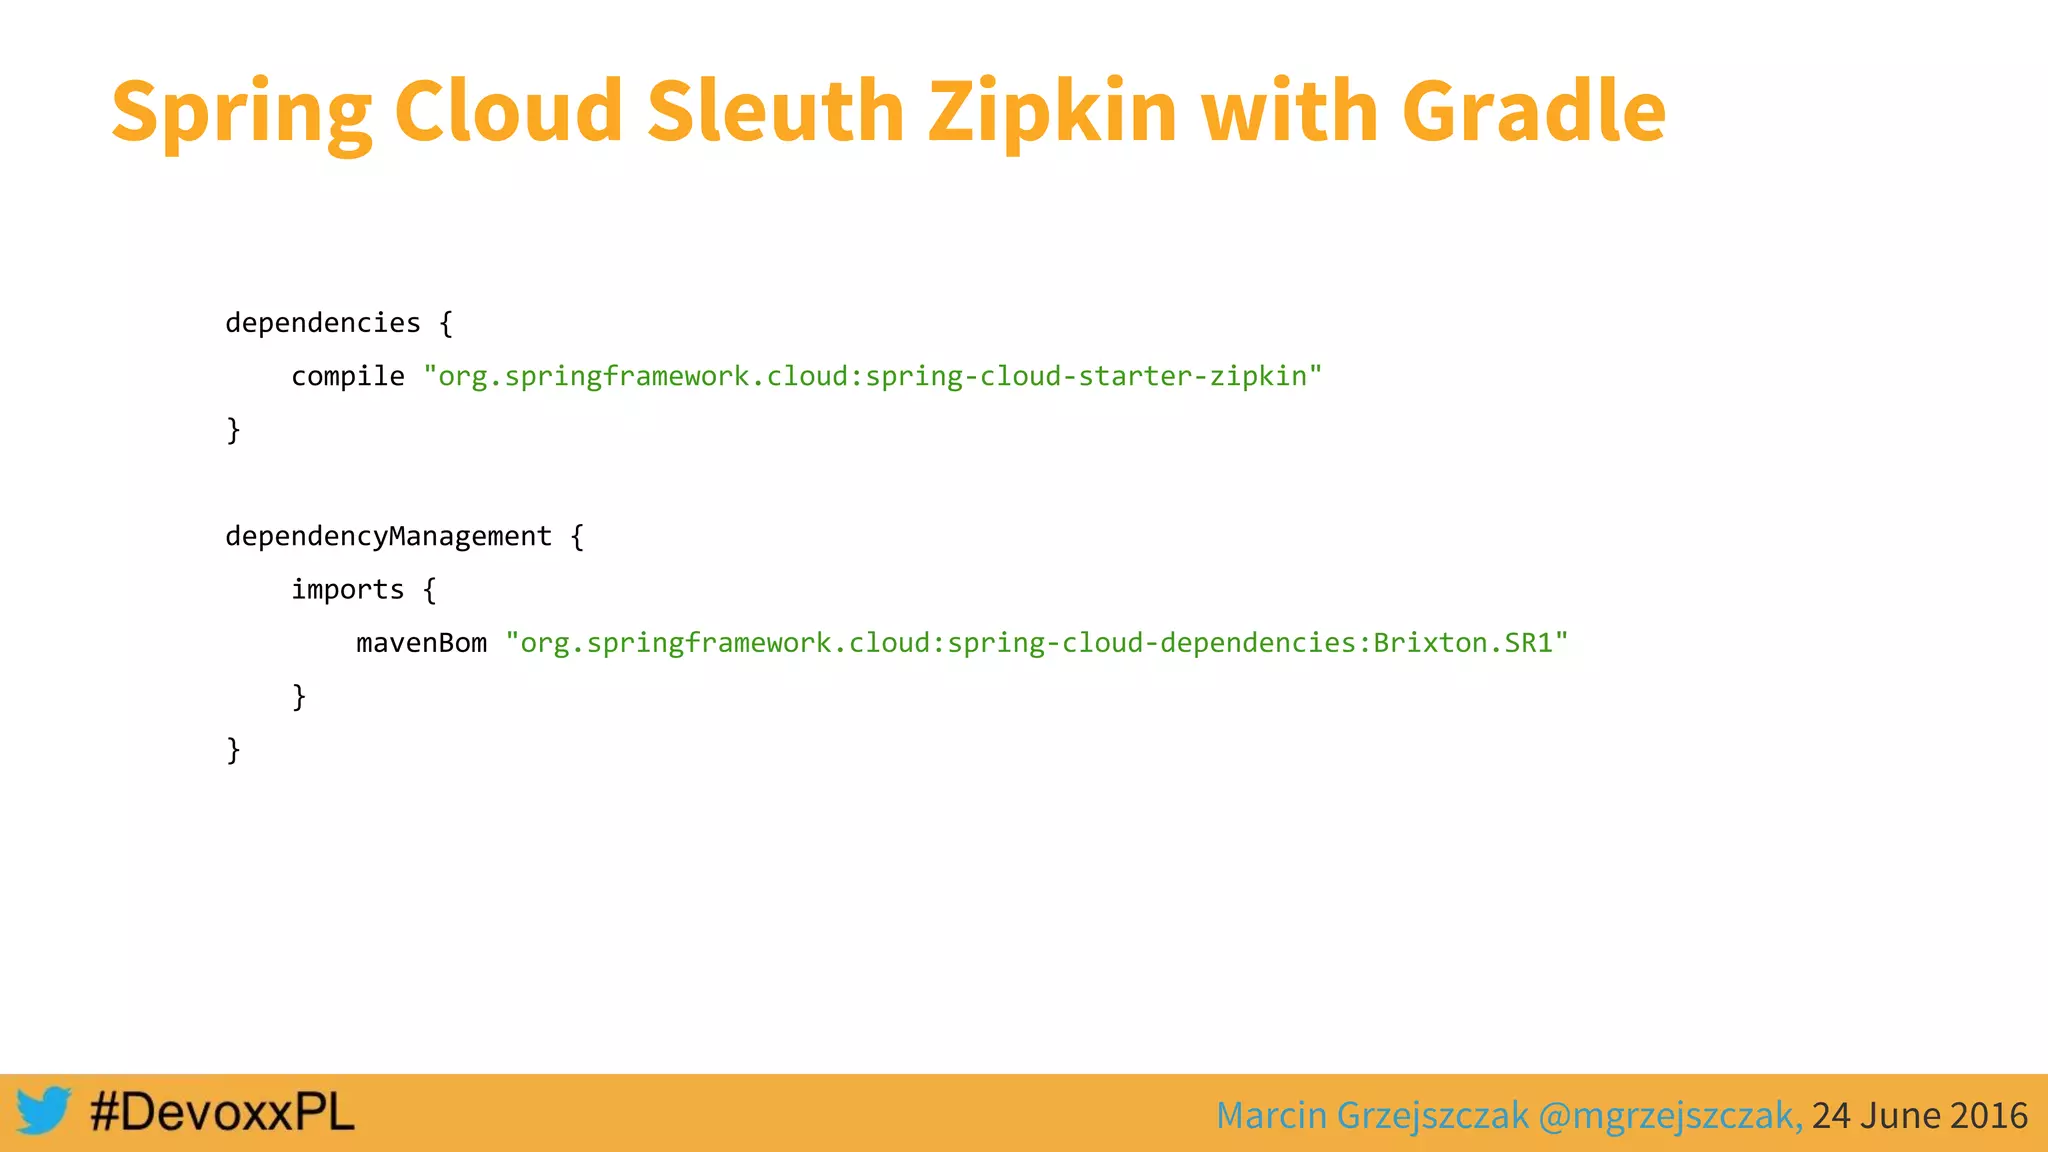
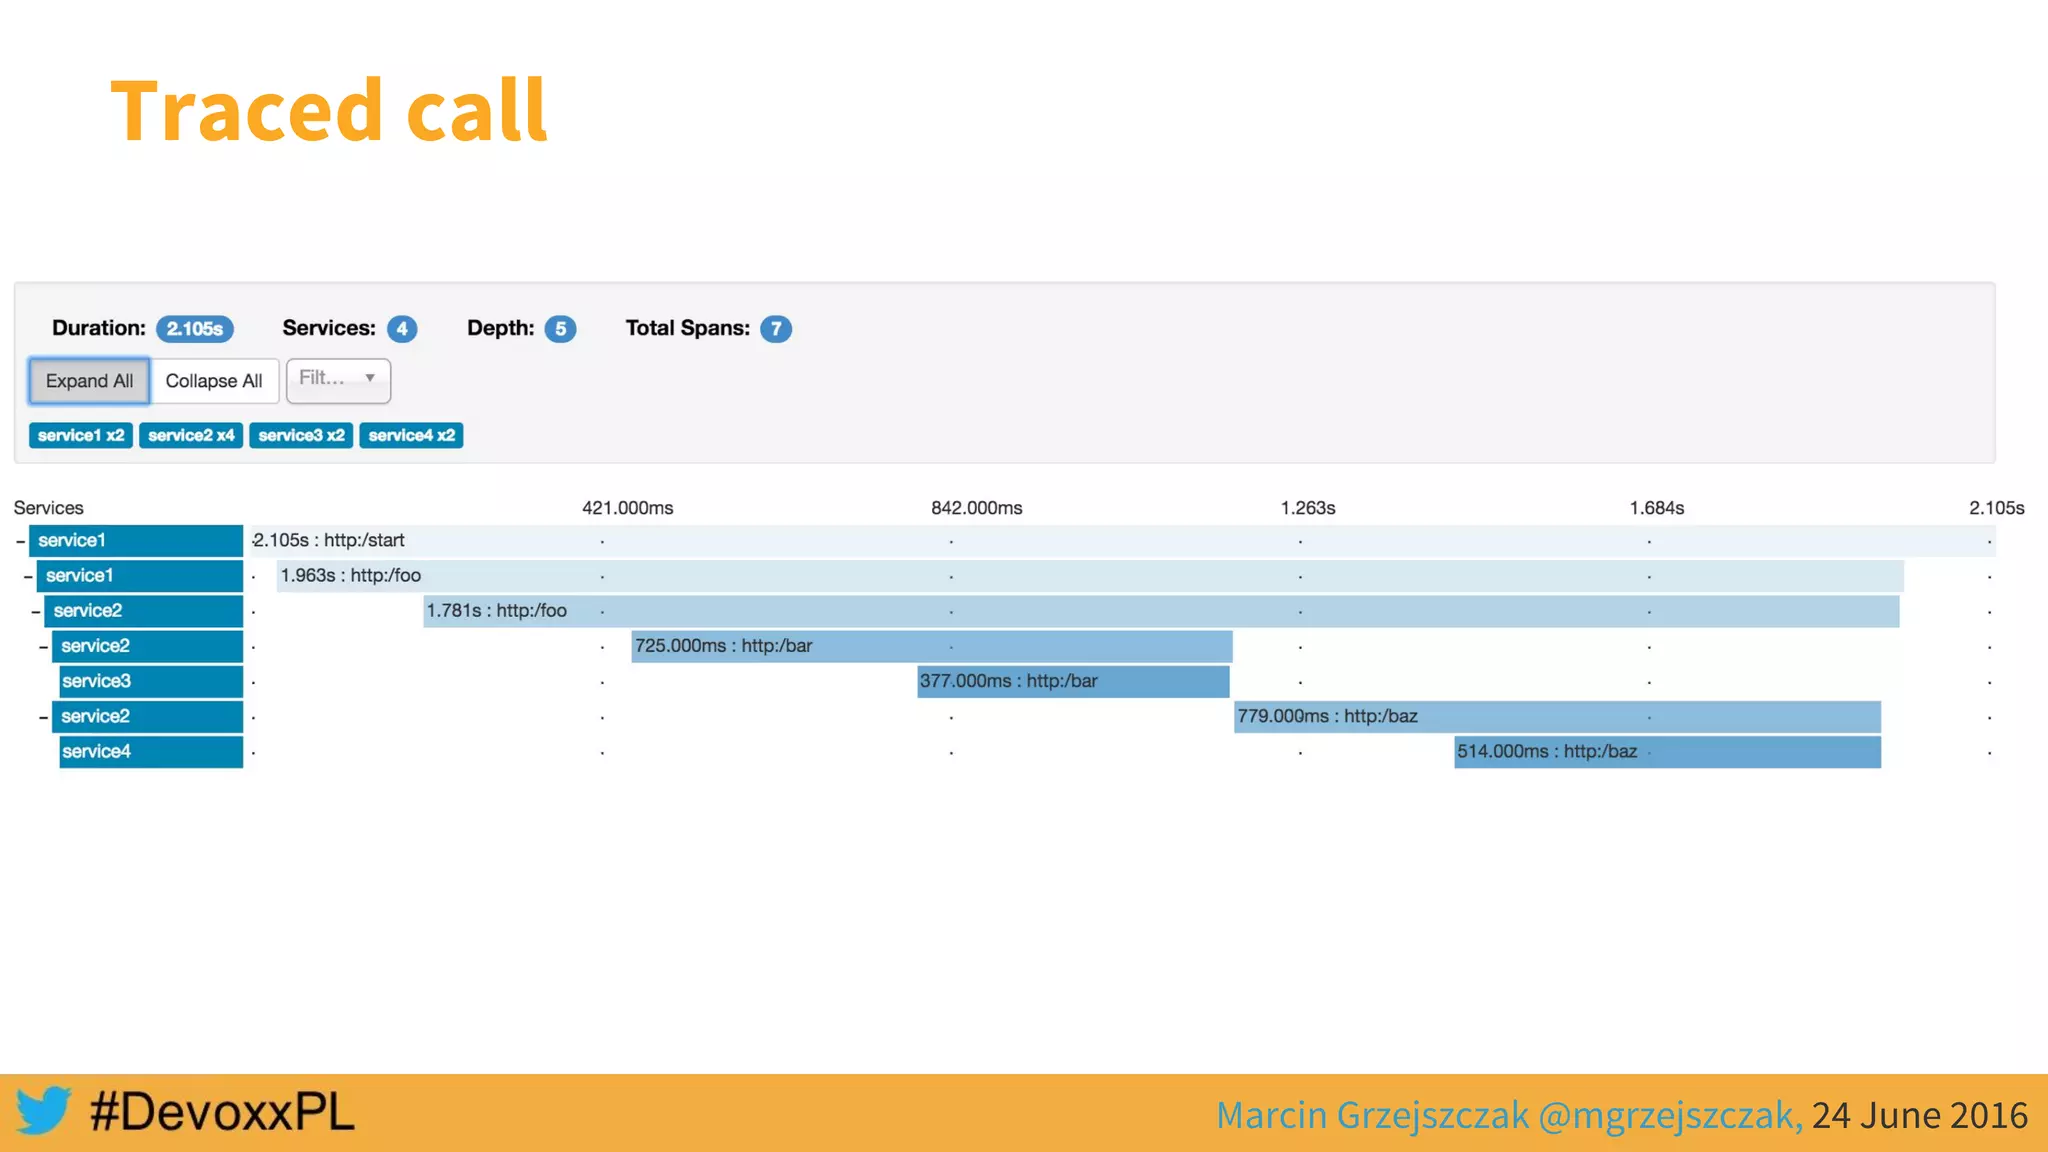
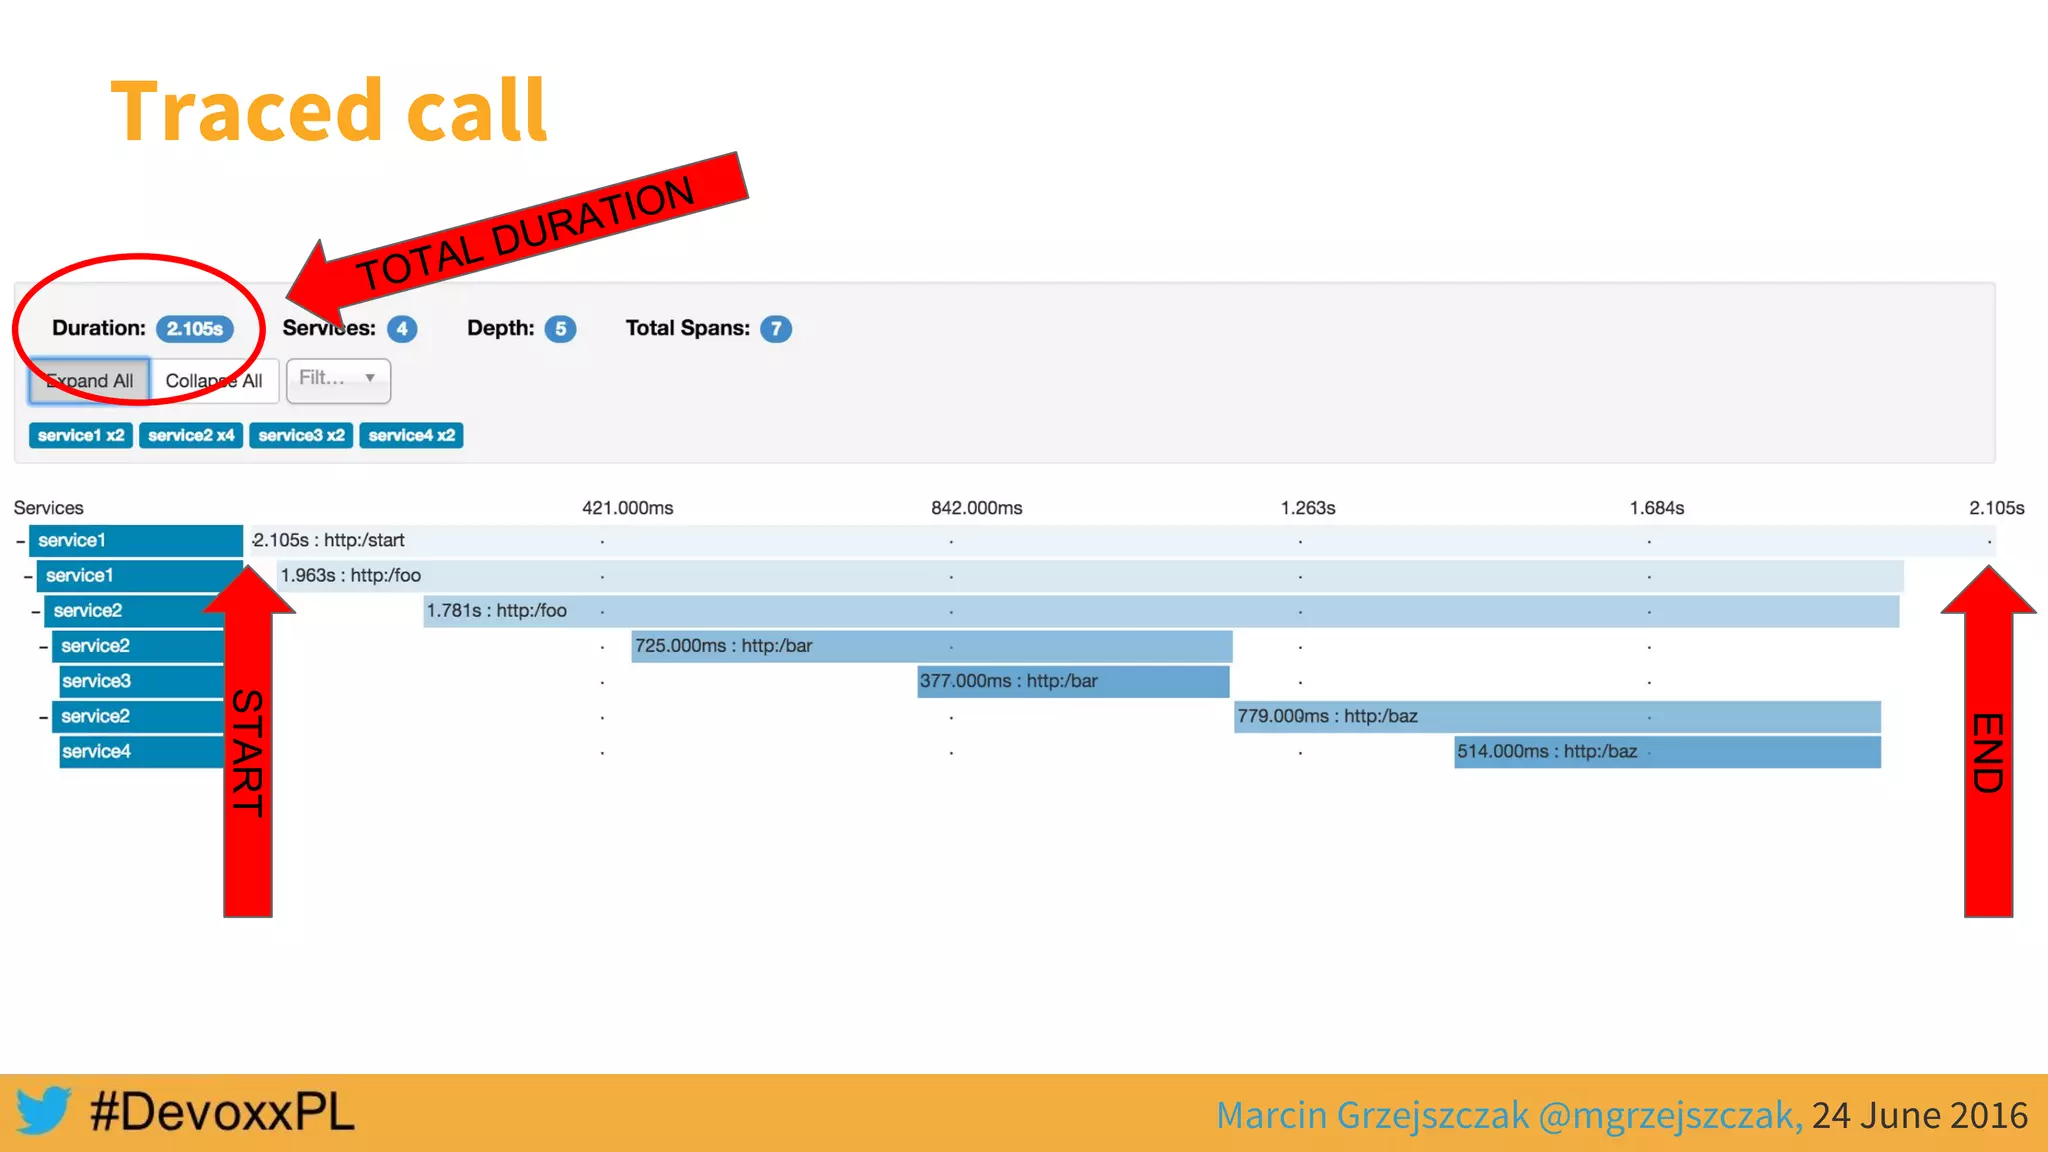
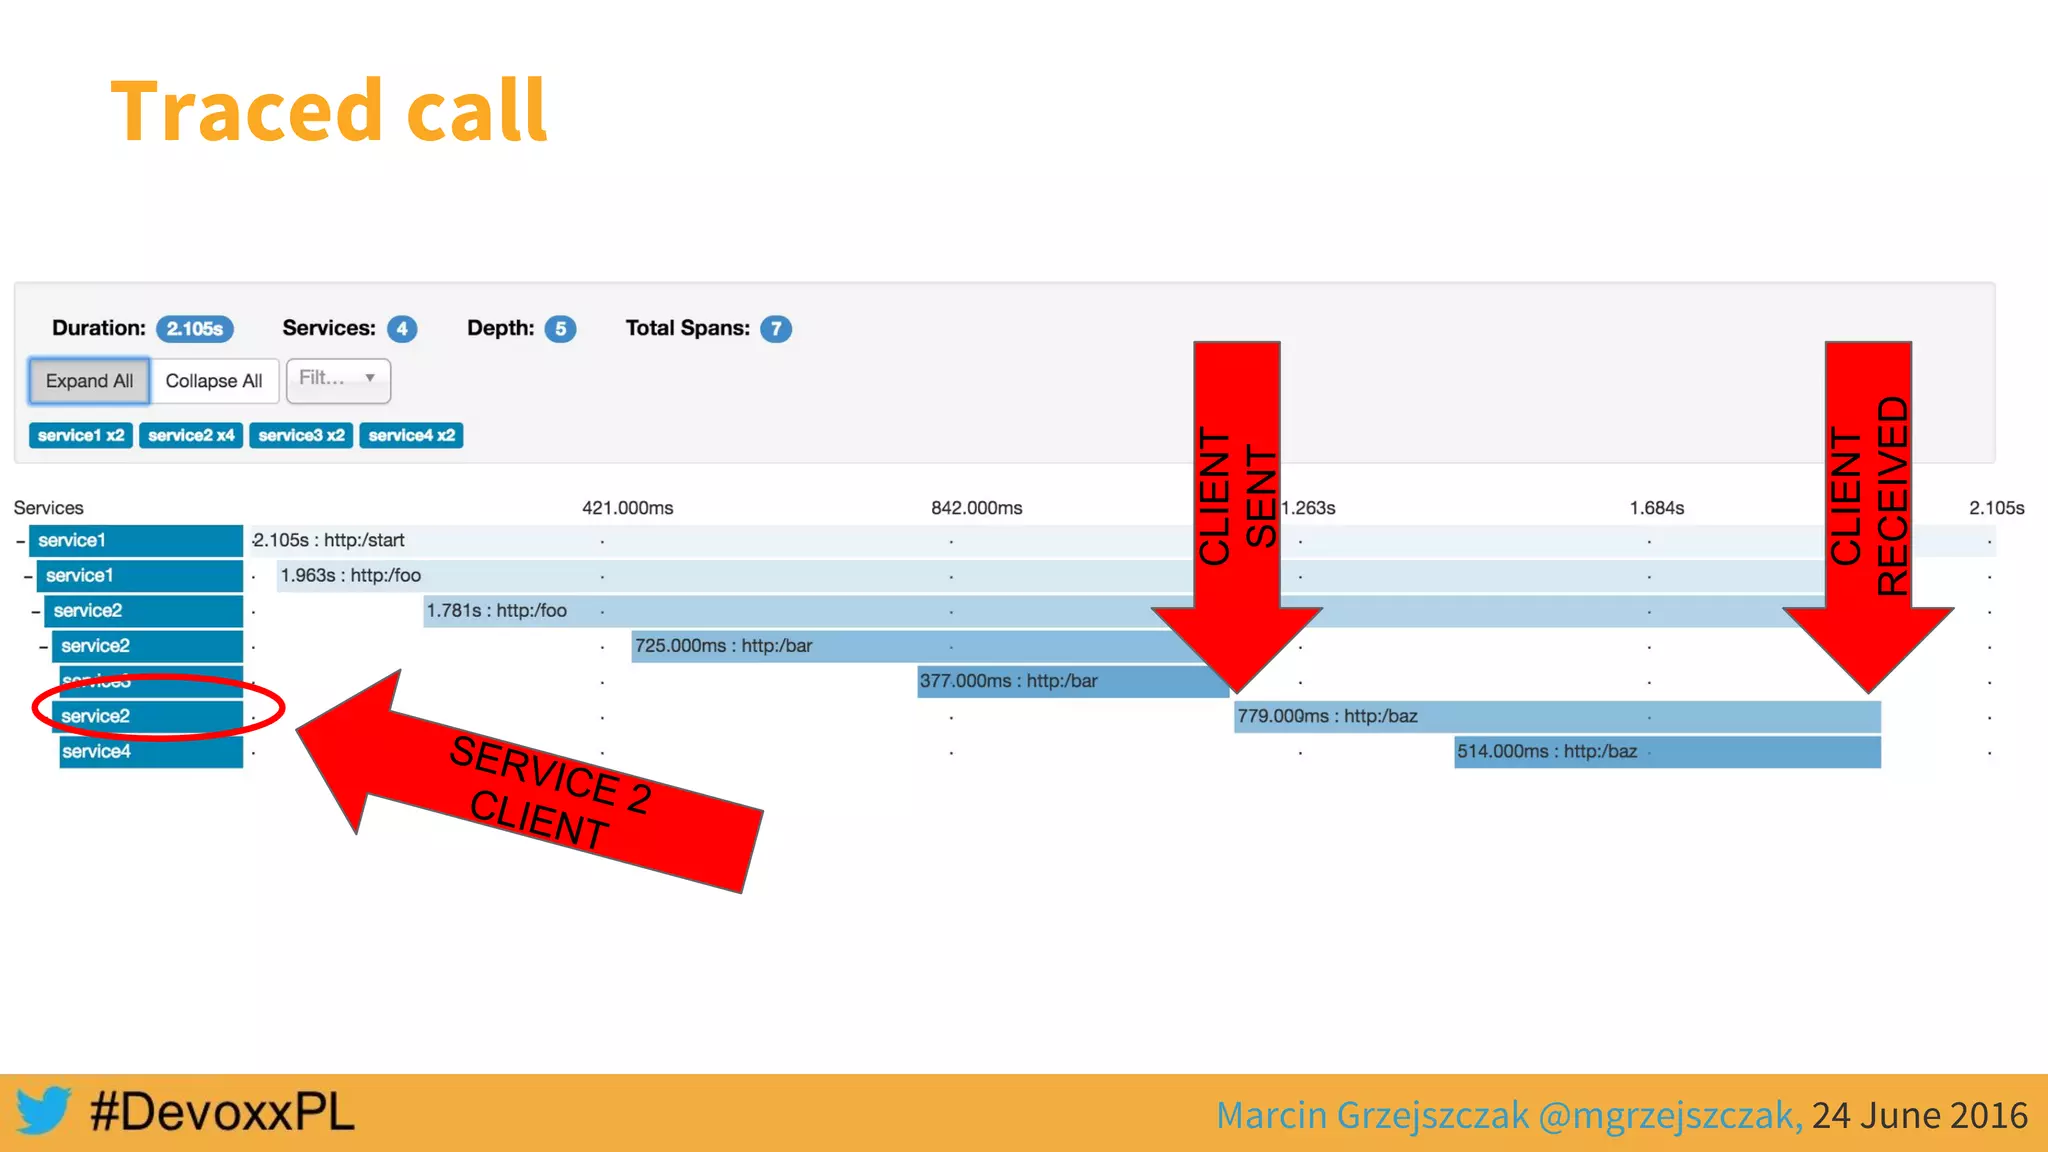
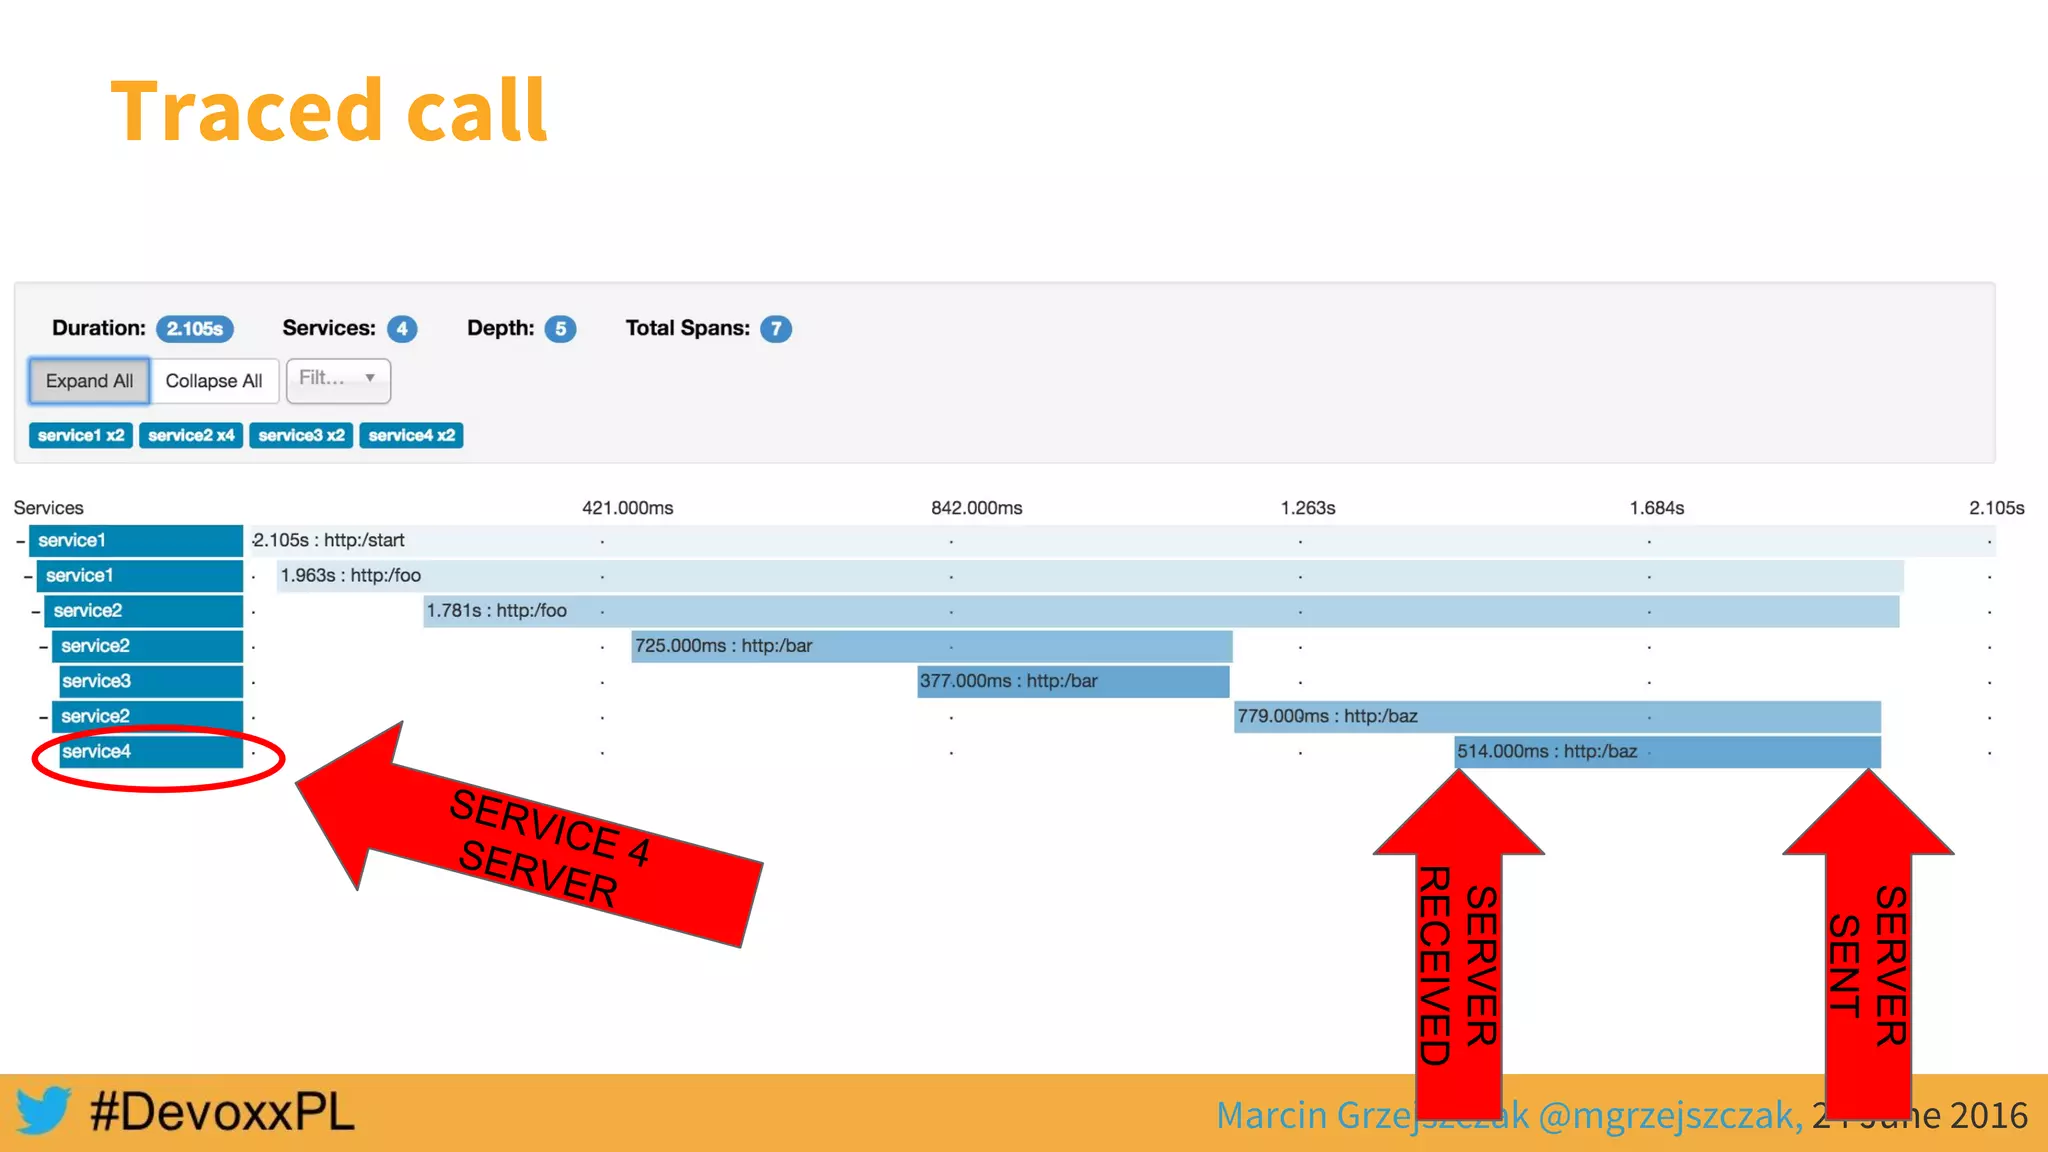
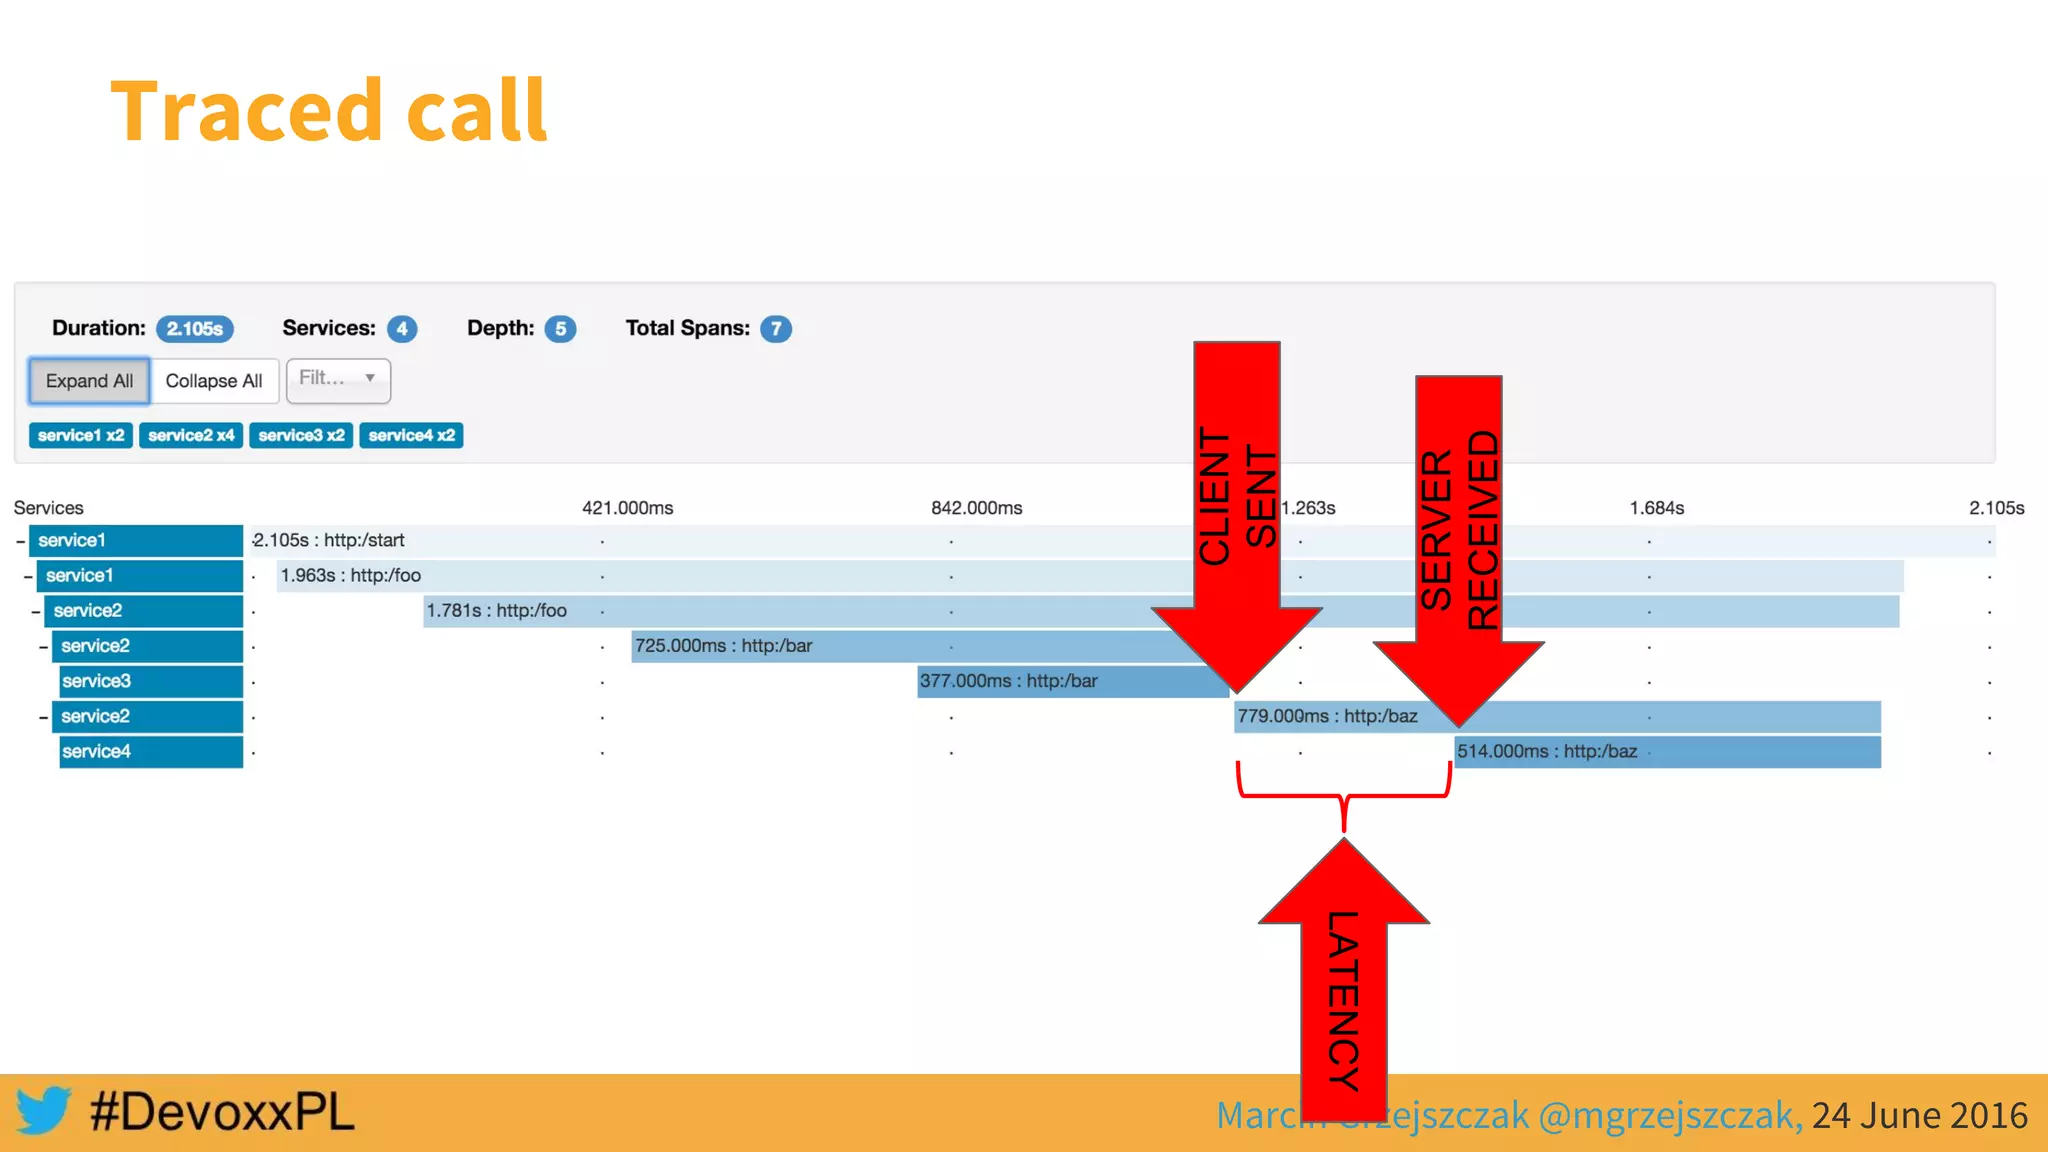
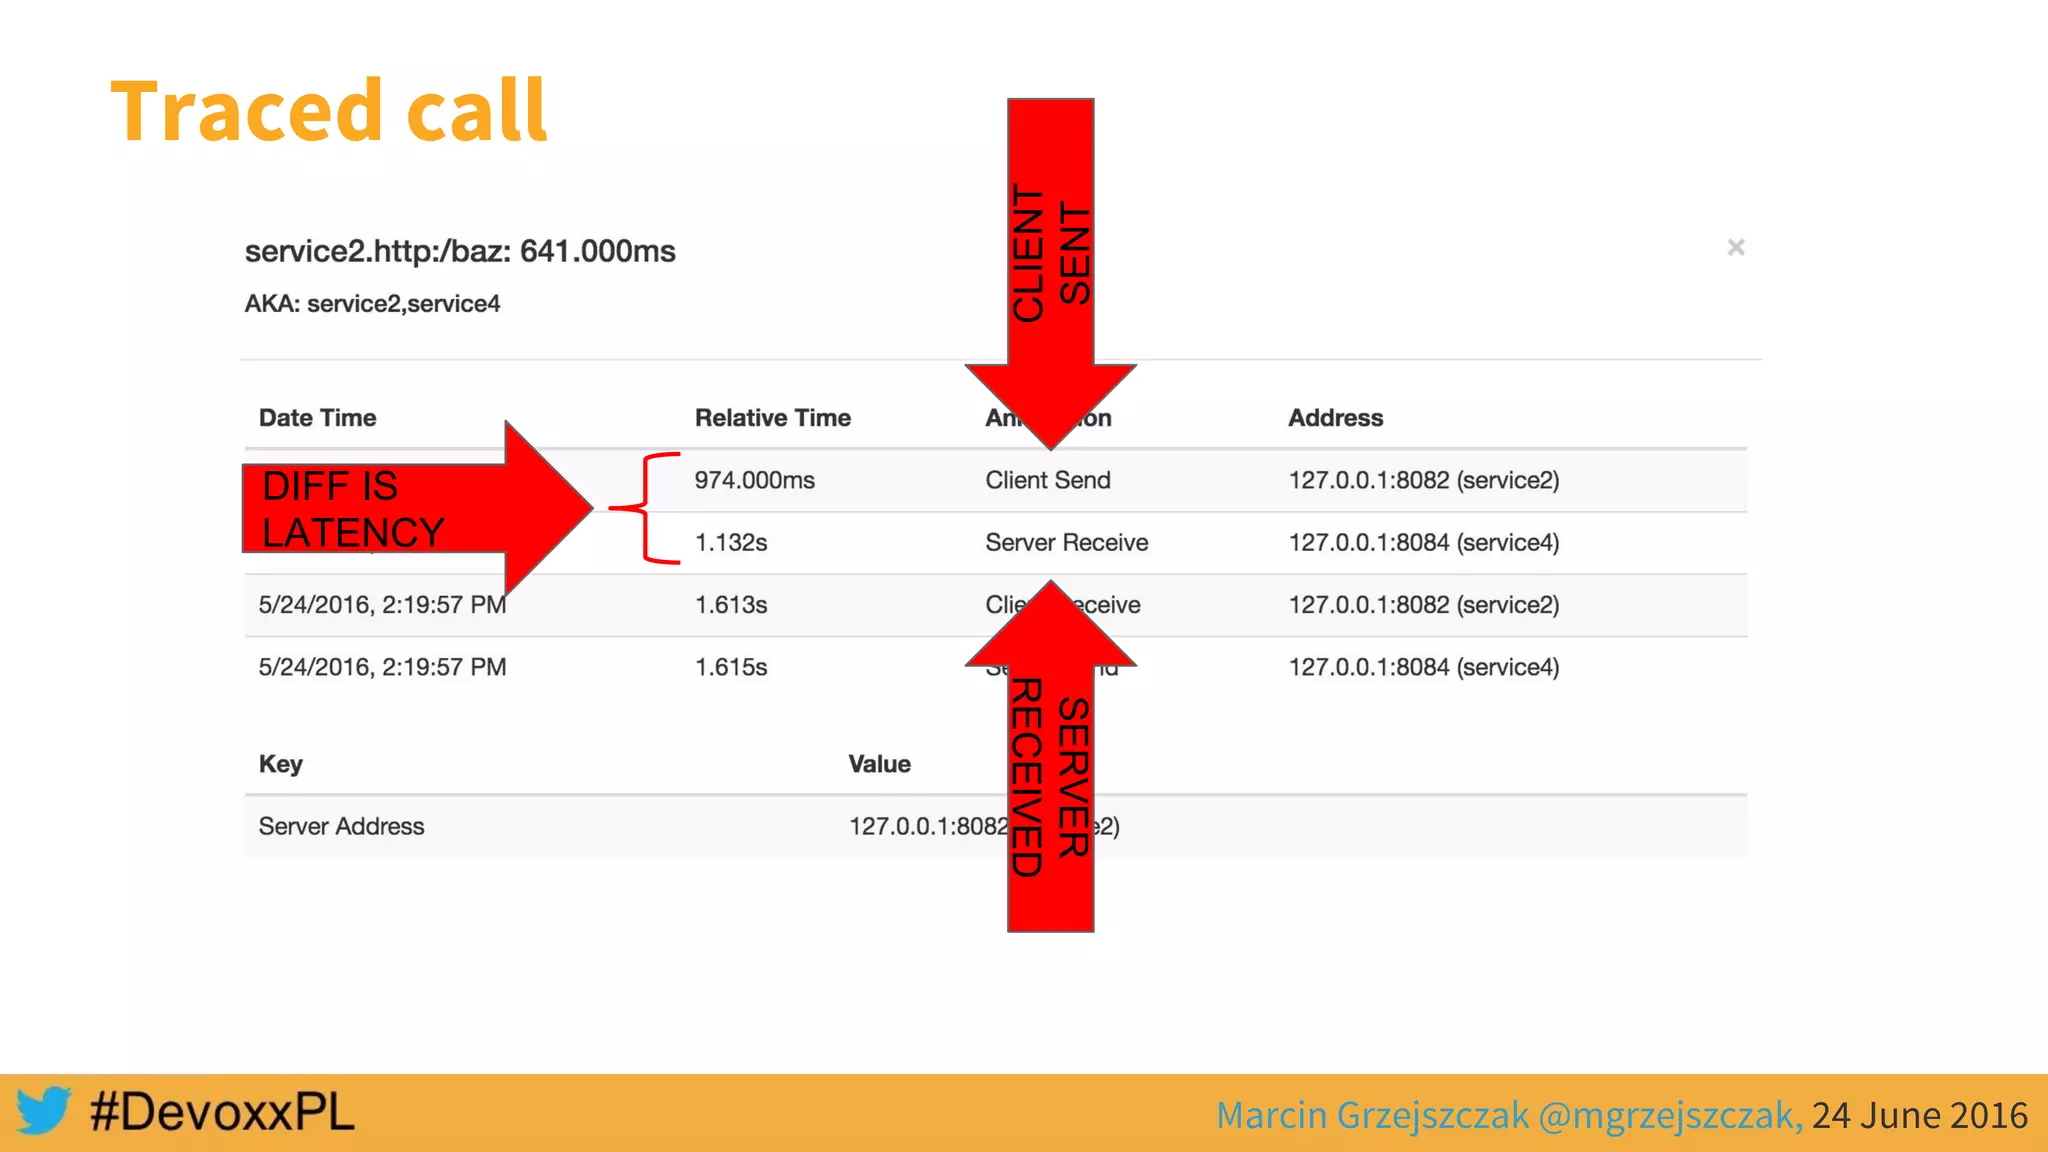
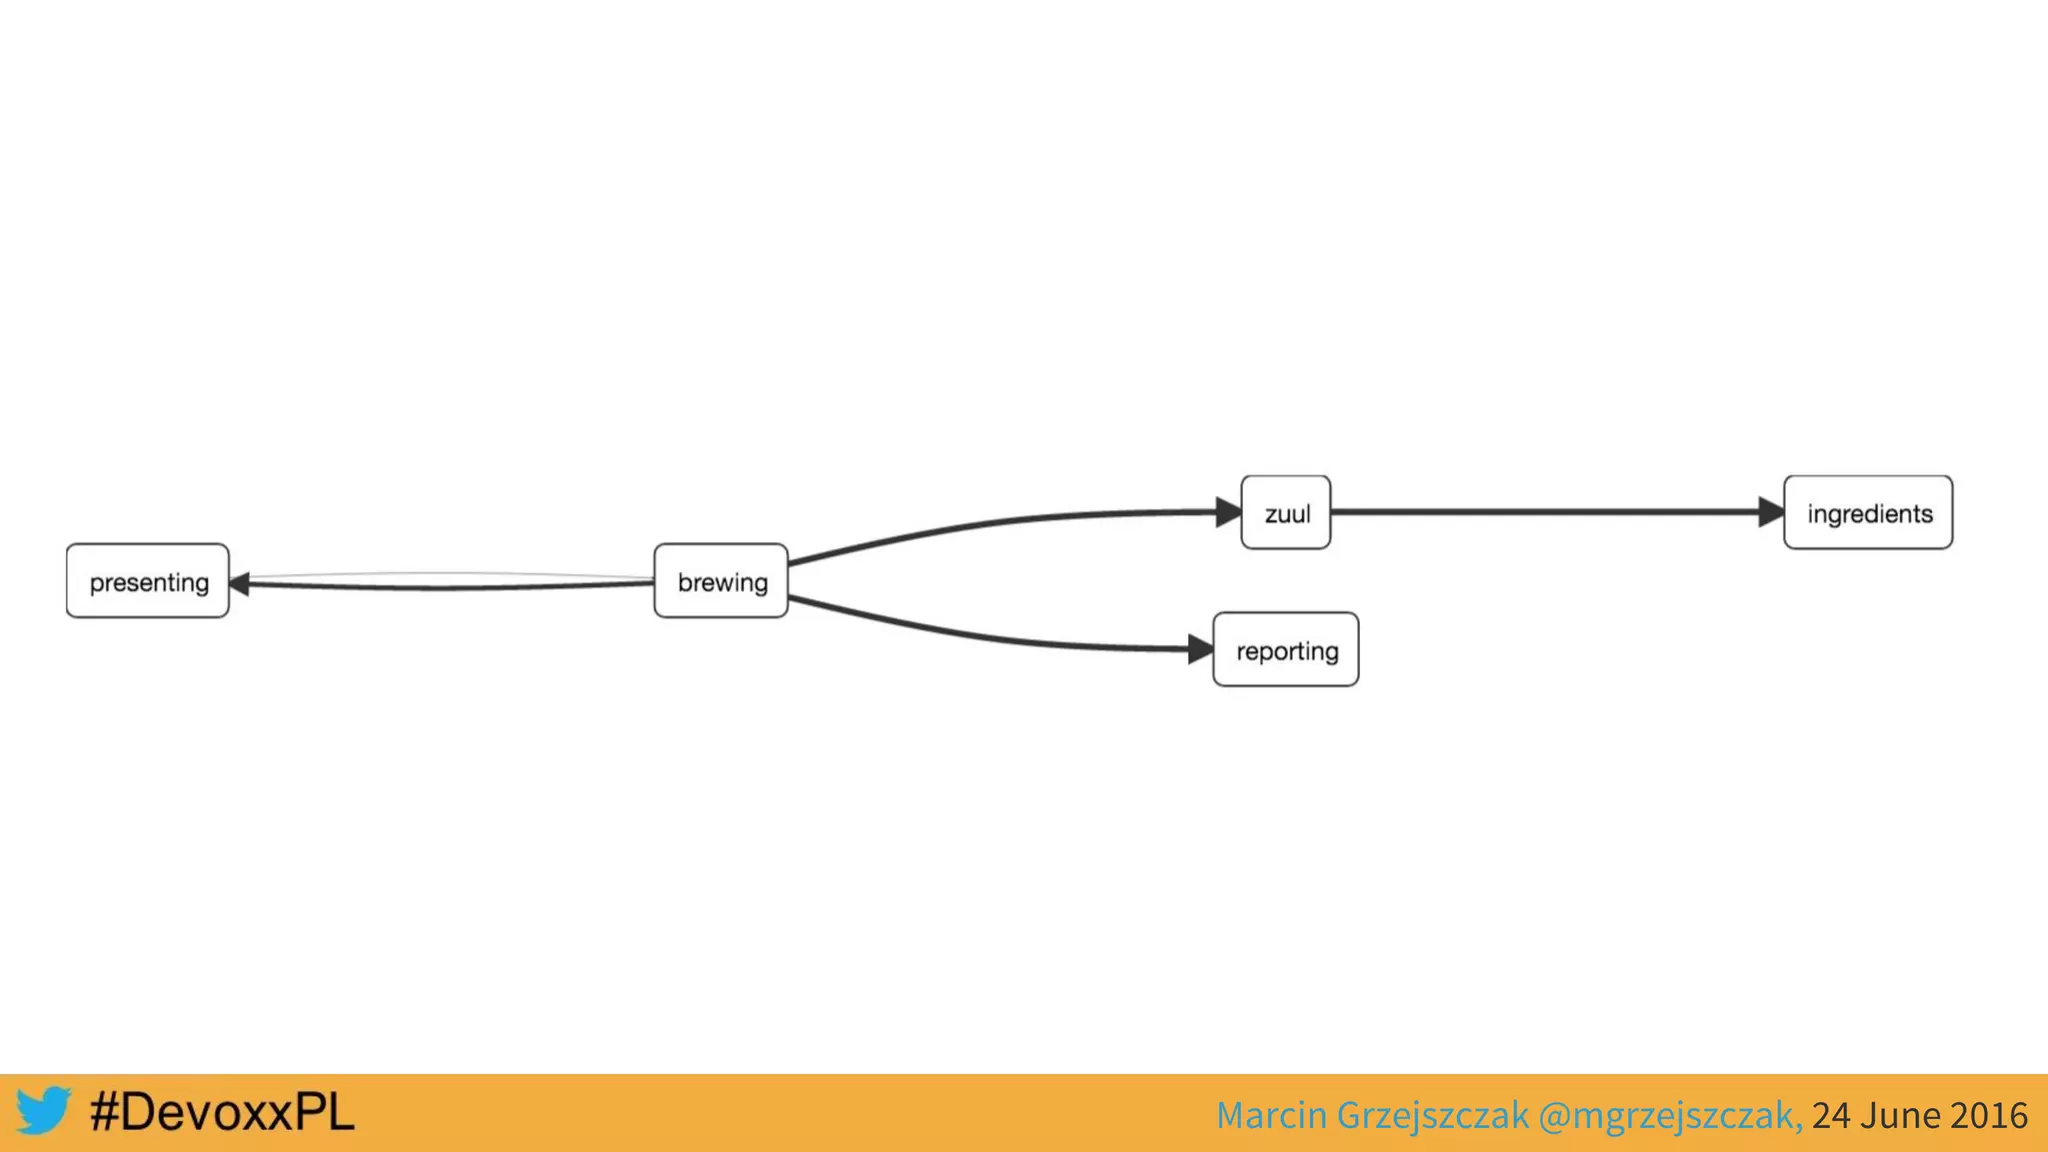
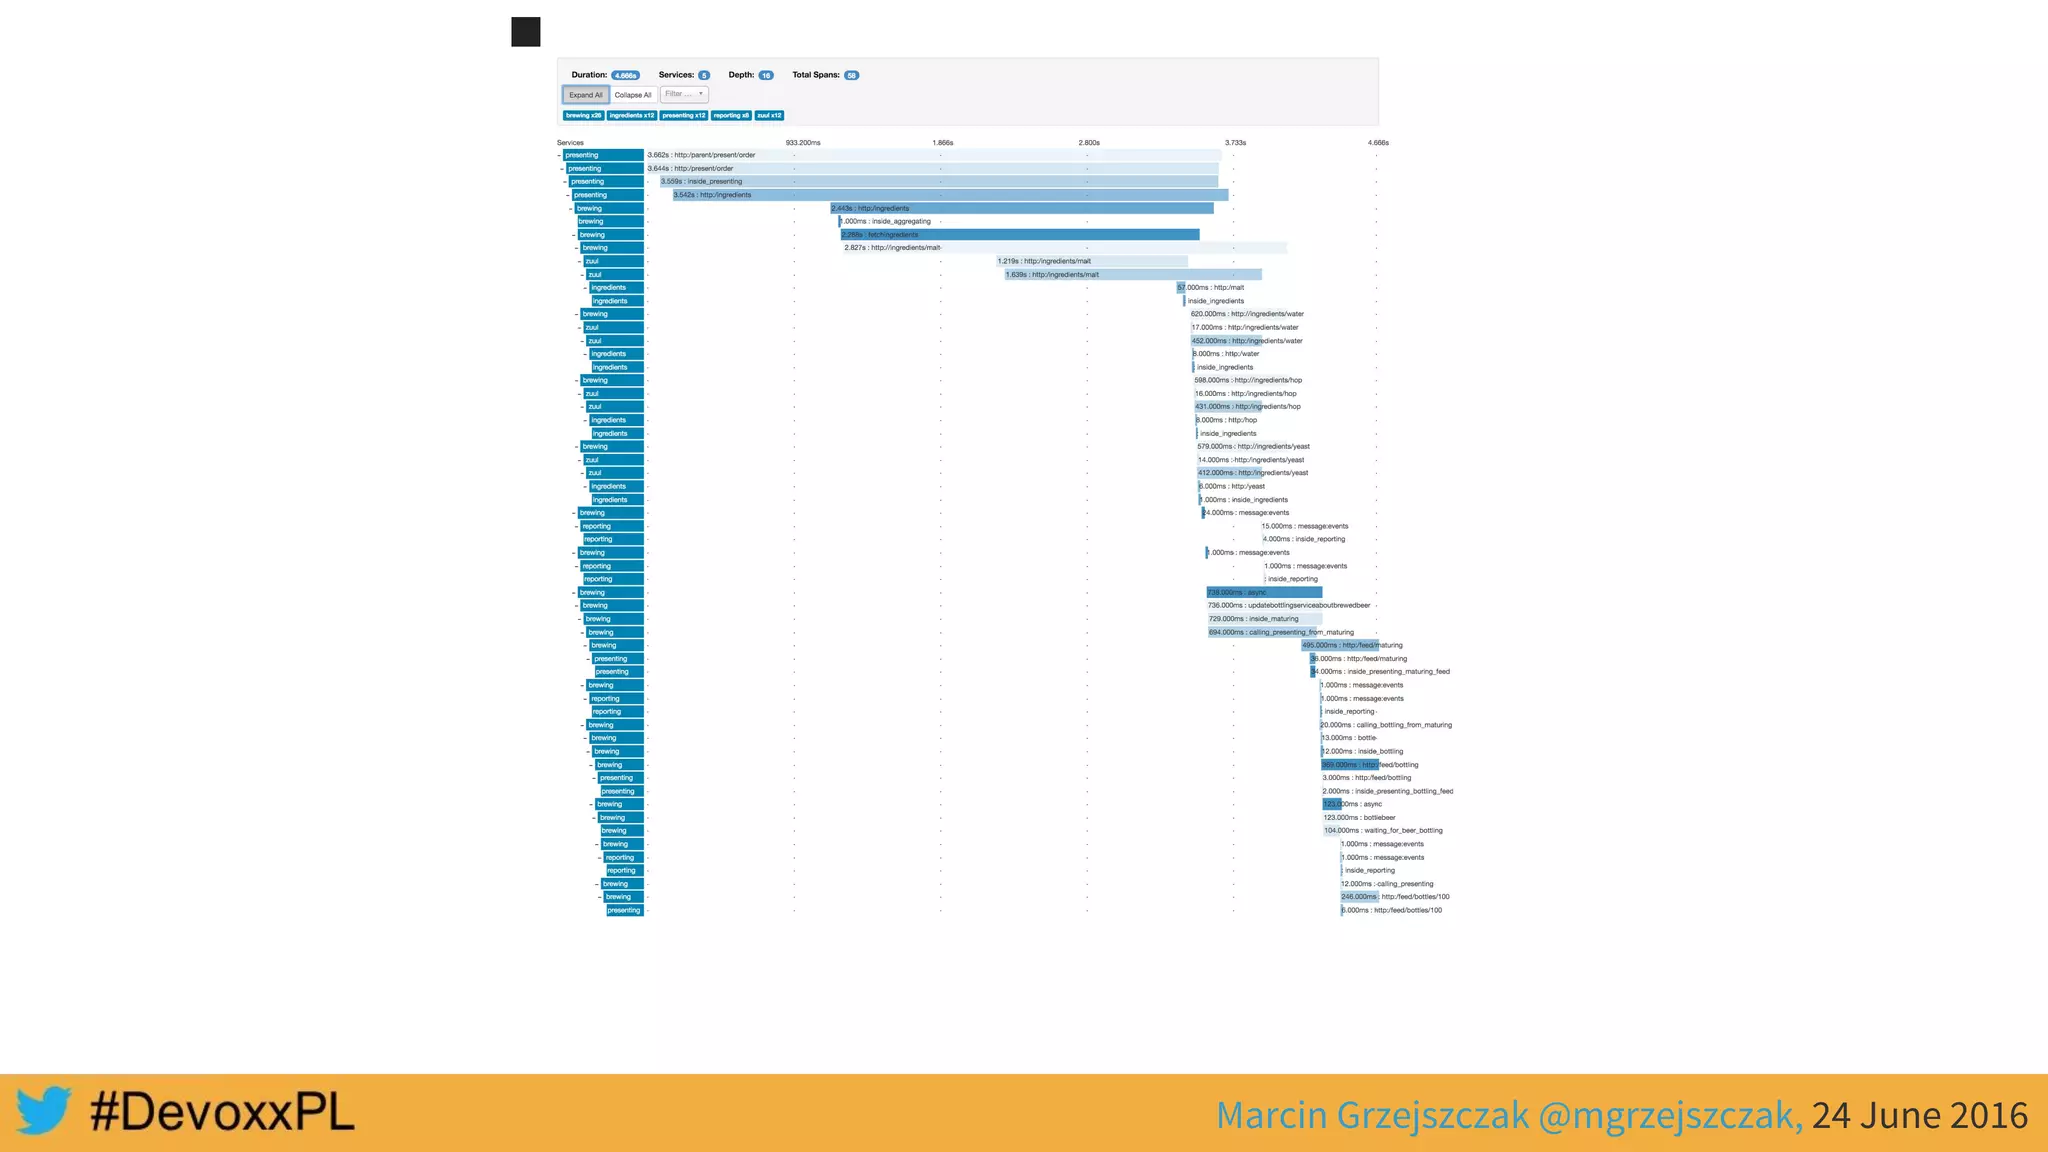


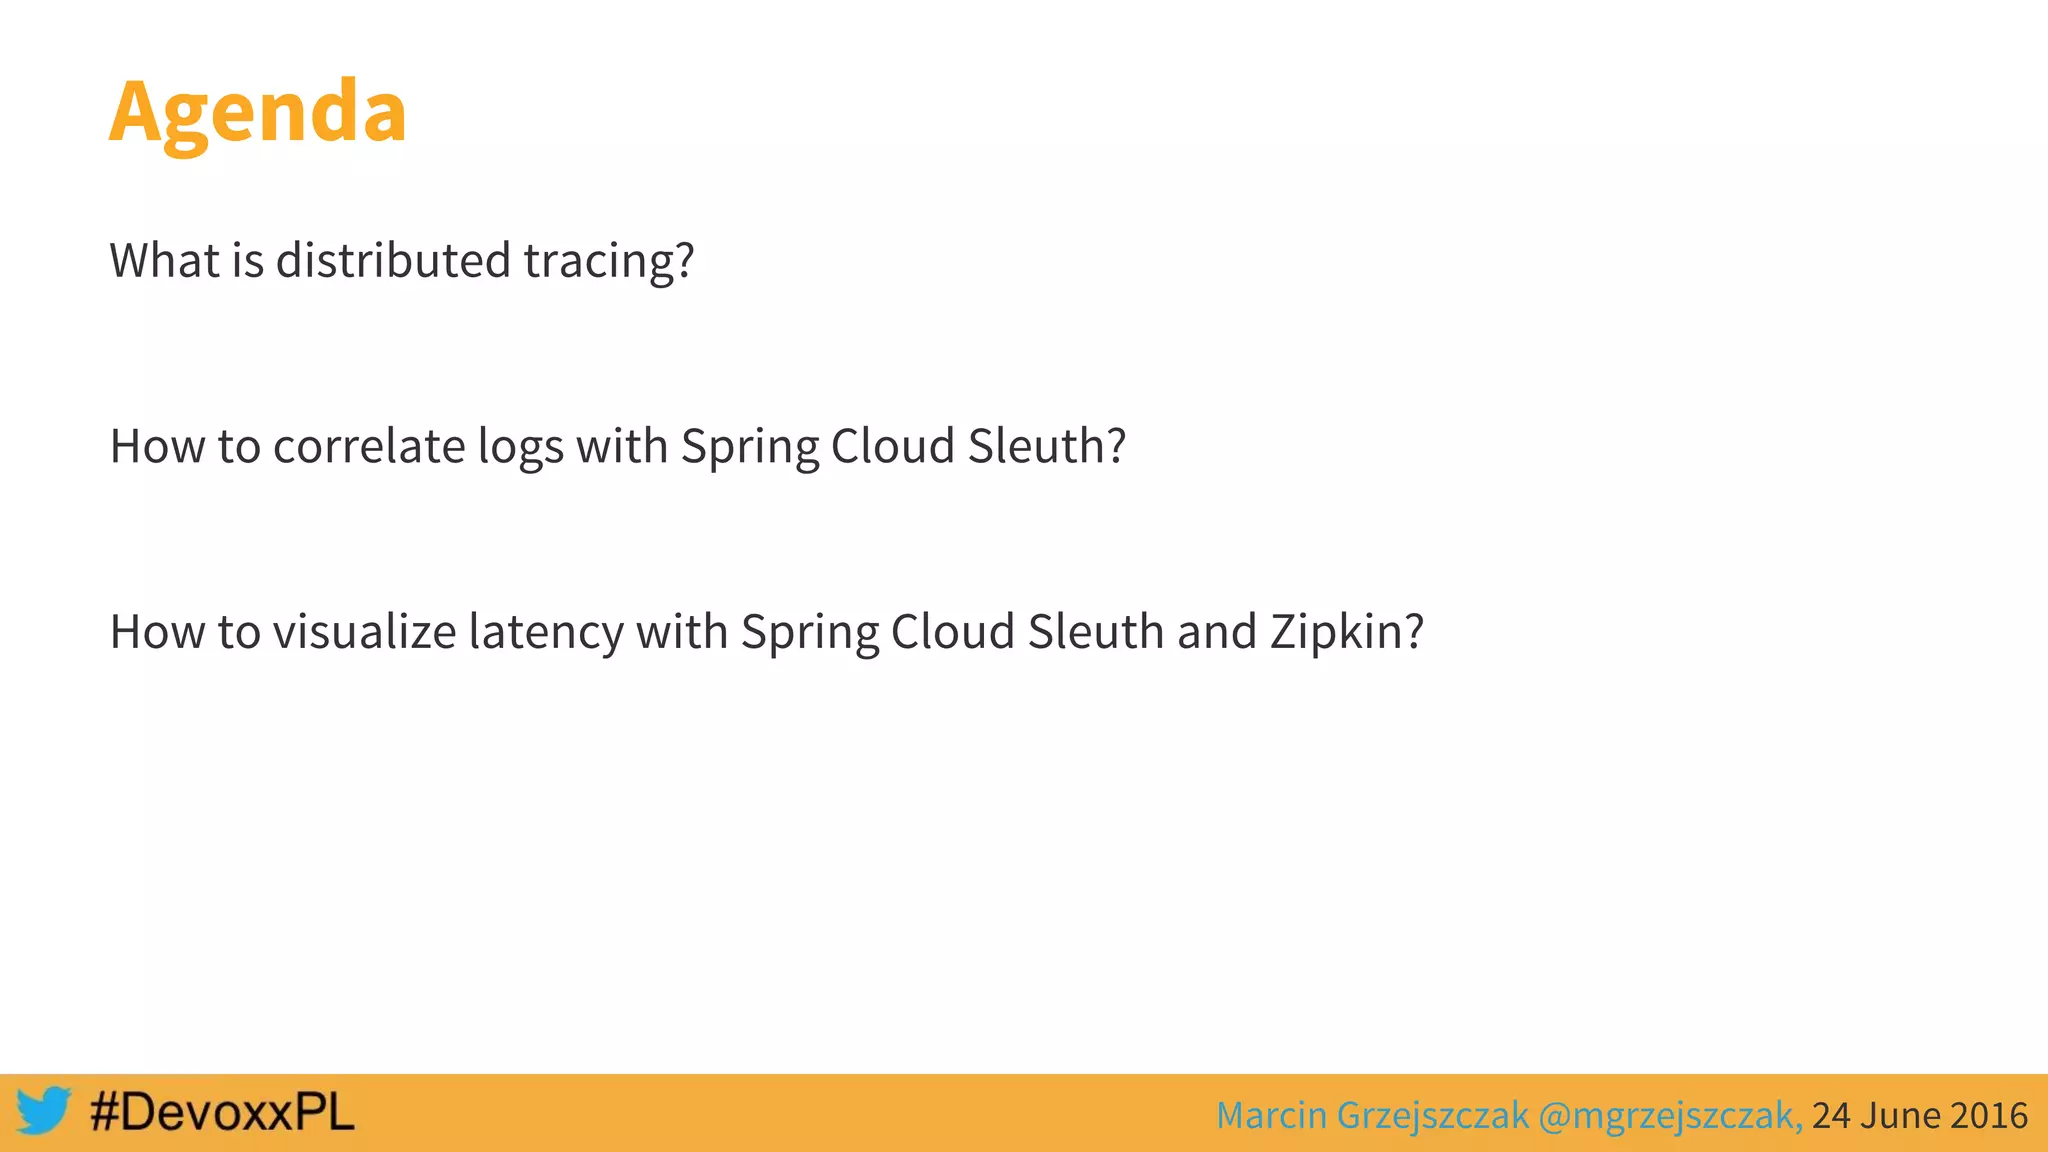
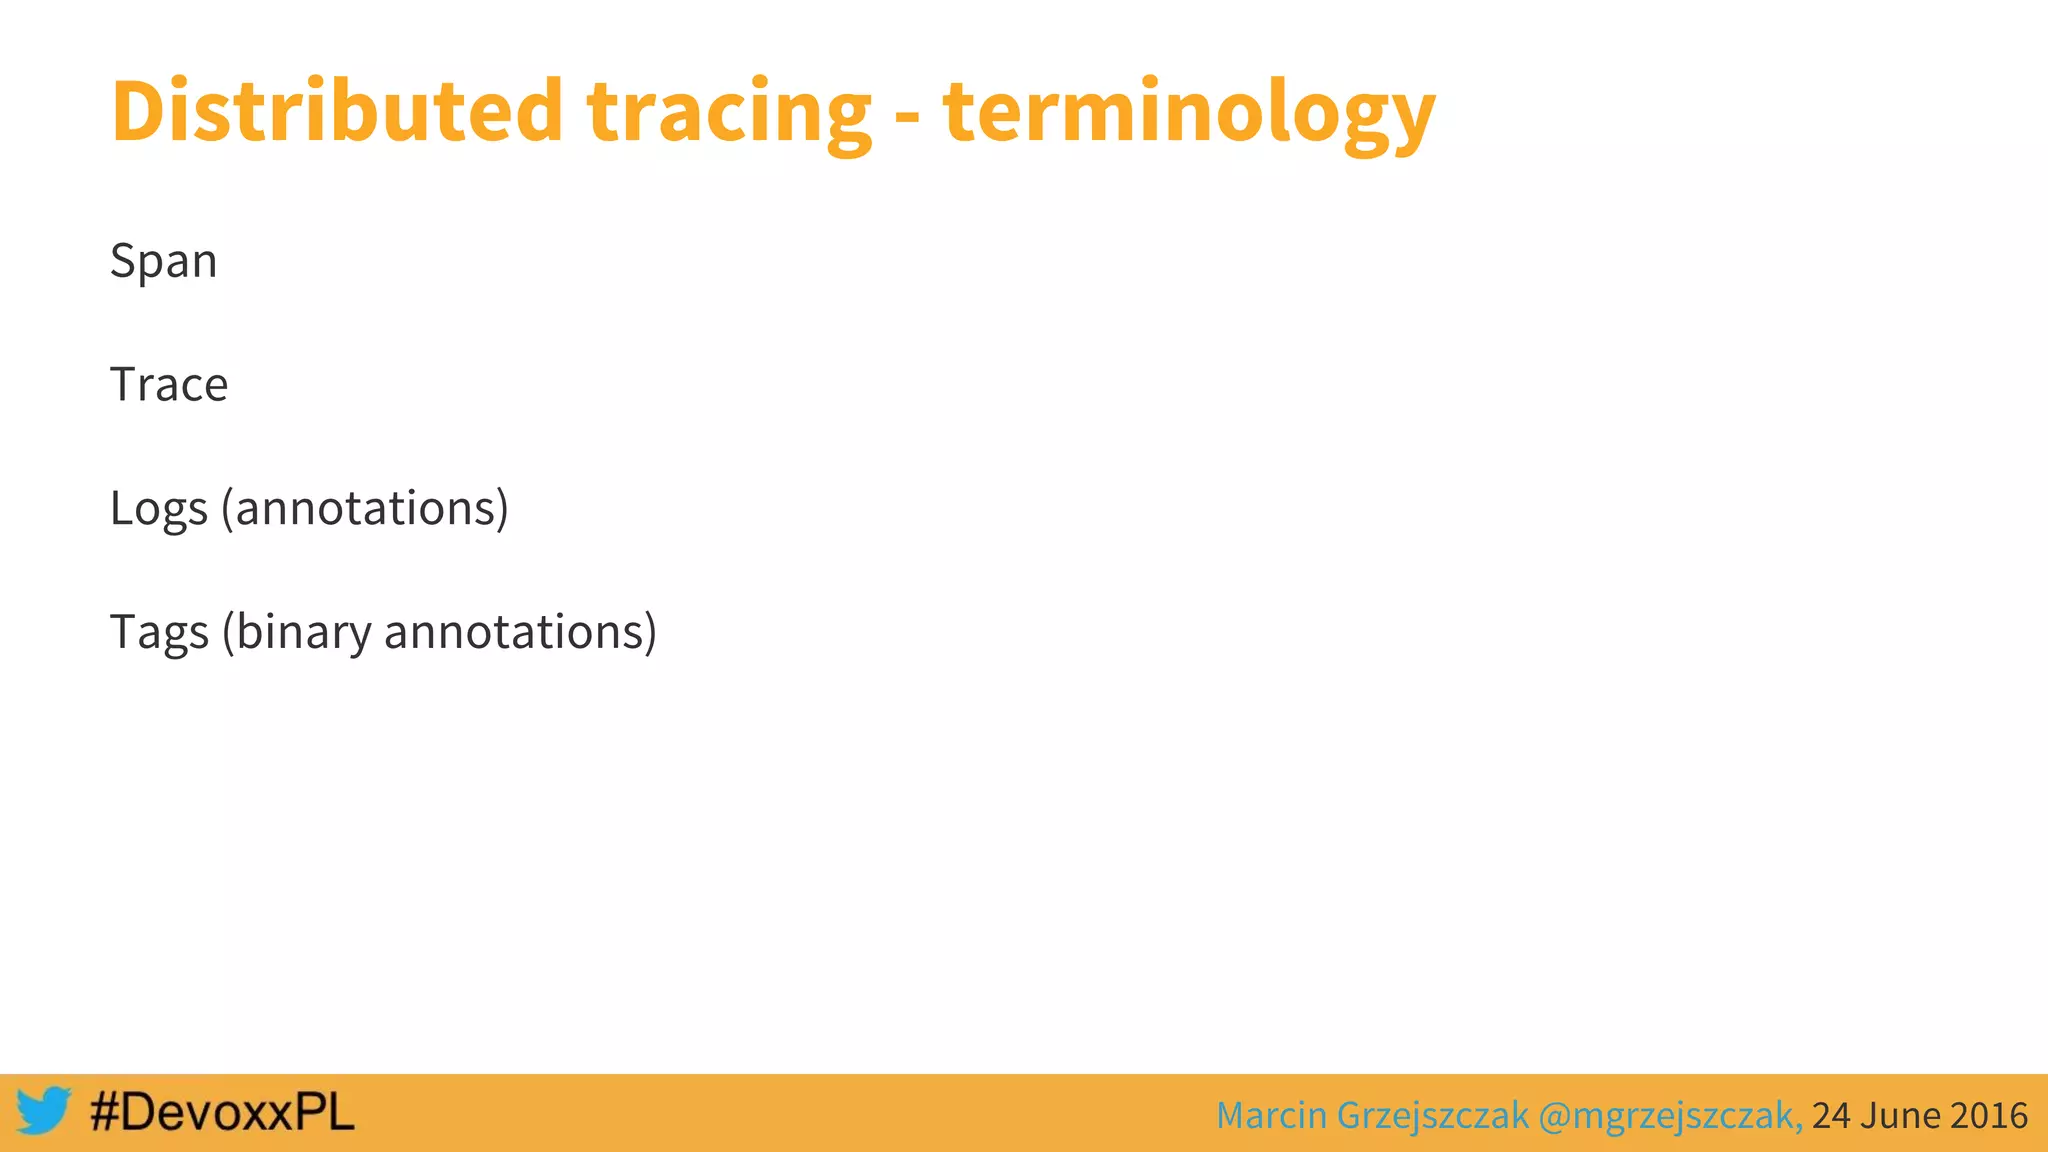
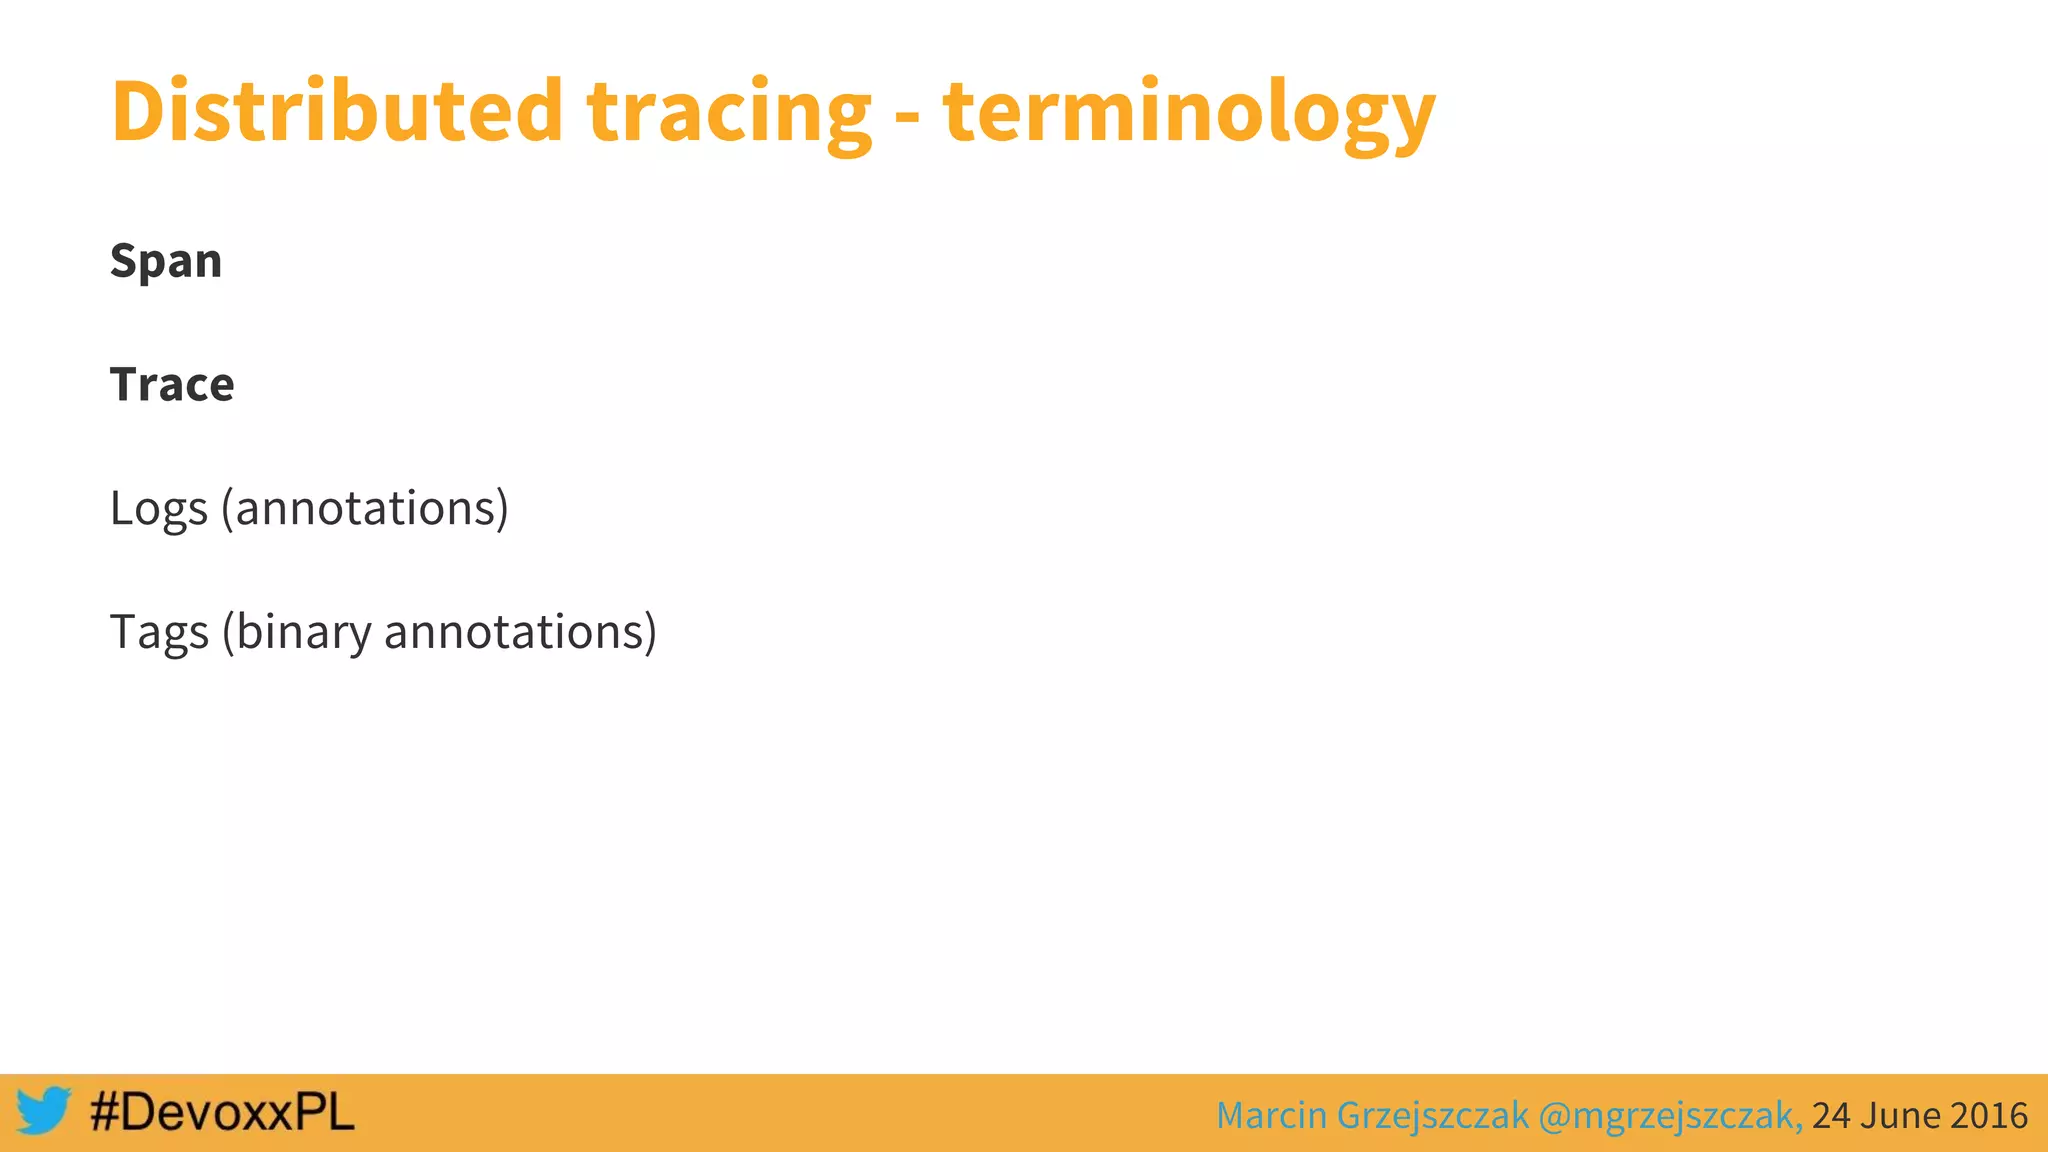
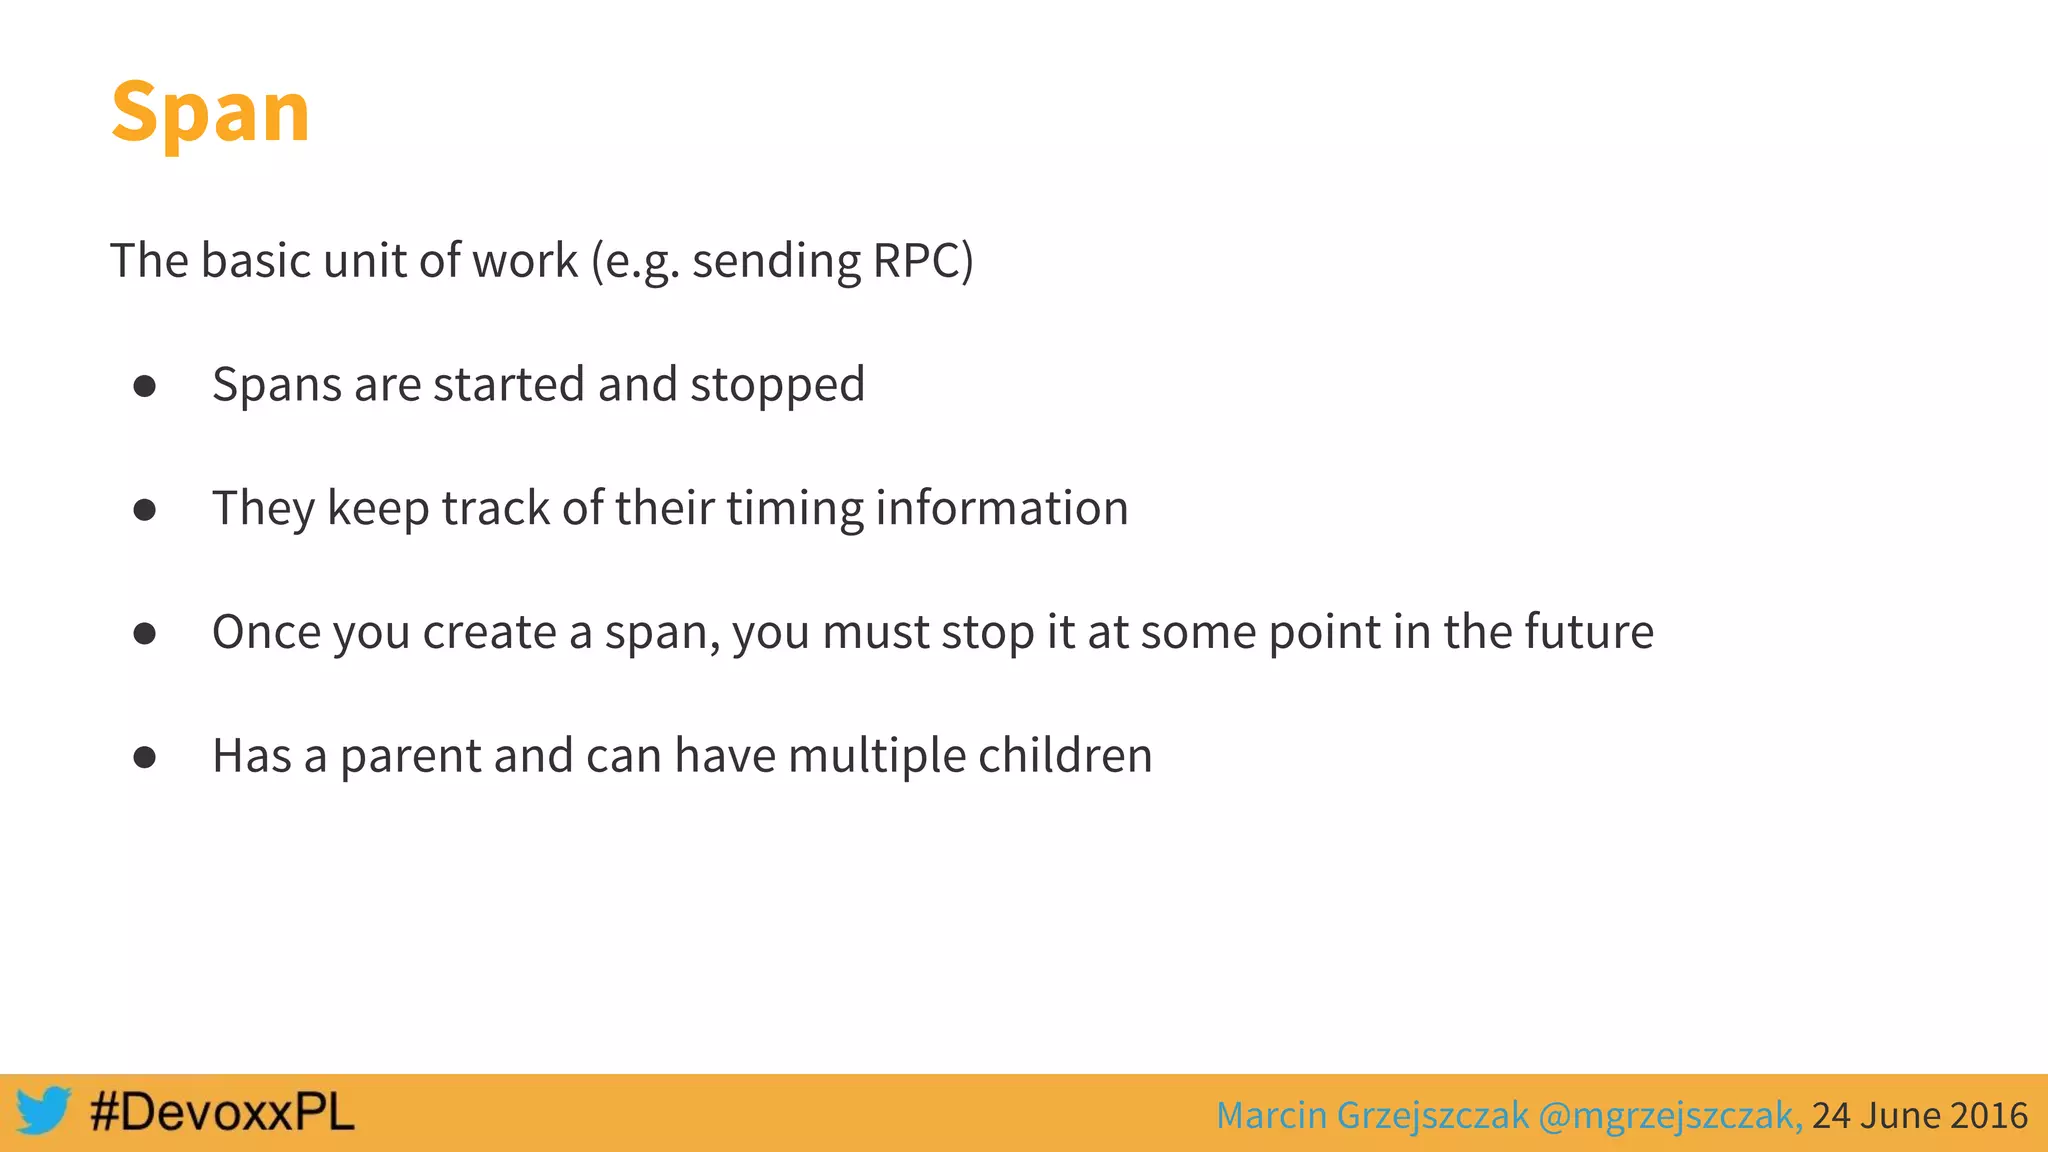
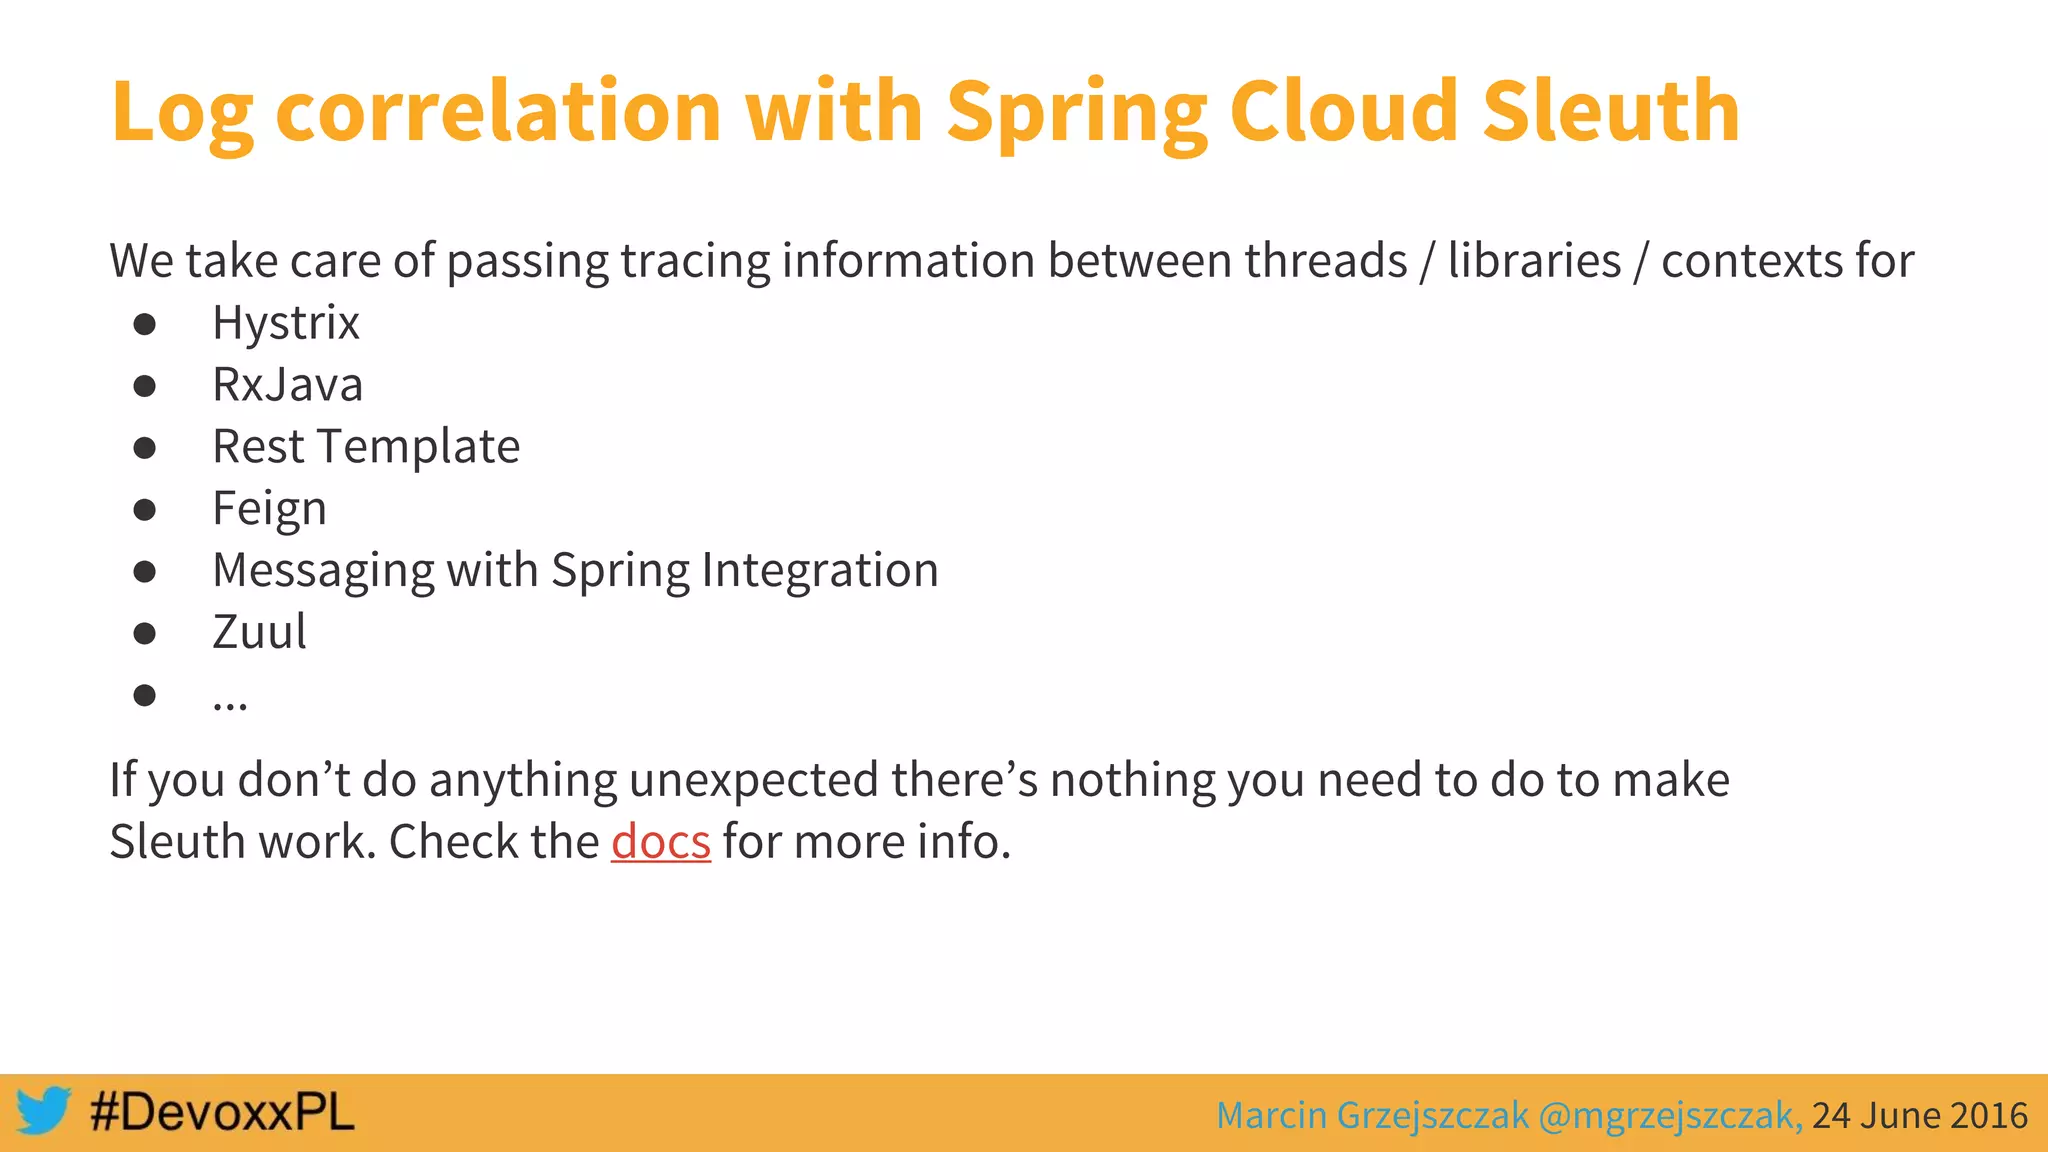
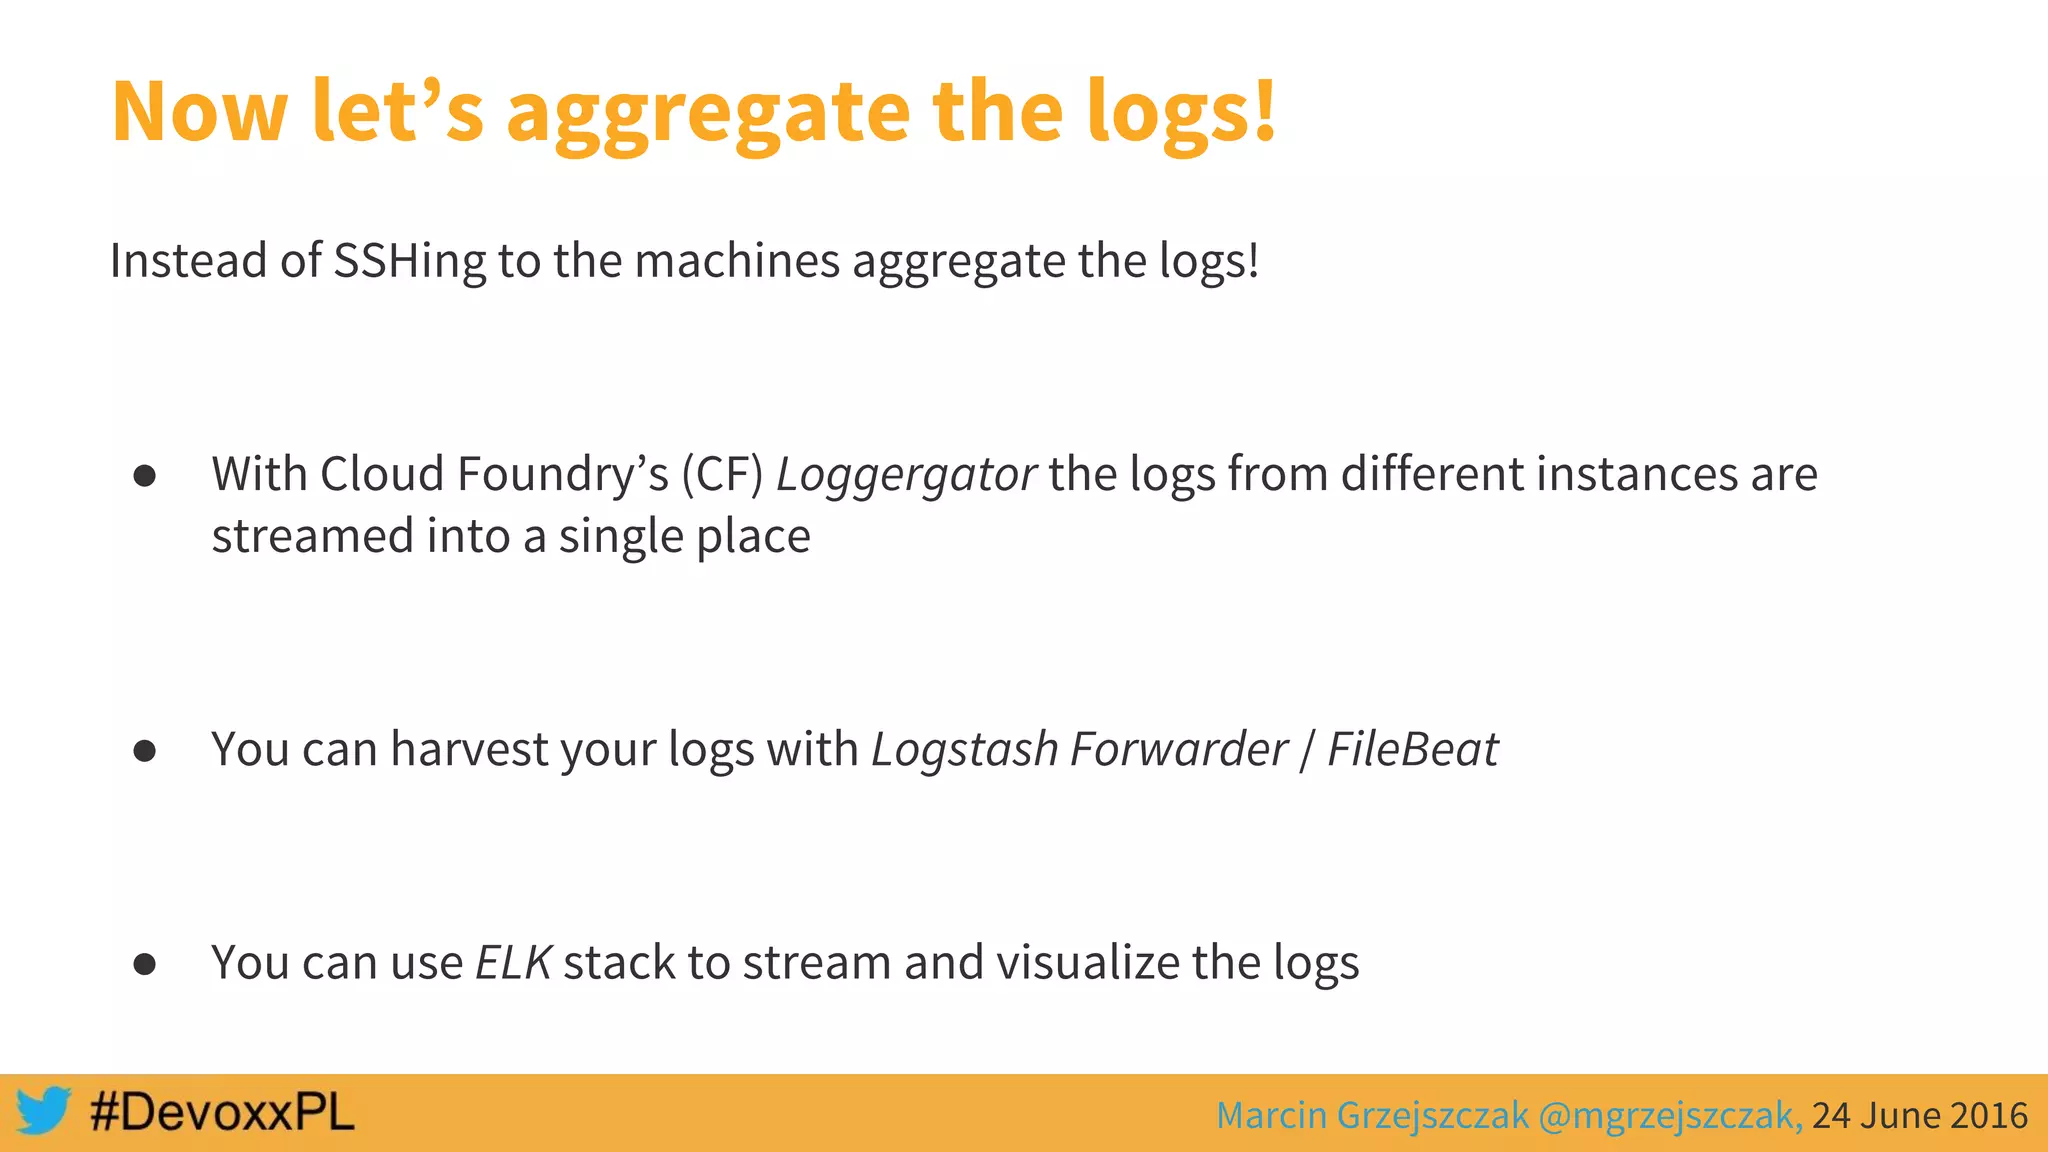
This document discusses distributed tracing with Spring Cloud and Zipkin. It begins with an overview of distributed tracing terminology like spans, traces, logs and tags. It then demonstrates how to use Spring Cloud Sleuth to correlate logs across a distributed system. Finally, it shows how to visualize latency in the distributed system using Spring Cloud Sleuth and Zipkin, which collects timing data from spans to generate waterfall graphs of service calls.