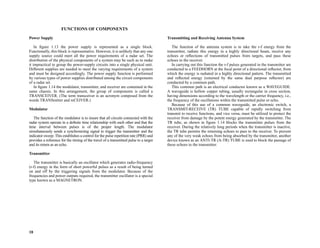
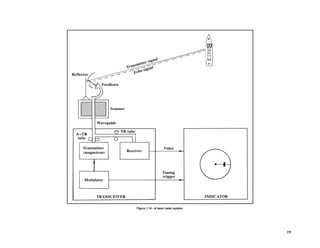
SlideShare a Scribd company logo
1 of 34
Download to read offline
1
CHAPTER 1 — BASIC RADAR PRINCIPLES AND GENERAL CHARACTERISTICS
INTRODUCTION
The word radar is an acronym derived from the phrase RAdio Detection
And Ranging and applies to electronic equipment designed for detecting and
tracking objects (targets) at considerable distances. The basic principle
behind radar is simple - extremely short bursts of radio energy (traveling at
the speed of light) are transmitted, reflected off a target and then returned as
an echo.
Radar makes use of a phenomenon we have all observed, that of the
ECHO PRINCIPLE. To illustrate this principle, if a ship’s whistle were
sounded in the middle of the ocean, the sound waves would dissipate their
energy as they traveled outward and at some point would disappear entirely.
If, however the whistle sounded near an object such as a cliff some of the
radiated sound waves would be reflected back to the ship as an echo.
The form of electromagnetic signal radiated by the radar depends upon
the type of information needed about the target. Radar, as designed for
marine navigation applications, is pulse modulated. Pulse-modulated radar
can determine the distance to a target by measuring the time required for an
extremely short burst of radio-frequency (r-f) energy to travel to the target
and return to its source as a reflected echo. Directional antennas are used for
transmitting the pulse and receiving the reflected echo, thereby allowing
determination of the direction or bearing of the target echo.
Once time and bearing are measured, these targets or echoes are
calculated and displayed on the radar display. The radar display provides the
operator a birds eye view of where other targets are relative to own ship.
Radar is an active device. It utilizes its own radio energy to detect and
track the target. It does not depend on energy radiated by the target itself.
The ability to detect a target at great distances and to locate its position with
high accuracy are two of the chief attributes of radar.
There are two groups of radio frequencies allocated by international
standards for use by civil marine radar systems. The first group lies in the X-
band which corresponds to a wavelength of 3 cm. and has a frequency range
between 9300 and 9500 MHz. The second group lies in the S-band with a
wavelength of 10 cm. and has a frequency range of 2900 to 3100 MHz. It is
sometimes more convenient to speak in terms of wavelength rather than
frequency because of the high values associated with the latter.
A fundamental requirement of marine radar is that of directional
transmission and reception, which is achieved by producing a narrow
horizontal beam. In order to focus the radio energy into a narrow beam the
laws of physics prevail and the wavelength must be within the few
centimeters range.
The radio-frequency energy transmitted by pulse-modulated radars
consists of a series of equally spaced pulses, frequently having durations of
about 1 microsecond or less, separated by very short but relatively long
periods during which no energy is transmitted. The terms PULSE-
MODULATED RADAR and PULSE MODULATION are derived from this
method of transmission of radio-frequency energy.
If the distance to a target is to be determined by measuring the time
required for one pulse to travel to the target and return as a reflected echo, it
is necessary that this cycle be completed before the pulse immediately
following is transmitted. This is the reason why the transmitted pulses must
be separated by relatively long nontransmitting time periods. Otherwise,
transmission would occur during reception of the reflected echo of the
preceding pulse. Using the same antenna for both transmitting and receiving,
the relatively weak reflected echo would be blocked by the relatively strong
transmitted pulse.
2
A BRIEF HISTORY
Radar, the device which is used for detection and ranging of contacts,
independent of time and weather conditions, was one of the most important
scientific discoveries and technological developments that emerged from
WWII. It’s development, like that of most great inventions was mothered by
necessity. Behind the development of radar lay more than a century of radio
development.
The basic idea of radar can be traced back to the classical experiments on
electromagnetic radiation conducted by the scientific community in the 19th
century. In the early 1800s, an English physicist, Michael Faraday,
demonstrated that electric current produces a magnetic field and that the
energy in this field returns to the circuit when the current is stopped. In 1864
the Scottish physicist, James Maxwell, had formulated the general equations
of the electromagnetic field, determining that both light and radio waves are
actually electromagnetic waves governed by the same fundamental laws but
having different frequencies. He proved mathematically that any electrical
disturbance could produce an effect at a considerable distance from the point
of origin and that this electromagnetic energy travels outward from the
source in the form of waves moving at the speed of light.
At the time of Maxwell’s conclusions there was no available means to
propagate or detect electromagnetic waves. It was not until 1886 that
Maxwell’s theories were tested. The German physicist, Heinrich Hertz, set
out to validate Maxwell’s general equations. Hertz was able to show that
electromagnetic waves travelled in straight lines and that they can be
reflected from a metal object just as light waves are reflected by a mirror.
In 1904 the German engineer, Christian Hulsmeyer obtained a patent for a
device capable of detecting ships. This device was demonstrated to the
German navy, but failed to arouse interest probably due in part to its very
limited range. In 1922, Guglielmo Marconi drew attention to the work of
Hertz and repeated Hertz’s experiments and eventually proposed in principle
what we know now as marine radar.
The first observation of the radar effect was made in 1922 by Dr. Albert
Taylor of the Naval Research Laboratory (NRL) in Washington, D.C. Dr.
Taylor observed that a ship passing between a radio transmitter and receiver
reflected some of the waves back to the transmitter. In 1930 further tests at
the NRL observed that a plane flying through a beam from a transmitting
antenna caused a fluctuation in the signal. The importance of radar for the
purposes of tracking aircraft and ships finally became recognized when
scientists and engineers learned how to use a single antenna for transmitting
and receiving.
Due to the prevailing political and military conditions at the time, the
United States, Great Britain, Soviet Union, France, Italy, Germany and Japan
all began experimenting with radar, with varying degrees of success. During
the 1930s, efforts were made by several countries to use radio echo for
aircraft detection. Most of these countries were able to produce some form
of operational radar equipment for use by the military at the start of the war
in 1939.
At the beginning of WWII, Germany had progressed further in radar
development and employed radar units on the ground and in the air for
defense against allied aircraft. The ability of radar to serve as an early
warning device proved valuable as a defensive tool for the British and the
Germans.
Although radar was employed at the start of the war as a defensive
weapon, as the war progressed, it came to be used for offensive purposes too.
By the middle of 1941 radar had been employed to track aircraft
automatically in azimuth and elevation and later to track targets
automatically in range.
All of the proven radar systems developed prior to the war were in the
VHF band. These low frequency radar signals are subject to several
limitations, but despite the drawbacks, VHF represented the frontier of radar
technology. Late in 1939, British physicists created the cavity magnetron
oscillator which operated at higher frequencies. It was the magnetron that
made microwave radar a reality. It was this technological advance that marks
the beginning of modern radar.
Following the war, progress in radar technology slowed as post war
priorities were directed elsewhere. In the 1950s new and better radar systems
began to emerge and the benefits to the civil mariner became more
important. Although radar technology has been advanced primarily by the
military, the benefits have spilled over into many important civilian
applications, of which a principal example is the safety of marine navigation.
The same fundamental principles discovered nearly a century ago and the
basic data they provide, namely target range and bearing, still apply to
today’s modern marine radar units.
3
RADAR PROPAGATION CHARACTERISTICS
THE RADIO WAVE
To appreciate the capabilities and limitations of a marine radar and to be
able to use it to full advantage, it is necessary to comprehend the
characteristics and behavior of radio waves and to grasp the principles of
their generation and reception, including the echo display as seen by the
observer. Understanding the theory behind the target presentation on the
radar scope will provide the radar observer a better understanding of the art
and science of radar interpretation.
Radar (radio) waves, emitted in pulses of electromagnetic energy in the
radio-frequency band 3,000 to 10,000 MHz used for shipborne navigational
radar, have many characteristics similar to those of other waves. Like light
waves of much higher frequency, radar waves tend to travel in straight lines
or rays at speeds approximating that of light. Also, like light waves, radar
waves are subject to refraction or bending in the atmosphere.
Radio-frequency energy travels at the speed of light, approximately
162,000 nautical miles per second; therefore, the time required for a pulse to
travel to the target and return to its source is a measure of the distance to the
target. Since the radio-frequency energy makes a round trip, only half the
time of travel determines the distance to the target. The round trip time is
accounted for in the calibration of the radar.
The speed of a pulse of radio-frequency energy is so fast that the pulse can
circumnavigate the earth at the equator more than 7 times in 1 second. It should
be obvious that in measuring the time of travel of a radar pulse or signal from
one ship to a target ship, the measurement must be an extremely short time
interval. For this reason, the MICROSECOND (µsec) is used as a measure of
time for radar applications. The microsecond is one-millionth part of 1 second,
i.e., there are 1,000,000 microseconds in 1 second of time.
Radio waves have characteristics common to other forms of wave motion
such as ocean waves. Wave motion consists of a succession of crests and
troughs which follow one another at equal intervals and move along at a
constant speed. Like waves in the sea, radar waves have energy, frequency,
amplitude, wavelength, and rate of travel. Whereas waves in the sea have
mechanical energy, radar waves have electromagnetic energy, usually
expressed in watt units of power. An important characteristic of radio waves
in connection with radar is polarization. This electromagnetic energy has
associated electric and magnetic fields, the directions of which are at right
angles to each other. The orientation of the ELECTRIC AXIS in space
establishes what is known as the POLARIZATION of the wave. Horizontal
polarization is normally used with navigational radars, i.e., the direction of
the electric axis is horizontal in space. Horizontal polarization has been
found to be the most satisfactory type of polarization for navigational radars
in that stronger echoes are received from the targets normally used with
these radars when the electric axis is horizontal.
Each pulse of energy transmitted during a few tenths of a microsecond or
a few microseconds contains hundreds of complete oscillations. A CYCLE
is one complete oscillation or one complete wave, i.e., that part of the wave
motion passing zero in one direction until it next passes zero in the same
direction (see figure 1.1). The FREQUENCY is the number of cycles
completed per second. The unit now being used for frequency in cycles per
second is the HERTZ. One hertz is one cycle per second; one kilohertz (kHz)
is one thousand cycles per second; one megahertz (MHz) is one million
cycles per second.
WAVELENGTH is the distance along the direction of propagation
between successive crests or troughs. When one cycle has been completed,
the wave has traveled one wavelength.
The AMPLITUDE is the maximum displacement of the wave from its
mean or zero value.
Since the speed of radar waves is constant at 300,000 kilometers per
second, there is a definite relationship between frequency and wavelength.
Figure 1.1 - Wave.
4
The CYCLE is a complete alternation or oscillation from one crest
through a trough to the next crest.
When the wavelength is 3.2 centimeters (0.000032 km),
THE RADAR BEAM
The pulses of r-f energy emitted from the feedhorn at the focal point of a
reflector or emitted and radiated directly from the slots of a slotted
waveguide antenna would, for the most part, form a single lobe-shaped
pattern of radiation if emitted in free space. Figure 1.2 illustrates this free
space radiation pattern, including the undesirable minor lobes or SIDE
LOBES associated with practical antenna design. Because of the large
differences in the various dimensions of the radiation pattern, figure 1.2 is
necessarily distorted.
Although the radiated energy is concentrated or focused into a relatively
narrow main beam by the antenna, similar to a beam of light from a flashlight,
there is no clearly defined envelope of the energy radiated. While the energy is
concentrated along the axis of the beam, its strength decreases with distance
along the axis. The strength of the energy decreases rapidly in directions away
from the beam axis. The power in watts at points in the beam is inversely
proportional to the square of the distance. Therefore, the power at 3 miles is only
1/9th of the power at 1 mile in a given direction. The field intensity in volts at
points in the beam is inversely proportional to the distance. Therefore, the
voltage at 2 miles is only one-half the voltage at 1 mile in a given direction. With
the rapid decrease in the amount of radiated energy in directions away from the
axis and in conjunction with the rapid decreases of this energy with distance, it
follows that practical limits of power or voltage may be used to define the
dimensions of the radar beam or to establish its envelope of useful energy.
Beam Width
The three-dimensional radar beam is normally defined by its horizontal
and vertical beam widths. Beam width is the angular width of a radar beam
between points within which the field strength or power is greater than
arbitrarily selected lower limits of field strength or power.
There are two limiting values, expressed either in terms of field intensity
or power ratios, used conventionally to define beam width. One convention
defines beam width as the angular width between points at which the field
strength is 71 percent of its maximum value. Expressed in terms of power
ratio, this convention defines beam width as the angular width between
HALF-POWER POINTS. The other convention defines beam width as the
angular width between points at which the field strength is 50 percent of its
maximum value. Expressed in terms of power ratio, the latter convention
defines beam width as the angular width between QUARTER-POWER
POINTS.
The half-power ratio is the most frequently used convention. Which
convention has been used in stating the beam width may be identified from
the decibel (dB) figure normally included with the specifications of a radar
set. Half power and 71 percent field strength correspond to -3 dB; quarter
power and 50 percent field strength correspond to -6 dB.
Figure 1.2 - Free space radiation pattern.
frequency
speed of radar waves
wavelength
-------------------------------------------------
-
=
frequency
300 000 km
,
ond
sec
--------------------------------
-
0.000032 km
cycle
----------------------------------
-
÷
frequency 9375 megahertz
=
=
5
The radiation diagram illustrated in figure 1.3 depicts relative values of
power in the same plane existing at the same distances from the antenna or
the origin of the radar beam. Maximum power is in the direction of the axis
of the beam. Power values diminish rapidly in directions away from the axis.
The beam width in this case is taken as the angle between the half-power
points.
For a given amount of transmitted power, the main lobe of the radar beam
extends to a greater distance at a given power level with greater
concentration of power in narrower beam widths. To increase maximum
detection range capabilities, the energy is concentrated into as narrow a
beam as is feasible. Because of practical considerations related to target
detection and discrimination, only the horizontal beam width is quite narrow,
typical values being between about 0.65˚ to 2.0˚. The vertical beam width is
relatively broad, typical values being between about 15˚ to 30˚.
The beam width is dependent upon the frequency or wavelength of the
transmitted energy, antenna design, and the dimensions of the antenna.
For a given antenna size (antenna aperture), narrower beam widths are
obtained when using shorter wavelengths. For a given wavelength, narrower
beam widths are obtained when using larger antennas.
The slotted waveguide antenna has largely eliminated the side-lobe
problem.
EFFECT OF SEA SURFACE ON RADAR BEAM
With radar waves being propagated in the vicinity of the surface of the
sea, the main lobe of the radar beam, as a whole, is composed of a number of
separate lobes as opposed to the single lobe-shaped pattern of radiation as
emitted in free space. This phenomenon is the result of interference between
radar waves directly transmitted and those waves which are reflected from
the surface of the sea. The vertical beam widths of navigational radars are
such that during normal transmission, radar waves will strike the surface of
the sea at points from near the antenna (depending upon antenna height and
vertical beam width) to the radar horizon. The indirect waves (see figure 1.4)
reflected from the surface of the sea may, on rejoining the direct waves,
either reinforce or cancel the direct waves depending upon whether they are
in phase or out of phase with the direct waves, respectively. Where the direct
and indirect waves are exactly in phase, i.e., the crests and troughs of the
waves coincide, hyperbolic lines of maximum radiation known as LINES OF
MAXIMA are produced. Where the direct and indirect waves are exactly of
opposite phase, i.e., the trough of one wave coincides with the crest of the
other wave, hyperbolic lines of minimum radiation known as LINES OF
MINIMA are produced. Along directions away from the antenna, the direct
and indirect waves will gradually come into and pass out of phase, producing
lobes of useful radiation separated by regions within which, for practical
purposes, there is no useful radiation.
Figure 1.5 illustrates the lower region of the INTERFERENCE
PATTERN of a representative navigational radar. Since the first line of
minima is at the surface of the sea, the first region of minimum radiation or
energy is adjacent to the sea’s surface.
From figure 1.5 it should be obvious that if r-f energy is to be reflected
from a target, the target must extend somewhat above the radar horizon, the
amount of extension being dependent upon the reflecting properties of the
target.
A VERTICAL-PLANE COVERAGE DIAGRAM as illustrated in figure
1.5 is used by radar designers and analysts to predict regions in which targets
will and will not be detected.
Of course, on the small page of a book it would be impossible to illustrate
the coverage of a radar beam to scale with antenna height being in feet and
the lengths of the various lobes of the interference pattern being in miles. In
providing greater clarity of the presentation of the lobes, non-linear
graduations of the arc of the vertical beam width are used.
Figure 1.3 - Radiation diagram.
Figure 1.4 - Direct and indirect waves.
6
Figure 1.5 - Vertical-plane coverage diagram (3050 MHz, antenna height 125 feet, wave height 4 feet).
7
Figure 1.6 - Vertical-plane coverage diagram (1000 MHz, vertical beam width 10˚, antenna height 80 feet, wave height 0 feet).
8
The lengths of the various lobes illustrated in figures 1.5 and 1.6 should be
given no special significance with respect to the range capabilities of a
particular radar set. As with other coverage diagrams, the lobes are drawn to
connect points of equal field intensities. Longer and broader lobes may be
drawn connecting points of equal, but lesser, field intensities.
The vertical-plane coverage diagram as illustrated in figure 1.6, while not
representative of navigational radars, does indicate that at the lower
frequencies the interference pattern is more coarse than the patterns for
higher frequencies. This particular diagram was constructed with the
assumption that the free space useful range of the radar beam was 50
nautical miles. From this diagram it is seen that the ranges of the useful lobes
are extended to considerably greater distances because of the reinforcement
of the direct radar waves by the indirect waves. Also, the elevation of the
lowest lobe is higher than it would be for a higher frequency. Figure 1.6 also
illustrates the vertical view of the undesirable side lobes associated with
practical antenna design. In examining these radiation coverage diagrams,
the reader should keep in mind that the radiation pattern is three-
dimensional.
Antenna height as well as frequency or wavelength governs the number of
lobes in the interference pattern. The number of the lobes and the fineness of
the interference pattern increase with antenna height. Increased antenna
height as well as increases in frequency tends to lower the lobes of the
interference pattern.
The pitch and roll of the ship radiating does not affect the structure of the
interference pattern.
9
ATMOSPHERIC FACTORS AFFECTING THE RADAR HORIZON
THE RADAR HORIZON
The affect of the atmosphere on the horizon is a further factor which
should be taken into account when assessing the likelihood of detecting a
particular target and especially where the coastline is expected.
Generally, radar waves are restricted in the recording of the range of low-
lying objects by the radar horizon. The range of the radar horizon depends
on the height of the antenna and on the amount of bending of the radar wave.
The bending is caused by diffraction and refraction. Diffraction is a property
of the electromagnetic wave itself. Refraction is due to the prevailing
atmospheric conditions. There is, therefore, a definite radar horizon.
DIFFRACTION
Diffraction is the bending of a wave as it passes an obstruction. Because
of diffraction there is some illumination of the region behind an obstruction
or target by the radar beam. Diffraction effects are greater at the lower
frequencies. Thus, the radar beam of a lower frequency radar tends to
illuminate more of the shadow region behind an obstruction than the beam of
radar of higher frequency or shorter wavelength.
REFRACTION
Refraction affects the range at which objects are detected. The
phenomenon of refraction should be well-known to every navigation officer.
Refraction takes place when the velocity of the wave is changed. This can
happen when the wave front passes the boundary of two substances of
differing densities. One substance offers more resistance to the wave than the
other and therefore the velocity of the wave will change. Like light rays,
radar rays are subject to bending or refraction in the atmosphere resulting
from travel through regions of different density. However, radar rays are
refracted slightly more than light rays because of the frequencies used. If the
radar waves actually traveled in straight lines or rays, the distance to the
horizon grazed by these rays would be dependent only on the height of the
antenna, assuming adequate power for the rays to reach this horizon.
Without the effects of refraction, the distance to the RADAR HORIZON
would be the same as that of the geometrical horizon for the antenna height.
Standard Atmospheric Conditions
The distance to the radar horizon, ignoring refraction can be expressed in
the following formula. Where h is the height of the antenna in feet, the
distance, d, to the radar horizon in nautical miles, assuming standard
atmospheric conditions, may be found as follows:
With the distances to the geometrical or ordinary horizon being 1.06
and the distance to the visible or optical horizon being 1.15 . We see that
the range of the radar horizon is greater than that of the optical horizon,
which again is greater than that of the geometrical horizon. Thus, like light
rays in the standard atmosphere, radar rays are bent or refracted slightly
downwards approximating the curvature of the earth (see figure 1.7).
The distance to the radar horizon does not in itself limit the distance from
which echoes may be received from targets. Assuming that adequate power
is transmitted, echoes may be received from targets beyond the radar horizon
if their reflecting surfaces extend above it. Note that the distance to the radar
horizon is the distance at which the radar rays graze the surface of the earth.
In the preceding discussion standard atmospheric conditions were
assumed. The standard atmosphere is a hypothetical vertical distribution of
atmospheric temperature, pressure, and density which is taken to be
representative of the atmosphere for various purposes.
Standard conditions are precisely defined as follows:
Figure 1.7 - Refraction.
d 1.22 h
=
h
h
10
Pressure = 1013 mb decreasing at 36 mb/1000 ft of height
Temperature = 15˚C decreasing at 2˚C/1000 ft of height
Relative Humidity = 60% and constant with height.
These conditions give a refractive index of 1.00325 which decreases at
0.00013 units/1000 ft of height. The definition of “standard” conditions
relates to the vertical composition of the atmosphere. Mariners may not be
able to obtain a precise knowledge of this and so must rely on a more general
appreciation of the weather conditions, the area of the world, and of the time
of the year.
While the atmospheric conditions at any one locality during a given
season may differ considerably from standard atmospheric conditions, the
slightly downward bending of the light and radar rays may be described as
the typical case.
While the formula for the distance to the radar horizon
is based upon a wavelength of 3cm, this formula may be
used in the computation of the distance to the radar horizon for other
wavelengths used with navigational radar. The value so determined should
be considered only as an approximate value because the mariner generally
has no means of knowing what actual refraction conditions exist.
Sub-refraction
The distance to the radar horizon is reduced. This condition is not as
common as super-refraction. Sub-refraction can occur in polar regions where
Arctic winds blow over water where a warm current is prevalent. If a layer of
cold, moist air overrides a shallow layer of warm, dry air, a condition known
as SUB-REFRACTION may occur (see figure 1.8). The effect of sub-
refraction is to bend the radar rays upward and thus decrease the maximum
ranges at which targets may be detected.
Sub-refraction also affects minimum ranges and may result in failure to
detect low lying targets at short range. It is important to note that sub-
refraction may involve an element of danger to shipping where small vessels
and ice may go undetected. The officer in charge of the watch should be
especially mindful of this condition and extra precautions be administered
such as a reduction in speed and the posting of extra lookouts.
Super-refraction
The distance to the radar horizon is extended. In calm weather with no
turbulence when there is an upper layer of warm, dry air over a surface layer
of cold, moist air, a condition known as SUPER-REFRACTION may occur
(see figure 1.9). For this condition to exist, the weather must be calm with
little or no turbulence, otherwise the layers of different densities will mix
and the boundary conditions disappear. The effect of super-refraction will
increase the downward bending of the radar rays and thus increase the ranges
at which targets may be detected. Super-refraction frequently occurs in the
tropics when a warm land breeze blows over cooler ocean currents. It is
especially noticeable on the longer range scales.
d
( 1.22 h)
=
Figure 1.8 - Sub-refraction.
Figure 1.9 - Super-refraction.
11
Extra Super-refraction or Ducting
Most radar operators are aware that at certain times they are able to detect
targets at extremely long ranges, but at other times they cannot detect targets
within visual ranges, even though their radars may be in top operating
condition in both instances.
These phenomena occur during extreme cases of super-refraction. Energy
radiated at angles of 1˚ or less may be trapped in a layer of the atmosphere
called a SURFACE RADIO DUCT. In the surface radio duct illustrated in
figure 1.10, the radar rays are refracted downward to the surface of the sea,
reflected upward, refracted downward again within the duct, and so on
continuously.
The energy trapped by the duct suffers little loss; thus, targets may be
detected at exceptionally long ranges. Surface targets have been detected at
ranges in excess of 1,400 miles with relatively low-powered equipment.
There is a great loss in the energy of the rays escaping the duct, thus
reducing the chances for detection of targets above the duct.
Ducting sometimes reduces the effective radar range. If the antenna is
below a duct, it is improbable that targets above the duct will be detected. In
instances of extremely low-level ducts when the antenna is above the duct,
surface targets lying below the duct may not be detected. The latter situation
does not occur very often.
Ducting Areas
Although ducting conditions can happen any place in the world, the
climate and weather in some areas make their occurrence more likely. In
some parts of the world, particularly those having a monsoonal climate,
variation in the degree of ducting is mainly seasonal, and great changes from
day to day may not take place. In other parts of the world, especially those in
which low barometric pressure areas recur often, the extent of nonstandard
propagation conditions varies considerably from day to day.
Figure 1.11 illustrates the different places in the world where known
ducting occurs frequently. Refer to the map to see their location in relation to
the climate that exists in each area during different seasons of the year.
Atlantic Coast of the United States (Area 1). Ducting is common in
summer along the northern part of the coast, but in the Florida region the
seasonal trend is the reverse, with a maximum in the winter season.
Western Europe (Area 2). A pronounced maximum of ducting conditions
exists in the summer months on the eastern side of the Atlantic around the
British Isles and in the North Sea.
Mediterranean Region (Area 3). Available reports indicate that the
seasonal variation in the Mediterranean region is very marked, with ducting
more or less the rule in summer. Conditions are approximately standard in
winter. Ducting in the central Mediterranean area is caused by the flow of
warm, dry air from the south, which moves across the sea and thus provides
an excellent opportunity for the formation of ducts. In winter, however, the
climate in the central Mediterranean is more or less the same as Atlantic
conditions, therefore not favorable for duct formation.
Arabian Sea (Area 4). The dominating meteorological factor in the Arabian
Sea region is the southwest monsoon, which blows from early June to mid-
September and covers the whole Arabian Sea with moist-equatorial air up to
considerable heights. When this meteorological situation is developed fully, no
occurrence of ducting is to be expected. During the dry season, on the other
hand, conditions are different. Ducting then is the rule, not the exception, and on
some occasions extremely long ranges (up to 1,500 miles) have been observed
on fixed targets.
When the southwest monsoon begins early in June, ducting disappears on
the Indian side of the Arabian Sea. Along the western coasts, however,
conditions favoring ducting may still linger. The Strait of Hormuz (Persian
Gulf) is particularly interesting as the monsoon there has to contend with the
shamal (a northwesterly wind) over Iraq and the Persian Gulf from the north.
The strait itself lies at the boundary between the two wind systems; a front is
formed with the warm, dry shamal on top and the colder, humid monsoon
underneath. Consequently, conditions are favorable for the formation of an
extensive duct, which is of great importance to radar operation in the Strait
of Hormuz.
Bay of Bengal (Area 5). The seasonal trend of ducting conditions in the
Bay of Bengal is the same as in the Arabian Sea, with standard conditions
during the summer southwest monsoon. Ducting is found during the dry
season.
Figure 1.10 - Ducting.
12
Figure 1.11 - Ducting areas.
13
Pacific Ocean (Area 6). Frequent occurrences of ducting around
Guadalcanal, the east coast of Australia, and around New Guinea and Korea
have been experienced. Observations along the Pacific coast of the United
States indicate frequent ducting, but no clear indication of its seasonal trend
is available. Meteorological conditions in the Yellow Sea and Sea of Japan,
including the island of Honshu, are approximately like those of the
northeastern coast of the United States. Therefore, ducting in this area
should be common in the summer. Conditions in the South China Sea
approximate those off the southeastern coast of the United States only during
the winter months, when ducting can be expected. During the rest of the
year, the Asiatic monsoon modifies the climate in this area, but no
information is available on the prevalence of ducting during this time. Trade
winds in the Pacific quite generally lead to the formation of rather low ducts
over the open ocean.
WEATHER FACTORS AFFECTING THE RADAR HORIZON
The usual effects of weather are to reduce the ranges at which targets can
be detected and to produce unwanted echoes on the radarscope which may
obscure the returns from important targets or from targets which may be
dangerous to one’s ship. The reduction of intensity of the wave experienced
along its path is known as attenuation.
Attenuation is caused by the absorption and scattering of energy by the
various forms of precipitation. The amount of attenuation caused by each of
the various factors depends to a substantial degree on the radar wavelength.
It causes a decrease in echo strength. Attenuation is greater at the higher
frequencies or shorter wavelengths.
Attenuation by rain, fog, clouds, hail, snow, and dust
The amount of attenuation caused by these weather factors is dependent
upon the amount of water, liquid or frozen, present in a unit volume of air
and upon the temperature. Therefore, as one would expect, the affects can
differ widely. The further the radar wave and returning echo must travel
through this medium then the greater will be the attenuation and subsequent
decrease in detection range. This is the case whether the target is in or
outside the precipitation. A certain amount of attenuation takes place even
when radar waves travel through a clear atmosphere. The affect will not be
noticeable to the radar observer. The effect of precipitation starts to become
of practical significance at wavelengths shorter than 10cm. In any given set
of precipitation conditions, the (S-band) or 10cm will suffer less attenuation
than the (X-band) or 3cm.
Rain
In the case of rain the particles which affect the scattering and attenuation
take the form of water droplets. It is possible to relate the amount of
attenuation to the rate of precipitation. If the size of the droplet is an
appreciable proportion of the 3cm wavelength, strong clutter echoes will be
produced and there will be serious loss of energy due to scattering and
attenuation. If the target is within the area of rainfall, any echoes from
raindrops will further decrease its detection range. Weaker target responses,
as from small vessels and buoys, will be undetectable if their echoes are not
stronger than that of the rain. A very heavy rainstorm, like those sometimes
encountered in the tropics, can obliterate most of the (X-band) radar picture.
Continuous rainfall over a large area will make the center part of the
screen brighter than the rest and the rain clutter, moving along with the ship,
looks similar to sea clutter. It can be clearly seen on long range scales. This
is due to a gradual decrease in returning power as the pulse penetrates further
into the rain area.
Fog
In most cases fog does not actually produce echoes on the radar display,
but a very dense fogbank which arises in polar regions may produce a
significant reduction in detection range.
A vessel encountering areas known for industrial pollution in the form of
smog may find a somewhat higher degree of attenuation than sea fog.
14
Clouds
The water droplets which form clouds are too small to produce a
detectable response at the 3cm wavelength. If there is precipitation in the
cloud then the operator can expect a detectable echo.
Hail
With respect to water, hail which is essentially frozen rain reflects radar
energy less effectively than water. Therefore, in general the clutter and
attenuation from hail are likely to prove less detectable than that from rain.
Snow
Similar to the effects of hail, the overall effect of clutter on the picture is
less than that due to rain. Falling snow will only be observed on the displays
of 3cm except during heavy snowfall where attenuation can be observed on a
10cm set.
The strength of echoes from snow depends upon the size of the snowflake
and the rate of precipitation. For practical purposes, however, the significant
factor is the rate of precipitation, because the water content of the heaviest
snowfall will very rarely equal that of even moderate rain.
It is important to keep in mind that in areas receiving and collecting
snowfall and where the snow is collecting on possible danger targets it may
render them less detectable. Accumulation of snow produces a limited
absorption characteristic and reduces the detection range of an otherwise
strong target.
Dust
There is a general reduction in radar detection in the presence of dust and
sandstorms. On the basis of particle size, detectable responses are extremely
unlikely and the operator can expect a low level of attenuation.
Unusual Propagation Conditions
Similar to light waves, radar waves going through the earth’s atmosphere
are subject to refraction and normally bend slightly with the curvature of the
earth. Certain atmospheric conditions will produce a modification of this
normal refraction.
15
A BASIC RADAR SYSTEM
RADAR SYSTEM CONSTANTS
Before describing the functions of the components of a marine radar, there are
certain constants associated with any radar system that will be discussed. These
are carrier frequency, pulse repetition frequency, pulse length, and power
relation. The choice of these constants for a particular system is determined by
its operational use, the accuracy required, the range to be covered, the practical
physical size, and the problems of generating and receiving the signals.
Carrier Frequency
The carrier frequency is the frequency at which the radio-frequency
energy is generated. The principal factors influencing the selection of the
carrier frequency are the desired directivity and the generation and reception
of the necessary microwave radio-frequency energy.
For the determination of direction and for the concentration of the
transmitted energy so that a greater portion of it is useful, the antenna should
be highly directive. The higher the carrier frequency, the shorter the
wavelength and hence the smaller is the antenna required for a given
sharpness of the pattern of radiated energy.
The problem of generating and amplifying reasonable amounts of radio-
frequency energy at extremely high frequencies is complicated by the
physical construction of the tubes to be used. The common tube becomes
impractical for certain functions and must be replaced by tubes of special
design. Among these are the klystron and magnetron.
Since it is very difficult to amplify the radio-frequency echoes of the
carrier wave, radio-frequency amplifiers are not used. Instead, the frequency
of the incoming signals (echoes) is mixed (heterodyned) with that of a local
oscillator in a crystal mixer to produce a difference frequency called the
intermediate frequency. This intermediate frequency is low enough to be
amplified in suitable intermediate frequency amplifier stages in the receiver.
Pulse Repetition Frequency
The Pulse Repetition Frequency (PRF), sometimes referred to as Pulse
Repetition Rate (PRR) is the number of pulses transmitted per second. Some
characteristic values may be 600, 1000, 1500, 2200 and 3000 pulses per
second. The majority of modern marine radars operate within a range of 400
to 4000 pulses per second.
If the distance to a target is to be determined by measuring the time
required for one pulse to travel to the target and return as a reflected echo, it
is necessary that this cycle be completed before the pulse immediately
following is transmitted. This is the reason why the transmitted pulses must
be separated by relatively long nontransmitting time periods. Otherwise,
transmission would occur during reception of the reflected echo of the
preceding pulse. Using the same antenna for both transmitting and receiving,
the relatively weak reflected echo would be blocked by the relatively strong
transmitted pulse.
Sufficient time must be allowed between each transmitted pulse for an
echo to return from any target located within the maximum workable range
of the system. Otherwise, the reception of the echoes from the more distant
targets would be blocked by succeeding transmitted pulses. The maximum
measurable range of a radar set depends upon the peak power in relation to
the pulse repetition rate. Assuming sufficient power is radiated, the
maximum range at which echoes can be received may be increased through
lowering the pulse repetition rate to provide more time between transmitted
pulses. The PRR must be high enough so that sufficient pulses hit the target
and enough are returned to detect the target. The maximum measurable
range, assuming that the echoes are strong enough for detection, can be
determined by dividing 80,915 (radar nautical miles per second) by the PRR.
With the antenna being rotated, the beam of energy strikes a target for a
relatively short time. During this time, a sufficient number of pulses must be
transmitted in order to receive sufficient echoes to produce the necessary
indication on the radarscope. With the antenna rotating at 15 revolutions per
minute, a radar set having a PRR of 800 pulses per second will produce
approximately 9 pulses for each degree of antenna rotation. The
PERSISTENCE of the radarscope, i.e., a measure of the time it retains
images of echoes, and the rotational speed of the antenna, therefore,
determine the lowest PRR that can be used.
Pulse Length
Pulse length is defined as the duration of the transmitted radar pulse and is
usually measured in microseconds.
The minimum range at which a target can be detected is determined
largely by the pulse length. If a target is so close to the transmitter that the
echo is returned to the receiver before the transmission stops, the reception
16
of the echo, obviously, will be masked by the transmitted pulse. For
example, a radar set having a pulse length of 1 microsecond will have a
minimum range of 164 yards. This means that the echo of a target within this
range will not be seen on the radarscope because of being masked by the
transmitted pulse.
Since the radio-frequency energy travels at a speed of 161,829 nautical
miles per second or 161,829 nautical miles in one million microseconds, the
distance the energy travels in 1 microsecond is approximately 0.162 nautical
mile or 328 yards. Because the energy must make a round trip, the target
cannot be closer than 164 yards if its echo is to be seen on the radarscope
while using a pulse length of 1 microsecond. Consequently, relatively short
pulse lengths, about 0.1 microsecond, must be used for close-in ranging.
Many radar sets are designed for operation with both short and long pulse
lengths. Many of these radar sets are shifted automatically to the shorter
pulse length on selecting the shorter range scales. On the other radar sets, the
operator must select the radar pulse length in accordance with the operating
conditions. Radar sets have greater range capabilities while functioning with
the longer pulse length because a greater amount of energy is transmitted in
each pulse.
While maximum detection range capability is sacrificed when using the
shorter pulse length, better range accuracy and range resolution are obtained.
With the shorter pulse, better definition of the target on the radar-scope is
obtained; therefore, range accuracy is better. RANGE RESOLUTION is a
measure of the capability of a radar set to detect the separation between
those targets on the same bearing but having small differences in range. If
the leading edge of a pulse strikes a target at a slightly greater range while
the trailing part of the pulse is still striking a closer target, it is obvious that
the reflected echoes of the two targets will appear as a single elongated
image on the radarscope.
Power Relation
The useful power of the transmitter is that contained in the radiated pulses
and is called the PEAK POWER of the system. Power is normally measured
as an average value over a relatively long period of time. Because the radar
transmitter is resting for a time that is long with respect to the operating
time, the average power delivered during one cycle of operation is relatively
low compared with the peak power available during the pulse time.
A definite relationship exists between the average power dissipated over
an extended period of time and the peak power developed during the pulse
time.
The PULSE REPETITION TIME, or the overall time of one cycle of
operation, is the reciprocal of the pulse repetition rate (PRR). Other factors
remaining constant, the longer the pulse length, the higher will be the
average power; the longer the pulse repetition time, the lower will be the
average power.
These general relationships are shown in figure 1.12.
The operating cycle of the radar transmitter can be described in terms of
the fraction of the total time that radio-frequency energy is radiated. This
time relationship is called the DUTY CYCLE and may be represented as
follows:
For a radar having a pulse length of 2 microseconds and a pulse repetition
rate of 500 cycles per second (pulse repetition time = 2,000 microseconds),
the
Figure 1.12 - Relationship of peak and average power.
average power
peak power
-----------------------------------------
pulse length
pulse repetition time
------------------------------------------------------------
-
=
duty cycle
pulse length
pulse repetition time
------------------------------------------------------------
-
=
duty cycle
2µsec
2 000 µsec
,
-------------------------- 0.001
= =
17
Likewise, the ratio between the average power and peak power may be
expressed in terms of the duty cycle.
In the foregoing example assume that the peak power is 200 kilowatts.
Therefore, for a period of 2 microseconds a peak power of 200 kilowatts is
supplied to the antenna, while for the remaining 1998 microseconds the
transmitter output is zero. Because average power is equal to peak power times
the duty cycle,
High peak power is desirable in order to produce a strong echo over the
maximum range of the equipment. Low average power enables the
transmitter tubes and circuit components to be made smaller and more
compact. Thus, it is advantageous to have a low duty cycle. The peak power
that can be developed is dependent upon the interrelation between peak and
average power, pulse length, and pulse repetition time, or duty cycle.
COMPONENTS AND SUMMARY OF FUNCTIONS
While pulse-modulated radar systems vary greatly in detail, the principles
of operation are essentially the same for all systems. Thus, a single basic
radar system can be visualized in which the functional requirements are
essentially the same as for all specific equipments.
The functional breakdown of a basic pulse-modulated radar system
usually includes six major components, as shown in the block diagram,
figure 1.13. The functions of the components may be summarized as
follows:
The power supply furnishes all AC and DC voltages necessary for the
operation of the system components.
The modulator produces the synchronizing signals that trigger the
transmitter the required number of times per second. It also triggers the
indicator sweep and coordinates the other associated circuits.
The transmitter generates the radio-frequency energy in the form of short
powerful pulses.
The antenna system takes the radio-frequency energy from the transmitter,
radiates it in a highly directional beam, receives any returning echoes, and
passes these echoes to the receiver.
The receiver amplifies the weak radio-frequency pulses (echoes) returned
by a target and reproduces them as video pulses passed to the indicator.
The indicator produces a visual indication of the echo pulses in a manner
that furnishes the desired information.
duty cycle
average power
peak power
-----------------------------------------
=
average power 200 kw x 0.001 0.2 kilowatt
= =
Figure 1.13 - Block diagram of a basic pulse-modulated radar system
18
FUNCTIONS OF COMPONENTS
Power Supply
In figure 1.13 the power supply is represented as a single block.
Functionally, this block is representative. However, it is unlikely that any one
supply source could meet all the power requirements of a radar set. The
distribution of the physical components of a system may be such as to make
it impractical to group the power-supply circuits into a single physical unit.
Different supplies are needed to meet the varying requirements of a system
and must be designed accordingly. The power supply function is performed
by various types of power supplies distributed among the circuit components
of a radar set.
In figure 1.14 the modulator, transmitter, and receiver are contained in the
same chassis. In this arrangement, the group of components is called a
TRANSCEIVER. (The term transceiver is an acronym composed from the
words TRANSmitter and reCEIVER.)
Modulator
The function of the modulator is to insure that all circuits connected with the
radar system operate in a definite time relationship with each other and that the
time interval between pulses is of the proper length. The modulator
simultaneously sends a synchronizing signal to trigger the transmitter and the
indicator sweep. This establishes a control for the pulse repetition rate (PRR) and
provides a reference for the timing of the travel of a transmitted pulse to a target
and its return as an echo.
Transmitter
The transmitter is basically an oscillator which generates radio-frequency
(r-f) energy in the form of short powerful pulses as a result of being turned
on and off by the triggering signals from the modulator. Because of the
frequencies and power outputs required, the transmitter oscillator is a special
type known as a MAGNETRON.
Transmitting and Receiving Antenna System
The function of the antenna system is to take the r-f energy from the
transmitter, radiate this energy in a highly directional beam, receive any
echoes or reflections of transmitted pulses from targets, and pass these
echoes to the receiver.
In carrying out this function the r-f pulses generated in the transmitter are
conducted to a FEEDHORN at the focal point of a directional reflector, from
which the energy is radiated in a highly directional pattern. The transmitted
and reflected energy (returned by the same dual purpose reflector) are
conducted by a common path.
This common path is an electrical conductor known as a WAVEGUIDE.
A waveguide is hollow copper tubing, usually rectangular in cross section,
having dimensions according to the wavelength or the carrier frequency, i.e.,
the frequency of the oscillations within the transmitted pulse or echo.
Because of this use of a common waveguide, an electronic switch, a
TRANSMIT-RECEIVE (TR) TUBE capable of rapidly switching from
transmit to receive functions, and vice versa, must be utilized to protect the
receiver from damage by the potent energy generated by the transmitter. The
TR tube, as shown in figure 1.14 blocks the transmitter pulses from the
receiver. During the relatively long periods when the transmitter is inactive,
the TR tube permits the returning echoes to pass to the receiver. To prevent
any of the very weak echoes from being absorbed by the transmitter, another
device known as an ANTI-TR (A-TR) TUBE is used to block the passage of
these echoes to the transmitter.
19
Figure 1.14 - A basic radar system.
20
The feedhorn at the upper extremity of the waveguide directs the
transmitted energy towards the reflector, which focuses this energy into a
narrow beam. Any returning echoes are focused by the reflector and directed
toward the feedhorn. The echoes pass through both the feedhorn and
waveguide enroute to the receiver. The principles of a parabolic reflector are
illustrated in figure 1.15.
Since the r-f energy is transmitted in a narrow beam, particularly narrow
in its horizontal dimension, provision must be made for directing this beam
towards a target so that its range and bearing may be measured. Normally,
this is accomplished through continuous rotation of the radar beam at a rate
of about 10 to 20 revolutions per minute so that it will impinge upon any
targets which might be in its path. Therefore, in this basic radar system the
upper portion of the waveguide, including the feedhorn, and the reflector are
constructed so that they can be rotated in the horizontal plane by a drive
motor. This rotatable antenna and reflector assembly is called the
SCANNER.
Figure 1.16 illustrates a SLOTTED WAVEGUIDE ANTENNA and notice
that there is no reflector or feedhorn. The last few feet of the waveguide is
constructed so that it can be rotated in the horizontal plane. The forward and
narrower face of the rotatable waveguide section contains a series of slots
from which the r-f energy is emitted to form a narrow radar beam. Returning
echoes also pass through these slots and then pass through the waveguide to
the receiver.
Receiver
The function of the receiver is to amplify or increase the strength of the
very weak r-f echoes and reproduce them as video signals to be passed to the
indicator. The receiver contains a crystal mixer and intermediate frequency
amplification stages required for producing video signals used by the
indicator.
Figure 1.15 - Principles of a parabolic reflector.
Figure 1.16 - Slotted waveguide antenna.
21
Indicator
The primary function of the indicator is to provide a visual display of the
ranges and bearings of radar targets from which echoes are received. In this
basic radar system, the type of display used is the PLAN POSITION
INDICATOR (PPI), which is essentially a polar diagram, with the
transmitting ship’s position at the center. Images of target echoes are
received and displayed at either their relative or true bearings, and at their
distances from the PPI center. With a continuous display of the images of the
targets, the motion of the target relative to the motion of the transmitting ship
is also displayed.
The secondary function of the indicator is to provide the means for
operating various controls of the radar system.
The CATHODE-RAY TUBE (CRT), illustrated in figure 1.17, is the heart
of the indicator. The CRT face or screen, which is coated with a film of
phosphorescent material, is the PPI. The ELECTRON GUN at the opposite
end of the tube (see figure 1.18) emits a very narrow beam of electrons
which impinges upon the center of the PPI unless deflected by electrostatic
or electromagnetic means. Since the inside face of the PPI is coated with
phosphorescent material, a small bright spot is formed at the center of the
PPI.
If the electron beam is rapidly and repeatedly deflected radially from the
center, a bright line called a TRACE is formed on the PPI. Should the flow of
electrons be stopped, this trace will continue to glow for a short period
following the stoppage of the electron beam because of the phosphorescent
coating. The slow decay of the brightness is known as PERSISTENCE; the
slower the decay the higher the persistence.
At the instant the modulator triggers the transmitter, it sends a TIMING
TRIGGER signal to the indicator. The latter signal acts to deflect the
electron beam radially from the center of the CRT screen (PPI) to form a
trace of the radial movement of the electron beam. This radial movement of
the electron beam is called the SWEEP or TIME BASE. While the terms
trace and sweep are frequently used interchangeably, the term trace is
descriptive only of the visible evidence of the sweep movement.
Since the electron beam is deflected from the center of the CRT screen
with each pulse of the transmitter, the sweep must be repeated very rapidly
even when the lower pulse repetition rates are used. With a pulse repetition
rate of 750 pulses per second, the sweep must be repeated 750 times per
second. Thus, it should be quite obvious why the sweep appears as a solid
luminous line on the PPI. The speed of movement of the point of
impingement of the electron beam is far in excess of the capability of
detection by the human eye.
While the sweep must be repeated in accordance with the PRR, the actual
rate of radial movement of the electron beam is governed by the size of the
CRT screen and the distance represented by the radius of this screen
according to the range scale being used. If the 20-mile range scale is
selected, the electron beam must be deflected radially from the center of the
CRT screen having a particular radius at a rate corresponding to the time
required for radio-frequency energy to travel twice the distance of the range
scale or 40 nautical miles. When using the 20-mile range scale, the electron
beam must move radially from the center of the CRT screen to its periphery
in 247 microseconds.
Speed of radio frequency - frequency energy =
0.161829 nm per microsecond
Distance = Speed X Time
40 nm ÷ 0.161829 nm per microsecond =
247 microseconds
The objective of regulating the rate of travel of the electron beam in this
manner is to establish a time base on the PPI which may be used for direct
measurements of distances to targets without further need to take into
Figure 1.17 - Electromagnetic cathode-ray tube.
22
account the fact that the transmitted pulse and its reflected echo make a
round trip to and from the target. With the periphery of the PPI representing
a distance of 20 miles from the center of the PPI at the 20-mile range scale
setting, the time required for the electron beam to move radially from the
center to the periphery is the same as the time required for the transmitted
pulse to travel to a target at 20 miles and return to the antenna as a reflected
echo or the time to travel 40 miles in this case. It follows that a point on the
sweep or time base halfway between the center of the PPI and its periphery
Figure 1.18 - The sweep on the plan position indicator.
23
represents a distance of 10 miles from the center of the PPI. The foregoing
assumes that the rate of travel of the electron beam is constant, which is the
usual case in the design of indicators for navigational radar.
If the antenna is trained on a target at 10 miles while using the 20-mile
range scale, the time for the 20-mile round trip of the transmitted pulse and
the returning echo is 123.5 microseconds. At 123.5 microseconds, following
the instant of triggering the transmitter and sending the timing trigger pulse
to the indicator to deflect the electron beam radially, the electron beam will
have moved a distance of 10 miles in its sweep or on the time base. On
receiving the echo at 123.5 microseconds after the instant of the pulse, the
receiver sends a video signal to the indicator which in turn acts to intensify
or brighten the electron beam at the point in its sweep at 123.5
microseconds, i.e., at 10 miles on the time base. This brightening of the trace
produced by the sweep at the point corresponding to the distance to the
target in conjunction with the persistence of the PPI produces a visible image
of the target. Because of the pulse repetition rate, this painting of an image
on the PPI is repeated many times in a short period, resulting in a steady
glow of the target image if the target is a reasonably good reflector.
In navigational and collision avoidance applications of radar, the antenna
and the beam of r-f energy radiated from it are rotated at a constant rate,
usually about 10 to 20 revolutions per minute in order to detect targets all
around the observer’s ship. In the preceding discussion of how a target image
is painted on the PPI, reference is made only to radial deflection of the
electron beam to produce the sweep or time base. If target images are to be
painted at their relative bearings as well as distances from the center of the
PPI, the sweep must be rotated in synchronization with the rotation of the
antenna. Just as the electron beam may be deflected radially by electrostatic
or electromagnetic means, the sweep may be rotated by the same means. The
sweep is usually rotated electromagnetically in modern radars.
As the antenna is rotated past the ship’s heading, the sweep, in
synchronization with the antenna, is rotated past the 0˚ graduation on the
relative bearing dial of the PPI. The image of any target detected ahead is
painted on the PPI at its relative bearing and distance from the center of
the PPI. As targets are detected in other directions, their images are
painted on the PPI at their relative bearings and distances from the center
of the PPI.
Up to this point the discussion of how target information is displayed on
the PPI has been limited to how the target images are painted, virtually
instantaneously, at their distances and relative bearings from the reference
ship at the center of the PPI. It follows that through continuous display
(continuous because of the persistence of the CRT screen and the pulse
repetition rate) of the positions of targets on the PPI, their motions relative to
the motion of the reference ship are also displayed.
In summary, the indicator of this basic radar system provides the means
for measuring and displaying, in a useful form, the relative bearings and
distances to targets from which reflected echoes may be received. In
displaying the positions of the targets relative to the reference ship
continuously, the motions of the targets relative to the motion of the
reference ship are evident.
24
FACTORS AFFECTING DETECTION, DISPLAY, AND MEASUREMENT OF RADAR TARGETS
FACTORS AFFECTING MAXIMUM RANGE
Frequency
The higher the frequency of a radar (radio) wave, the greater is the
attenuation (loss in power), regardless of weather. Lower radar frequencies
(longer wavelengths) have, therefore, been generally superior for longer
detection ranges.
Peak Power
The peak power of a radar is its useful power. Range capabilities of the
radar increase with peak power. Doubling the peak power increases the
range capabilities by about 25 percent.
Pulse Length
The longer the pulse length, the greater is the range capability of the radar
because of the greater amount of energy transmitted.
Pulse Repetition Rate
The pulse repetition rate (PRR) determines the maximum measurable
range of the radar. Ample time must be allowed between pulses for an echo
to return from any target located within the maximum workable range of the
system. Otherwise, echoes returning from the more distant targets are
blocked by succeeding transmitted pulses. This necessary time interval
determines the highest PRR that can be used.
The PRR must be high enough, however, that sufficient pulses hit the
target and enough echoes are returned to the radar. The maximum
measurable range can be determined approximately by dividing 81,000 by
the PRR.
Beam Width
The more concentrated the beam, the greater is the detection range of the
radar.
Target Characteristics
Targets that are large can be seen on the scope at greater ranges, provided
line-of-sight exists between the radar antenna and the target. Conducting
materials (a ship’s steel hull, for example) return relatively strong echoes
while nonconducting materials (a wood hull of a fishing boat, for example)
return much weaker echoes.
Receiver Sensitivity
The more sensitive receivers provide greater detection ranges but are more
subject to jamming.
Antenna Rotation Rate
The more slowly the antenna rotates, the greater is the detection range of
the radar.
For a radar set having a PRR of 1,000 pulses per second, a horizontal
beam width of 2.0˚, and an antenna rotation rate of 6 RPM (1 revolution in
10 seconds or 36 scanning degrees per second), there is 1 pulse transmitted
each 0.036˚ of rotation. There are 56 pulses transmitted during the time
required for the antenna to rotate through its beam width.
With an antenna rotation rate of 15 RPM (1 revolution in 4 seconds or 90
scanning degrees per second), there is only 1 pulse transmitted each 0.090˚
of rotation. There are only 22 pulses transmitted during the time required for
the antenna to rotate through its beam width.
From the foregoing it is apparent that at the higher antenna rotation rates,
the maximum ranges at which targets, particularly small targets, may be
detected are reduced.
Beam Width
Degrees per Pulse
-----------------------------------------------------
2.0°
0.036°
---------------
- 56 pulses
= =
Beam Width
Degrees per Pulse
-----------------------------------------------------
2.0°
0.090°
---------------
- 22
= = pulses
25
FACTORS AFFECTING MINIMUM RANGE
Pulse Length
The minimum range capability of a radar is determined primarily by the
pulse length. It is equal to half the pulse length of the radar (164 yards per
microsecond of pulse length). Electronic considerations such as the recovery
time of the receiver and the duplexer (TR and anti-TR tubes assembly)
extend the minimum range at which a target can be detected beyond the
range determined by the pulse length.
Sea Return
Sea return or echoes received from waves may clutter the indicator within
and beyond the minimum range established by the pulse length and recovery
time.
Side-Lobe Echoes
Targets detected by the side-lobes of the antenna beam pattern are called
side-lobe echoes. When operating near land or large targets, side-lobe echoes
may clutter the indicator and prevent detection of close targets, without
regard to the direction in which the antenna is trained.
Vertical Beam Width
Small surface targets may escape the lower edge of the vertical beam
when close.
FACTORS AFFECTING RANGE ACCURACY
The range accuracy of radar depends upon the exactness with which the
time interval between the instants of transmitting a pulse and receiving the
echo can be measured.
Fixed Error
A fixed range error is caused by the starting of the sweep on the indicator
before the r-f energy leaves the antenna. The zero reference for all range
measurements must be the leading edge of the transmitted pulse as it appears on
the indicator. Inasmuch as part of the transmitted pulse leaks directly into the
receiver without going to the antenna, a fixed error results from the time required
for r-f energy to go up to the antenna and return to the receiver. This error causes
the indicated ranges to be greater than their true values.
A device called a trigger delay circuit is used to eliminate the fixed error.
By this means the trigger pulse to the indicator can be delayed a small
amount. Such a delay results in the sweep starting at the instant an echo
would return to the indicator from a flat plate right at the antenna not at the
instant that the pulse is generated in the transmitter.
Line Voltage
Accuracy of range measurement depends on the constancy of the line
voltage supplied to the radar equipment. If supply voltage varies from its
nominal value, ranges indicated on the radar may be unreliable. This
fluctuation usually happens only momentarily, however, and after a short
wait ranges normally are accurate.
Frequency Drift
Errors in ranging also can be caused by slight variations in the frequency
of the oscillator used to divide the sweep (time base) into equal range
intervals. If such a frequency error exists, the ranges read from the radar
generally are in error by some small percentage of the range.
To reduce range errors caused by frequency drift, precision oscillators in
radars usually are placed in a constant temperature oven. The oven is always
heated, so there is no drift of range accuracy while the rest of the set is
warming up.
Calibration
The range to a target can be measured most accurately on the PPI when
the leading edge of its pip just touches a fixed range ring. The accuracy of
this measurement is dependent upon the maximum range of the scale in use.
Representative maximum error in the calibration of the fixed range rings is
75 yards or 11
/2 percent of the maximum range of the range scale in use,
whichever is greater. With the indicator set on the 6-mile range scale, the
error in the range of a pip just touching a range ring may be about 180 yards
or about 0.1 nautical mile because of calibration error alone when the range
calibration is within acceptable limits.
On some PPI’s, range can only be estimated by reference to the fixed
range rings. When the pip lies between the range rings, the estimate is
usually in error by 2 to 3 percent of the maximum range of the range scale
setting plus any error in the calibration of the range rings.
Radar indicators usually have a variable range marker (VRM) or
26
adjustable range ring which is the normal means for range measurements.
With the VRM calibrated with respect to the fixed range rings within a
tolerance of 1 percent of the maximum range of the scale in use, ranges as
measured by the VRM may be in error by as much as 21
/2 percent of the
maximum range of the scale in use. With the indicator set on the 8-mile
range scale, the error in a range as measured by the VRM may be in error by
as much as 0.2 nautical mile.
Pip and VRM Alignment
The accuracy of measuring ranges with the VRM is dependent upon the
ability of the radar observer to align the VRM with the leading edge of the pip on
the PPI. On the longer range scales it is more difficult to align the VRM with the
pip because small changes in the reading of the VRM range counter do not result
in appreciable changes in the position of the VRM on the PPI.
Range Scale
The higher range scale settings result in reduced accuracy of fixed range
ring and VRM measurements because of greater calibration errors and the
greater difficulty of pip and VRM alignment associated with the higher
settings.
PPI Curvature
Because of the curvature of the PPI, particularly in the area near its periphery,
range measurements of pips near the edge are of lesser accuracy than the
measurements nearer the center of the PPI.
Radarscope Interpretation
Relatively large range errors can result from incorrect interpretation of a
landmass image on the PPI. The difficulty of radarscope interpretation can
be reduced through more extensive use of height contours on charts.
For reliable interpretation it is essential that the radar operating controls
be adjusted properly. If the receiver gain is too low, features at or near the
shoreline, which would reflect echoes at a higher gain setting, will not
appear as part of the landmass image. If the receiver gain is too high, the
landmass image on the PPI will “bloom”. With blooming the shoreline will
appear closer than it actually is.
A fine focus adjustment is necessary to obtain a sharp landmass image on
the PPI.
Because of the various factors introducing errors in radar range
measurements, one should not expect the accuracy of navigational radar to
be better than + or - 50 yards under the best conditions.
FACTORS AFFECTING RANGE RESOLUTION
Range resolution is a measure of the capability of a radar to display as
separate pips the echoes received from two targets which are on the same
bearing and are close together.
The principal factors that affect the range resolution of a radar are the
length of the transmitted pulse, receiver gain, CRT spot size, and the range
scale. A high degree of range resolution requires a short pulse, low receiver
gain, and a short range scale.
Pulse Length
Two targets on the same bearing, close together, cannot be seen as two
distinct pips on the PPI unless they are separated by a distance greater than
one-half the pulse length (164 yards per microsecond of pulse length). If a
radar has a pulse length of 1-microsecond duration, the targets would have to
be separated by more than 164 yards before they would appear as two pips
on the PPI.
Radio-frequency energy travels through space at the rate of approximately
328 yards per microsecond. Thus, the end of a 1-microsecond pulse traveling
through the air is 328 yards behind the leading edge, or start, of the pulse. If
a 1-microsecond pulse is sent toward two objects on the same bearing,
separated by 164 yards, the leading edge of the echo from the distant target
coincides in space with the trailing edge of the echo from the near target. As
a result the echoes from the two objects blend into a single pip, and range
can be measured only to the nearest object. The reason for this blending is
illustrated in figure 1.19.
In part A of figure 1.19, the transmitted pulse is just striking the near
target. Part B shows energy being reflected from the near target, while the
leading edge of the transmitted pulse continues toward the far target. In part
C, 1
/2 microsecond later, the transmitted pulse is just striking the far target;
the echo from the near target has traveled 164 yards back toward the antenna.
The reflection process at the near target is only half completed. In part D
echoes are traveling back toward the antenna from both targets. In part E
reflection is completed at the near target. At this time the leading edge of the
echo from the far target coincides with the trailing edge of the first echo.
When the echoes reach the antenna, energy is delivered to the set during a
period of 2 microseconds so that a single pip appears on the PPI.
27
Figure 1.19 - Pulse length and range resolution.
28
The data below indicates the minimum separation in range for two targets
to appear as separate echoes on the PPI for various pulse lengths.
Receiver Gain
Range resolution can be improved by proper adjustment of the receiver
gain control. As illustrated in figure 1.20, the echoes from two targets on the
same bearing may appear as a single pip on the PPI if the receiver gain
setting is too high. With reduction in the receiver gain setting, the echoes
may appear as separate pips on the PPI.
CRT Spot Size
The range separation required for resolution is increased because the spot
formed by the electron beam on the screen of the CRT cannot be focused
into a point of light. The increase in echo image (pip) length and width varies
with the size of the CRT and the range scale in use.
On the longer range scales, the increase in echo size because of spot size
is appreciable.
Range Scale
The pips of two targets separated by a few hundred yards may merge on the
PPI when one of the longer range scales is used. The use of the shortest range
scale possible and proper adjustment of the receiver gain may enable their
detection as separate targets. If the display can be off-centered, this may permit
display of the targets on a shorter range scale than would be possible otherwise.
Pulse Length
(microseconds)
Range Resolution
(yards)
0.05 8
0.10 16
0.20 33
0.25 41
0.5 82
1.2 197
Figure 1.20 - Receiver gain and range resolution.
CRT Diameter
(Inches)
Range Scale
(nautical mi.)
Spot Length or Width
(yards)
Nominal Effective
9 7.5 0.5 5
24 220
12 10.5 0.5 4
24 185
16 14.4 0.5 3
24 134
29
FACTORS AFFECTING BEARING ACCURACY
Horizontal Beam Width
Bearing measurements can be made more accurately with the narrower
horizontal beam widths. The narrower beam widths afford better definition
of the target and, thus, more accurate identification of the center of the target.
Several targets close together may return echoes which produce pips on the
PPI which merge, thus preventing accurate determination of the bearing of a
single target within the group.
The effective beam width can be reduced through lowering the receiver
gain setting. In reducing the sensitivity of the receiver, the maximum
detection range is reduced, but the narrower effective beam width provides
better bearing accuracy.
Target Size
For a specific beam width, bearing measurements of small targets are
more accurate than large targets because the centers of the smaller pips of
the small targets can be identified more accurately.
Target Rate of Movement
The bearings of stationary or slowly moving targets can be measured
more accurately than the bearings of faster moving targets.
Stabilization of Display
Stabilized PPI displays provide higher bearing accuracies than
unstabilized displays because they are not affected by yawing of the ship.
Sweep Centering Error
If the origin of the sweep is not accurately centered on the PPI, bearing
measurements will be in error. Greater bearing errors are incurred when the
pip is near the center of the PPI than when the pip is near the edge of the PPI.
Since there is normally some centering error, more accurate bearing
measurements can be made by changing the range scale to shift the pip
position away from the center of the PPI.
Parallax Error
Improper use of the mechanical bearing cursor will introduce bearing
errors. On setting the cursor to bisect the pip, the cursor should be viewed
from a position directly in front of it. Electronic bearing cursors used with
some stabilized displays provide more accurate bearing measurements than
mechanical bearing cursors because measurements made with the electronic
cursor are not affected by parallax or centering errors.
Heading Flash Alignment
For accurate bearing measurements, the alignment of the heading flash
with the PPI display must be such that radar bearings are in close agreement
with relatively accurate visual bearings observed from near the radar
antenna.
FACTORS AFFECTING BEARING RESOLUTION
Bearing resolution is a measure of the capability of a radar to display as
separate pips the echoes received from two targets which are at the same
range and are close together.
The principal factors that affect the bearing resolution of a radar are
horizontal beam width, the range to the targets, and CRT spot size.
Horizontal Beam Width
As the radar beam is rotated, the painting of a pip on the PPI begins as
soon as the leading edge of the radar beam strikes the target. The painting of
the pip is continued until the trailing edge of the beam is rotated beyond the
target. Therefore, the pip is distorted angularly by an amount equal to the
effective horizontal beam width.
30
As illustrated in figure 1.21, in which a horizontal beam width of 10˚ is
used for graphical clarity only, the actual bearing of a small target having
good reflecting properties is 090˚, but the pip as painted on the PPI extends
from 095˚ to 085˚. The left 5˚ and the right 5˚ are painted while the antenna
is not pointed directly towards the target. The bearing must be read at the
center of the pip.
Figure 1.21 - Angular distortion.
31
Range of Targets
Assuming a more representative horizontal beam width of 2˚, the pip of a
ship 400 feet long observed beam on at a distance of 10 nautical miles on a
bearing of 090˚ would be painted on the PPI between 091.2˚ and 088.8˚, the
actual angular width of the target being 0.4˚. The pip of a ship 900 feet long
observed beam on at the same distance and bearing would be painted on the
PPI between 091.4˚ and 088.6˚, the angular width of the target being 0.8˚.
Since the angular widths of the pips painted for the 400 and 900-foot targets
are 1.4˚ and 1.8˚, respectively, any attempt to estimate target size by the
angular width of the pip is not practical, generally.
Since the pip of a single target as painted on the PPI is elongated
angularly an amount equal to beam width, two targets at the same range must
be separated by more than one beam width to appear as separate pips. The
required distance separation depends upon range. Assuming a 2˚ beam
width, targets at 10 miles must be separated by over 0.35 nautical miles or
700 yards to appear as separate pips on the PPI. At 5 miles the targets must
be separated by over 350 yards to appear as separate pips if the beam width
is 2˚.
Figure 1.22 illustrates a case in which echoes are being received from four
targets, but only three pips are painted on the PPI. Targets A and B are
painted as a single pip because they are not separated by more than one beam
width; targets C and D are painted as separate pips because they are
separated by more than one beam width.
In as much as bearing resolution is determined primarily by horizontal
beam width, a radar with a narrow horizontal beam width provides better
bearing resolution than one with a wide beam.
CRT Spot Size
The bearing separation required for resolution is increased because the
spot formed by the electron beam on the screen of the CRT cannot be
focused into a point of light. The increase in the pip width because of CRT
spot size varies with the size of the CRT and the range scale in use.
WAVELENGTH
Generally, radars transmitting at the shorter wavelengths are more subject
to the effects of weather than radars transmitting at the longer wavelengths.
Figure 1.23 illustrates the PPI displays of two radars of different
wavelengths aboard a ship steaming in a rain squall and a choppy sea.
Without use of anti-rain and anti-sea clutter controls, the clutter is more
massive on the PPI of the radar having the shorter wavelength. Also, three
targets, which can be detected on the PPI of the radar having the longer
wavelength, cannot be detected on the PPI of the radar having the shorter
wavelength. Following use of the anti-rain and anti-sea clutter controls, the
three targets still cannot be detected on the PPI of the radar having the
shorter wavelength because too much of the energy has been absorbed or
attenuated by the rain.
Similarly, figure 1.24 illustrates detection of close targets by a radar
having a relatively long wavelength and no detection of these targets by a
radar having a relatively short wavelength.
Figure 1.22 - Bearing resolution.
32
Two identical 8 mile range PPI pictures taken on Raytheon 3 cm. and 10 cm. radars in a rain squall and with a choppy sea. Three ships bearing
225˚, 294˚ and 330˚ shown on the 10 cm. radar right are not shown on the 3 cm. radar left.
On both radars the anti-rain and anti-sea clutter devices are switched in. The three ships are clearly visible on the 10 cm. radar right. There are no
targets visible on the 3 cm. radar left as the echo power has been absorbed by rain.
Reproduced by Courtesy of the Raytheon Company.
Figure 1.23- Effects of rain and sea on PPI displays of radars having different wavelengths.
33
Two identical 20 mile range PPI pictures taken on Raytheon 3 cm. and 10 cm. radars showing the effects of sea clutter. On the 10 cm. radar right
targets inside the 5 mile range marker are clearly visible. On the 3 cm. radar left the close range targets are missing.
On both radars the anti-sea clutter control has been carefully adjusted to remove sea clutter. The close range targets are clearly visible on the 10
cm. right, whereas they are missing on the 3 cm. radar left.
Reproduced by Courtesy of the Raytheon Company.
Figure 1.24 - Effects of sea on PPI displays of radars having different wavelengths.
34
TARGET CHARACTERISTICS
There are several target characteristics which will enable one target to be
detected at a greater range than another, or for one target to produce a
stronger echo than another target of similar size.
Height
Since radar wave propagation is almost line of sight, the height of the
target is of prime importance. If the target does not rise above the radar
horizon, the radar beam cannot be reflected from the target. Because of the
interference pattern, the target must rise somewhat above the radar horizon.
Size
Up to certain limits, targets having larger reflecting areas will return
stronger echoes than targets having smaller reflecting areas. Should a target
be wider than the horizontal beam width, the strength of the echoes will not
be increased on account of the greater width of the target because the area
not exposed to the radar beam at any instant cannot, of course, reflect an
echo. Since the vertical dimensions of most targets are small compared to the
vertical beam width of marine navigational radars, the beam width limitation
is not normally applicable to the vertical dimensions. However, there is a
vertical dimension limitation in the case of sloping surfaces or stepped
surfaces. In this case, only the projected vertical area lying within the
distance equivalent of the pulse length can return echoes at any instant.
Aspect
The aspect of a target is its orientation to the axis of the radar beam. With
change in aspect, the effective reflecting area may change, depending upon
the shape of the target. The nearer the angle between the reflecting area and
the beam axis is to 90˚, the greater is the strength of the echo returned to the
antenna.
Shape
Targets of identical shape may give echoes of varying strength, depending
on aspect. Thus a flat surface at right angles to the radar beam, such as the
side of a steel ship or a steep cliff along the shore, will reflect very strong
echoes. As the aspect changes, this flat surface will tend to reflect more of
the energy of the beam away from the antenna, and may give rather weak
echoes. A concave surface will tend to focus the radar beam back to the
antenna while a convex surface will tend to scatter the energy. A smooth
conical surface will not reflect energy back to the antenna. However, echoes
may be reflected to the antenna if the conical surface is rough.
Texture
The texture of the target may modify the effects of shape and aspect. A
smooth texture tends to increase the reflection qualities, and will increase the
strength of the reflection, but unless the aspect and shape of the target are
such that the reflection is focused directly back to the antenna, the smooth
surface will give a poor radar echo because most of the energy is reflected in
another direction. On the other hand, a rough surface will tend to break up
the reflection, and will improve the strength of echoes returned from those
targets whose shape and aspect normally give weak echoes.
Composition
The ability of various substances to reflect radar pulses depends on the
intrinsic electrical properties of those substances. Thus metal and water are
good reflectors. Ice is a fair reflector, depending on aspect. Land areas vary
in their reflection qualities depending on the amount and type of vegetation
and the rock and mineral content. Wood and fiber glass boats are poor
reflectors. It must be remembered that all of the characteristics interact with
each other to determine the strength of the radar echo, and no factor can be
singled out without considering the effects of the others.

More Related Content

Similar to Radar Principle

Similar to Radar Principle (20)

ROHINI RADAR PFD
ROHINI RADAR PFDROHINI RADAR PFD
ROHINI RADAR PFD
 
ROHINI RADAR
ROHINI RADARROHINI RADAR
ROHINI RADAR
 
RADAR AND ANTENNA
RADAR AND ANTENNARADAR AND ANTENNA
RADAR AND ANTENNA
 
Radar Basics
Radar BasicsRadar Basics
Radar Basics
 
Radar
RadarRadar
Radar
 
Book 1 “Radar Basics”
Book 1 “Radar Basics”Book 1 “Radar Basics”
Book 1 “Radar Basics”
 
Radar
RadarRadar
Radar
 
R adar
R adarR adar
R adar
 
Radar communication 2
Radar communication 2Radar communication 2
Radar communication 2
 
Radar ece
Radar eceRadar ece
Radar ece
 
Study of Radar System
Study of Radar System Study of Radar System
Study of Radar System
 
CHAPTER 1 PRINCIPLES OF RADAR.pptx
CHAPTER 1 PRINCIPLES OF RADAR.pptxCHAPTER 1 PRINCIPLES OF RADAR.pptx
CHAPTER 1 PRINCIPLES OF RADAR.pptx
 
The radio telescope invention is accredited to Kari Guthe.docx
The radio telescope invention is accredited to Kari Guthe.docxThe radio telescope invention is accredited to Kari Guthe.docx
The radio telescope invention is accredited to Kari Guthe.docx
 
Adhoc module 1 Introduction
Adhoc module 1  IntroductionAdhoc module 1  Introduction
Adhoc module 1 Introduction
 
Introduction to Microwaves,Satellite commn,Radar systemsMicrowaves
Introduction to  Microwaves,Satellite commn,Radar systemsMicrowavesIntroduction to  Microwaves,Satellite commn,Radar systemsMicrowaves
Introduction to Microwaves,Satellite commn,Radar systemsMicrowaves
 
Radar presentation
Radar presentation Radar presentation
Radar presentation
 
Zedrick Khan
Zedrick KhanZedrick Khan
Zedrick Khan
 
Zzed.pdf
Zzed.pdfZzed.pdf
Zzed.pdf
 
Microwave charles
Microwave charlesMicrowave charles
Microwave charles
 
Frequency spectrum
Frequency spectrumFrequency spectrum
Frequency spectrum
 

Recently uploaded

Hierarchy of management that covers different levels of management
Hierarchy of management that covers different levels of managementHierarchy of management that covers different levels of management
Hierarchy of management that covers different levels of managementmkooblal
 
ACC 2024 Chronicles. Cardiology. Exam.pdf
ACC 2024 Chronicles. Cardiology. Exam.pdfACC 2024 Chronicles. Cardiology. Exam.pdf
ACC 2024 Chronicles. Cardiology. Exam.pdfSpandanaRallapalli
 
Introduction to ArtificiaI Intelligence in Higher Education
Introduction to ArtificiaI Intelligence in Higher EducationIntroduction to ArtificiaI Intelligence in Higher Education
Introduction to ArtificiaI Intelligence in Higher Educationpboyjonauth
 
Types of Journalistic Writing Grade 8.pptx
Types of Journalistic Writing Grade 8.pptxTypes of Journalistic Writing Grade 8.pptx
Types of Journalistic Writing Grade 8.pptxEyham Joco
 
Employee wellbeing at the workplace.pptx
Employee wellbeing at the workplace.pptxEmployee wellbeing at the workplace.pptx
Employee wellbeing at the workplace.pptxNirmalaLoungPoorunde1
 
Judging the Relevance and worth of ideas part 2.pptx
Judging the Relevance  and worth of ideas part 2.pptxJudging the Relevance  and worth of ideas part 2.pptx
Judging the Relevance and worth of ideas part 2.pptxSherlyMaeNeri
 
Procuring digital preservation CAN be quick and painless with our new dynamic...
Procuring digital preservation CAN be quick and painless with our new dynamic...Procuring digital preservation CAN be quick and painless with our new dynamic...
Procuring digital preservation CAN be quick and painless with our new dynamic...Jisc
 
ECONOMIC CONTEXT - PAPER 1 Q3: NEWSPAPERS.pptx
ECONOMIC CONTEXT - PAPER 1 Q3: NEWSPAPERS.pptxECONOMIC CONTEXT - PAPER 1 Q3: NEWSPAPERS.pptx
ECONOMIC CONTEXT - PAPER 1 Q3: NEWSPAPERS.pptxiammrhaywood
 
MULTIDISCIPLINRY NATURE OF THE ENVIRONMENTAL STUDIES.pptx
MULTIDISCIPLINRY NATURE OF THE ENVIRONMENTAL STUDIES.pptxMULTIDISCIPLINRY NATURE OF THE ENVIRONMENTAL STUDIES.pptx
MULTIDISCIPLINRY NATURE OF THE ENVIRONMENTAL STUDIES.pptxAnupkumar Sharma
 
Full Stack Web Development Course for Beginners
Full Stack Web Development Course  for BeginnersFull Stack Web Development Course  for Beginners
Full Stack Web Development Course for BeginnersSabitha Banu
 
ROOT CAUSE ANALYSIS PowerPoint Presentation
ROOT CAUSE ANALYSIS PowerPoint PresentationROOT CAUSE ANALYSIS PowerPoint Presentation
ROOT CAUSE ANALYSIS PowerPoint PresentationAadityaSharma884161
 
DATA STRUCTURE AND ALGORITHM for beginners
DATA STRUCTURE AND ALGORITHM for beginnersDATA STRUCTURE AND ALGORITHM for beginners
DATA STRUCTURE AND ALGORITHM for beginnersSabitha Banu
 
Solving Puzzles Benefits Everyone (English).pptx
Solving Puzzles Benefits Everyone (English).pptxSolving Puzzles Benefits Everyone (English).pptx
Solving Puzzles Benefits Everyone (English).pptxOH TEIK BIN
 
How to Configure Email Server in Odoo 17
How to Configure Email Server in Odoo 17How to Configure Email Server in Odoo 17
How to Configure Email Server in Odoo 17Celine George
 
Gas measurement O2,Co2,& ph) 04/2024.pptx
Gas measurement O2,Co2,& ph) 04/2024.pptxGas measurement O2,Co2,& ph) 04/2024.pptx
Gas measurement O2,Co2,& ph) 04/2024.pptxDr.Ibrahim Hassaan
 
Proudly South Africa powerpoint Thorisha.pptx
Proudly South Africa powerpoint Thorisha.pptxProudly South Africa powerpoint Thorisha.pptx
Proudly South Africa powerpoint Thorisha.pptxthorishapillay1
 
EPANDING THE CONTENT OF AN OUTLINE using notes.pptx
EPANDING THE CONTENT OF AN OUTLINE using notes.pptxEPANDING THE CONTENT OF AN OUTLINE using notes.pptx
EPANDING THE CONTENT OF AN OUTLINE using notes.pptxRaymartEstabillo3
 

Recently uploaded (20)

Model Call Girl in Tilak Nagar Delhi reach out to us at 🔝9953056974🔝
Model Call Girl in Tilak Nagar Delhi reach out to us at 🔝9953056974🔝Model Call Girl in Tilak Nagar Delhi reach out to us at 🔝9953056974🔝
Model Call Girl in Tilak Nagar Delhi reach out to us at 🔝9953056974🔝
 
Hierarchy of management that covers different levels of management
Hierarchy of management that covers different levels of managementHierarchy of management that covers different levels of management
Hierarchy of management that covers different levels of management
 
ACC 2024 Chronicles. Cardiology. Exam.pdf
ACC 2024 Chronicles. Cardiology. Exam.pdfACC 2024 Chronicles. Cardiology. Exam.pdf
ACC 2024 Chronicles. Cardiology. Exam.pdf
 
Introduction to ArtificiaI Intelligence in Higher Education
Introduction to ArtificiaI Intelligence in Higher EducationIntroduction to ArtificiaI Intelligence in Higher Education
Introduction to ArtificiaI Intelligence in Higher Education
 
Types of Journalistic Writing Grade 8.pptx
Types of Journalistic Writing Grade 8.pptxTypes of Journalistic Writing Grade 8.pptx
Types of Journalistic Writing Grade 8.pptx
 
Employee wellbeing at the workplace.pptx
Employee wellbeing at the workplace.pptxEmployee wellbeing at the workplace.pptx
Employee wellbeing at the workplace.pptx
 
Judging the Relevance and worth of ideas part 2.pptx
Judging the Relevance  and worth of ideas part 2.pptxJudging the Relevance  and worth of ideas part 2.pptx
Judging the Relevance and worth of ideas part 2.pptx
 
Procuring digital preservation CAN be quick and painless with our new dynamic...
Procuring digital preservation CAN be quick and painless with our new dynamic...Procuring digital preservation CAN be quick and painless with our new dynamic...
Procuring digital preservation CAN be quick and painless with our new dynamic...
 
ECONOMIC CONTEXT - PAPER 1 Q3: NEWSPAPERS.pptx
ECONOMIC CONTEXT - PAPER 1 Q3: NEWSPAPERS.pptxECONOMIC CONTEXT - PAPER 1 Q3: NEWSPAPERS.pptx
ECONOMIC CONTEXT - PAPER 1 Q3: NEWSPAPERS.pptx
 
MULTIDISCIPLINRY NATURE OF THE ENVIRONMENTAL STUDIES.pptx
MULTIDISCIPLINRY NATURE OF THE ENVIRONMENTAL STUDIES.pptxMULTIDISCIPLINRY NATURE OF THE ENVIRONMENTAL STUDIES.pptx
MULTIDISCIPLINRY NATURE OF THE ENVIRONMENTAL STUDIES.pptx
 
Raw materials used in Herbal Cosmetics.pptx
Raw materials used in Herbal Cosmetics.pptxRaw materials used in Herbal Cosmetics.pptx
Raw materials used in Herbal Cosmetics.pptx
 
Full Stack Web Development Course for Beginners
Full Stack Web Development Course  for BeginnersFull Stack Web Development Course  for Beginners
Full Stack Web Development Course for Beginners
 
ROOT CAUSE ANALYSIS PowerPoint Presentation
ROOT CAUSE ANALYSIS PowerPoint PresentationROOT CAUSE ANALYSIS PowerPoint Presentation
ROOT CAUSE ANALYSIS PowerPoint Presentation
 
DATA STRUCTURE AND ALGORITHM for beginners
DATA STRUCTURE AND ALGORITHM for beginnersDATA STRUCTURE AND ALGORITHM for beginners
DATA STRUCTURE AND ALGORITHM for beginners
 
Solving Puzzles Benefits Everyone (English).pptx
Solving Puzzles Benefits Everyone (English).pptxSolving Puzzles Benefits Everyone (English).pptx
Solving Puzzles Benefits Everyone (English).pptx
 
How to Configure Email Server in Odoo 17
How to Configure Email Server in Odoo 17How to Configure Email Server in Odoo 17
How to Configure Email Server in Odoo 17
 
Gas measurement O2,Co2,& ph) 04/2024.pptx
Gas measurement O2,Co2,& ph) 04/2024.pptxGas measurement O2,Co2,& ph) 04/2024.pptx
Gas measurement O2,Co2,& ph) 04/2024.pptx
 
Rapple "Scholarly Communications and the Sustainable Development Goals"
Rapple "Scholarly Communications and the Sustainable Development Goals"Rapple "Scholarly Communications and the Sustainable Development Goals"
Rapple "Scholarly Communications and the Sustainable Development Goals"
 
Proudly South Africa powerpoint Thorisha.pptx
Proudly South Africa powerpoint Thorisha.pptxProudly South Africa powerpoint Thorisha.pptx
Proudly South Africa powerpoint Thorisha.pptx
 
EPANDING THE CONTENT OF AN OUTLINE using notes.pptx
EPANDING THE CONTENT OF AN OUTLINE using notes.pptxEPANDING THE CONTENT OF AN OUTLINE using notes.pptx
EPANDING THE CONTENT OF AN OUTLINE using notes.pptx
 

Radar Principle

  • 1. 1 CHAPTER 1 — BASIC RADAR PRINCIPLES AND GENERAL CHARACTERISTICS INTRODUCTION The word radar is an acronym derived from the phrase RAdio Detection And Ranging and applies to electronic equipment designed for detecting and tracking objects (targets) at considerable distances. The basic principle behind radar is simple - extremely short bursts of radio energy (traveling at the speed of light) are transmitted, reflected off a target and then returned as an echo. Radar makes use of a phenomenon we have all observed, that of the ECHO PRINCIPLE. To illustrate this principle, if a ship’s whistle were sounded in the middle of the ocean, the sound waves would dissipate their energy as they traveled outward and at some point would disappear entirely. If, however the whistle sounded near an object such as a cliff some of the radiated sound waves would be reflected back to the ship as an echo. The form of electromagnetic signal radiated by the radar depends upon the type of information needed about the target. Radar, as designed for marine navigation applications, is pulse modulated. Pulse-modulated radar can determine the distance to a target by measuring the time required for an extremely short burst of radio-frequency (r-f) energy to travel to the target and return to its source as a reflected echo. Directional antennas are used for transmitting the pulse and receiving the reflected echo, thereby allowing determination of the direction or bearing of the target echo. Once time and bearing are measured, these targets or echoes are calculated and displayed on the radar display. The radar display provides the operator a birds eye view of where other targets are relative to own ship. Radar is an active device. It utilizes its own radio energy to detect and track the target. It does not depend on energy radiated by the target itself. The ability to detect a target at great distances and to locate its position with high accuracy are two of the chief attributes of radar. There are two groups of radio frequencies allocated by international standards for use by civil marine radar systems. The first group lies in the X- band which corresponds to a wavelength of 3 cm. and has a frequency range between 9300 and 9500 MHz. The second group lies in the S-band with a wavelength of 10 cm. and has a frequency range of 2900 to 3100 MHz. It is sometimes more convenient to speak in terms of wavelength rather than frequency because of the high values associated with the latter. A fundamental requirement of marine radar is that of directional transmission and reception, which is achieved by producing a narrow horizontal beam. In order to focus the radio energy into a narrow beam the laws of physics prevail and the wavelength must be within the few centimeters range. The radio-frequency energy transmitted by pulse-modulated radars consists of a series of equally spaced pulses, frequently having durations of about 1 microsecond or less, separated by very short but relatively long periods during which no energy is transmitted. The terms PULSE- MODULATED RADAR and PULSE MODULATION are derived from this method of transmission of radio-frequency energy. If the distance to a target is to be determined by measuring the time required for one pulse to travel to the target and return as a reflected echo, it is necessary that this cycle be completed before the pulse immediately following is transmitted. This is the reason why the transmitted pulses must be separated by relatively long nontransmitting time periods. Otherwise, transmission would occur during reception of the reflected echo of the preceding pulse. Using the same antenna for both transmitting and receiving, the relatively weak reflected echo would be blocked by the relatively strong transmitted pulse.
  • 2. 2 A BRIEF HISTORY Radar, the device which is used for detection and ranging of contacts, independent of time and weather conditions, was one of the most important scientific discoveries and technological developments that emerged from WWII. It’s development, like that of most great inventions was mothered by necessity. Behind the development of radar lay more than a century of radio development. The basic idea of radar can be traced back to the classical experiments on electromagnetic radiation conducted by the scientific community in the 19th century. In the early 1800s, an English physicist, Michael Faraday, demonstrated that electric current produces a magnetic field and that the energy in this field returns to the circuit when the current is stopped. In 1864 the Scottish physicist, James Maxwell, had formulated the general equations of the electromagnetic field, determining that both light and radio waves are actually electromagnetic waves governed by the same fundamental laws but having different frequencies. He proved mathematically that any electrical disturbance could produce an effect at a considerable distance from the point of origin and that this electromagnetic energy travels outward from the source in the form of waves moving at the speed of light. At the time of Maxwell’s conclusions there was no available means to propagate or detect electromagnetic waves. It was not until 1886 that Maxwell’s theories were tested. The German physicist, Heinrich Hertz, set out to validate Maxwell’s general equations. Hertz was able to show that electromagnetic waves travelled in straight lines and that they can be reflected from a metal object just as light waves are reflected by a mirror. In 1904 the German engineer, Christian Hulsmeyer obtained a patent for a device capable of detecting ships. This device was demonstrated to the German navy, but failed to arouse interest probably due in part to its very limited range. In 1922, Guglielmo Marconi drew attention to the work of Hertz and repeated Hertz’s experiments and eventually proposed in principle what we know now as marine radar. The first observation of the radar effect was made in 1922 by Dr. Albert Taylor of the Naval Research Laboratory (NRL) in Washington, D.C. Dr. Taylor observed that a ship passing between a radio transmitter and receiver reflected some of the waves back to the transmitter. In 1930 further tests at the NRL observed that a plane flying through a beam from a transmitting antenna caused a fluctuation in the signal. The importance of radar for the purposes of tracking aircraft and ships finally became recognized when scientists and engineers learned how to use a single antenna for transmitting and receiving. Due to the prevailing political and military conditions at the time, the United States, Great Britain, Soviet Union, France, Italy, Germany and Japan all began experimenting with radar, with varying degrees of success. During the 1930s, efforts were made by several countries to use radio echo for aircraft detection. Most of these countries were able to produce some form of operational radar equipment for use by the military at the start of the war in 1939. At the beginning of WWII, Germany had progressed further in radar development and employed radar units on the ground and in the air for defense against allied aircraft. The ability of radar to serve as an early warning device proved valuable as a defensive tool for the British and the Germans. Although radar was employed at the start of the war as a defensive weapon, as the war progressed, it came to be used for offensive purposes too. By the middle of 1941 radar had been employed to track aircraft automatically in azimuth and elevation and later to track targets automatically in range. All of the proven radar systems developed prior to the war were in the VHF band. These low frequency radar signals are subject to several limitations, but despite the drawbacks, VHF represented the frontier of radar technology. Late in 1939, British physicists created the cavity magnetron oscillator which operated at higher frequencies. It was the magnetron that made microwave radar a reality. It was this technological advance that marks the beginning of modern radar. Following the war, progress in radar technology slowed as post war priorities were directed elsewhere. In the 1950s new and better radar systems began to emerge and the benefits to the civil mariner became more important. Although radar technology has been advanced primarily by the military, the benefits have spilled over into many important civilian applications, of which a principal example is the safety of marine navigation. The same fundamental principles discovered nearly a century ago and the basic data they provide, namely target range and bearing, still apply to today’s modern marine radar units.
  • 3. 3 RADAR PROPAGATION CHARACTERISTICS THE RADIO WAVE To appreciate the capabilities and limitations of a marine radar and to be able to use it to full advantage, it is necessary to comprehend the characteristics and behavior of radio waves and to grasp the principles of their generation and reception, including the echo display as seen by the observer. Understanding the theory behind the target presentation on the radar scope will provide the radar observer a better understanding of the art and science of radar interpretation. Radar (radio) waves, emitted in pulses of electromagnetic energy in the radio-frequency band 3,000 to 10,000 MHz used for shipborne navigational radar, have many characteristics similar to those of other waves. Like light waves of much higher frequency, radar waves tend to travel in straight lines or rays at speeds approximating that of light. Also, like light waves, radar waves are subject to refraction or bending in the atmosphere. Radio-frequency energy travels at the speed of light, approximately 162,000 nautical miles per second; therefore, the time required for a pulse to travel to the target and return to its source is a measure of the distance to the target. Since the radio-frequency energy makes a round trip, only half the time of travel determines the distance to the target. The round trip time is accounted for in the calibration of the radar. The speed of a pulse of radio-frequency energy is so fast that the pulse can circumnavigate the earth at the equator more than 7 times in 1 second. It should be obvious that in measuring the time of travel of a radar pulse or signal from one ship to a target ship, the measurement must be an extremely short time interval. For this reason, the MICROSECOND (µsec) is used as a measure of time for radar applications. The microsecond is one-millionth part of 1 second, i.e., there are 1,000,000 microseconds in 1 second of time. Radio waves have characteristics common to other forms of wave motion such as ocean waves. Wave motion consists of a succession of crests and troughs which follow one another at equal intervals and move along at a constant speed. Like waves in the sea, radar waves have energy, frequency, amplitude, wavelength, and rate of travel. Whereas waves in the sea have mechanical energy, radar waves have electromagnetic energy, usually expressed in watt units of power. An important characteristic of radio waves in connection with radar is polarization. This electromagnetic energy has associated electric and magnetic fields, the directions of which are at right angles to each other. The orientation of the ELECTRIC AXIS in space establishes what is known as the POLARIZATION of the wave. Horizontal polarization is normally used with navigational radars, i.e., the direction of the electric axis is horizontal in space. Horizontal polarization has been found to be the most satisfactory type of polarization for navigational radars in that stronger echoes are received from the targets normally used with these radars when the electric axis is horizontal. Each pulse of energy transmitted during a few tenths of a microsecond or a few microseconds contains hundreds of complete oscillations. A CYCLE is one complete oscillation or one complete wave, i.e., that part of the wave motion passing zero in one direction until it next passes zero in the same direction (see figure 1.1). The FREQUENCY is the number of cycles completed per second. The unit now being used for frequency in cycles per second is the HERTZ. One hertz is one cycle per second; one kilohertz (kHz) is one thousand cycles per second; one megahertz (MHz) is one million cycles per second. WAVELENGTH is the distance along the direction of propagation between successive crests or troughs. When one cycle has been completed, the wave has traveled one wavelength. The AMPLITUDE is the maximum displacement of the wave from its mean or zero value. Since the speed of radar waves is constant at 300,000 kilometers per second, there is a definite relationship between frequency and wavelength. Figure 1.1 - Wave.
  • 4. 4 The CYCLE is a complete alternation or oscillation from one crest through a trough to the next crest. When the wavelength is 3.2 centimeters (0.000032 km), THE RADAR BEAM The pulses of r-f energy emitted from the feedhorn at the focal point of a reflector or emitted and radiated directly from the slots of a slotted waveguide antenna would, for the most part, form a single lobe-shaped pattern of radiation if emitted in free space. Figure 1.2 illustrates this free space radiation pattern, including the undesirable minor lobes or SIDE LOBES associated with practical antenna design. Because of the large differences in the various dimensions of the radiation pattern, figure 1.2 is necessarily distorted. Although the radiated energy is concentrated or focused into a relatively narrow main beam by the antenna, similar to a beam of light from a flashlight, there is no clearly defined envelope of the energy radiated. While the energy is concentrated along the axis of the beam, its strength decreases with distance along the axis. The strength of the energy decreases rapidly in directions away from the beam axis. The power in watts at points in the beam is inversely proportional to the square of the distance. Therefore, the power at 3 miles is only 1/9th of the power at 1 mile in a given direction. The field intensity in volts at points in the beam is inversely proportional to the distance. Therefore, the voltage at 2 miles is only one-half the voltage at 1 mile in a given direction. With the rapid decrease in the amount of radiated energy in directions away from the axis and in conjunction with the rapid decreases of this energy with distance, it follows that practical limits of power or voltage may be used to define the dimensions of the radar beam or to establish its envelope of useful energy. Beam Width The three-dimensional radar beam is normally defined by its horizontal and vertical beam widths. Beam width is the angular width of a radar beam between points within which the field strength or power is greater than arbitrarily selected lower limits of field strength or power. There are two limiting values, expressed either in terms of field intensity or power ratios, used conventionally to define beam width. One convention defines beam width as the angular width between points at which the field strength is 71 percent of its maximum value. Expressed in terms of power ratio, this convention defines beam width as the angular width between HALF-POWER POINTS. The other convention defines beam width as the angular width between points at which the field strength is 50 percent of its maximum value. Expressed in terms of power ratio, the latter convention defines beam width as the angular width between QUARTER-POWER POINTS. The half-power ratio is the most frequently used convention. Which convention has been used in stating the beam width may be identified from the decibel (dB) figure normally included with the specifications of a radar set. Half power and 71 percent field strength correspond to -3 dB; quarter power and 50 percent field strength correspond to -6 dB. Figure 1.2 - Free space radiation pattern. frequency speed of radar waves wavelength ------------------------------------------------- - = frequency 300 000 km , ond sec -------------------------------- - 0.000032 km cycle ---------------------------------- - ÷ frequency 9375 megahertz = =
  • 5. 5 The radiation diagram illustrated in figure 1.3 depicts relative values of power in the same plane existing at the same distances from the antenna or the origin of the radar beam. Maximum power is in the direction of the axis of the beam. Power values diminish rapidly in directions away from the axis. The beam width in this case is taken as the angle between the half-power points. For a given amount of transmitted power, the main lobe of the radar beam extends to a greater distance at a given power level with greater concentration of power in narrower beam widths. To increase maximum detection range capabilities, the energy is concentrated into as narrow a beam as is feasible. Because of practical considerations related to target detection and discrimination, only the horizontal beam width is quite narrow, typical values being between about 0.65˚ to 2.0˚. The vertical beam width is relatively broad, typical values being between about 15˚ to 30˚. The beam width is dependent upon the frequency or wavelength of the transmitted energy, antenna design, and the dimensions of the antenna. For a given antenna size (antenna aperture), narrower beam widths are obtained when using shorter wavelengths. For a given wavelength, narrower beam widths are obtained when using larger antennas. The slotted waveguide antenna has largely eliminated the side-lobe problem. EFFECT OF SEA SURFACE ON RADAR BEAM With radar waves being propagated in the vicinity of the surface of the sea, the main lobe of the radar beam, as a whole, is composed of a number of separate lobes as opposed to the single lobe-shaped pattern of radiation as emitted in free space. This phenomenon is the result of interference between radar waves directly transmitted and those waves which are reflected from the surface of the sea. The vertical beam widths of navigational radars are such that during normal transmission, radar waves will strike the surface of the sea at points from near the antenna (depending upon antenna height and vertical beam width) to the radar horizon. The indirect waves (see figure 1.4) reflected from the surface of the sea may, on rejoining the direct waves, either reinforce or cancel the direct waves depending upon whether they are in phase or out of phase with the direct waves, respectively. Where the direct and indirect waves are exactly in phase, i.e., the crests and troughs of the waves coincide, hyperbolic lines of maximum radiation known as LINES OF MAXIMA are produced. Where the direct and indirect waves are exactly of opposite phase, i.e., the trough of one wave coincides with the crest of the other wave, hyperbolic lines of minimum radiation known as LINES OF MINIMA are produced. Along directions away from the antenna, the direct and indirect waves will gradually come into and pass out of phase, producing lobes of useful radiation separated by regions within which, for practical purposes, there is no useful radiation. Figure 1.5 illustrates the lower region of the INTERFERENCE PATTERN of a representative navigational radar. Since the first line of minima is at the surface of the sea, the first region of minimum radiation or energy is adjacent to the sea’s surface. From figure 1.5 it should be obvious that if r-f energy is to be reflected from a target, the target must extend somewhat above the radar horizon, the amount of extension being dependent upon the reflecting properties of the target. A VERTICAL-PLANE COVERAGE DIAGRAM as illustrated in figure 1.5 is used by radar designers and analysts to predict regions in which targets will and will not be detected. Of course, on the small page of a book it would be impossible to illustrate the coverage of a radar beam to scale with antenna height being in feet and the lengths of the various lobes of the interference pattern being in miles. In providing greater clarity of the presentation of the lobes, non-linear graduations of the arc of the vertical beam width are used. Figure 1.3 - Radiation diagram. Figure 1.4 - Direct and indirect waves.
  • 6. 6 Figure 1.5 - Vertical-plane coverage diagram (3050 MHz, antenna height 125 feet, wave height 4 feet).
  • 7. 7 Figure 1.6 - Vertical-plane coverage diagram (1000 MHz, vertical beam width 10˚, antenna height 80 feet, wave height 0 feet).
  • 8. 8 The lengths of the various lobes illustrated in figures 1.5 and 1.6 should be given no special significance with respect to the range capabilities of a particular radar set. As with other coverage diagrams, the lobes are drawn to connect points of equal field intensities. Longer and broader lobes may be drawn connecting points of equal, but lesser, field intensities. The vertical-plane coverage diagram as illustrated in figure 1.6, while not representative of navigational radars, does indicate that at the lower frequencies the interference pattern is more coarse than the patterns for higher frequencies. This particular diagram was constructed with the assumption that the free space useful range of the radar beam was 50 nautical miles. From this diagram it is seen that the ranges of the useful lobes are extended to considerably greater distances because of the reinforcement of the direct radar waves by the indirect waves. Also, the elevation of the lowest lobe is higher than it would be for a higher frequency. Figure 1.6 also illustrates the vertical view of the undesirable side lobes associated with practical antenna design. In examining these radiation coverage diagrams, the reader should keep in mind that the radiation pattern is three- dimensional. Antenna height as well as frequency or wavelength governs the number of lobes in the interference pattern. The number of the lobes and the fineness of the interference pattern increase with antenna height. Increased antenna height as well as increases in frequency tends to lower the lobes of the interference pattern. The pitch and roll of the ship radiating does not affect the structure of the interference pattern.
  • 9. 9 ATMOSPHERIC FACTORS AFFECTING THE RADAR HORIZON THE RADAR HORIZON The affect of the atmosphere on the horizon is a further factor which should be taken into account when assessing the likelihood of detecting a particular target and especially where the coastline is expected. Generally, radar waves are restricted in the recording of the range of low- lying objects by the radar horizon. The range of the radar horizon depends on the height of the antenna and on the amount of bending of the radar wave. The bending is caused by diffraction and refraction. Diffraction is a property of the electromagnetic wave itself. Refraction is due to the prevailing atmospheric conditions. There is, therefore, a definite radar horizon. DIFFRACTION Diffraction is the bending of a wave as it passes an obstruction. Because of diffraction there is some illumination of the region behind an obstruction or target by the radar beam. Diffraction effects are greater at the lower frequencies. Thus, the radar beam of a lower frequency radar tends to illuminate more of the shadow region behind an obstruction than the beam of radar of higher frequency or shorter wavelength. REFRACTION Refraction affects the range at which objects are detected. The phenomenon of refraction should be well-known to every navigation officer. Refraction takes place when the velocity of the wave is changed. This can happen when the wave front passes the boundary of two substances of differing densities. One substance offers more resistance to the wave than the other and therefore the velocity of the wave will change. Like light rays, radar rays are subject to bending or refraction in the atmosphere resulting from travel through regions of different density. However, radar rays are refracted slightly more than light rays because of the frequencies used. If the radar waves actually traveled in straight lines or rays, the distance to the horizon grazed by these rays would be dependent only on the height of the antenna, assuming adequate power for the rays to reach this horizon. Without the effects of refraction, the distance to the RADAR HORIZON would be the same as that of the geometrical horizon for the antenna height. Standard Atmospheric Conditions The distance to the radar horizon, ignoring refraction can be expressed in the following formula. Where h is the height of the antenna in feet, the distance, d, to the radar horizon in nautical miles, assuming standard atmospheric conditions, may be found as follows: With the distances to the geometrical or ordinary horizon being 1.06 and the distance to the visible or optical horizon being 1.15 . We see that the range of the radar horizon is greater than that of the optical horizon, which again is greater than that of the geometrical horizon. Thus, like light rays in the standard atmosphere, radar rays are bent or refracted slightly downwards approximating the curvature of the earth (see figure 1.7). The distance to the radar horizon does not in itself limit the distance from which echoes may be received from targets. Assuming that adequate power is transmitted, echoes may be received from targets beyond the radar horizon if their reflecting surfaces extend above it. Note that the distance to the radar horizon is the distance at which the radar rays graze the surface of the earth. In the preceding discussion standard atmospheric conditions were assumed. The standard atmosphere is a hypothetical vertical distribution of atmospheric temperature, pressure, and density which is taken to be representative of the atmosphere for various purposes. Standard conditions are precisely defined as follows: Figure 1.7 - Refraction. d 1.22 h = h h
  • 10. 10 Pressure = 1013 mb decreasing at 36 mb/1000 ft of height Temperature = 15˚C decreasing at 2˚C/1000 ft of height Relative Humidity = 60% and constant with height. These conditions give a refractive index of 1.00325 which decreases at 0.00013 units/1000 ft of height. The definition of “standard” conditions relates to the vertical composition of the atmosphere. Mariners may not be able to obtain a precise knowledge of this and so must rely on a more general appreciation of the weather conditions, the area of the world, and of the time of the year. While the atmospheric conditions at any one locality during a given season may differ considerably from standard atmospheric conditions, the slightly downward bending of the light and radar rays may be described as the typical case. While the formula for the distance to the radar horizon is based upon a wavelength of 3cm, this formula may be used in the computation of the distance to the radar horizon for other wavelengths used with navigational radar. The value so determined should be considered only as an approximate value because the mariner generally has no means of knowing what actual refraction conditions exist. Sub-refraction The distance to the radar horizon is reduced. This condition is not as common as super-refraction. Sub-refraction can occur in polar regions where Arctic winds blow over water where a warm current is prevalent. If a layer of cold, moist air overrides a shallow layer of warm, dry air, a condition known as SUB-REFRACTION may occur (see figure 1.8). The effect of sub- refraction is to bend the radar rays upward and thus decrease the maximum ranges at which targets may be detected. Sub-refraction also affects minimum ranges and may result in failure to detect low lying targets at short range. It is important to note that sub- refraction may involve an element of danger to shipping where small vessels and ice may go undetected. The officer in charge of the watch should be especially mindful of this condition and extra precautions be administered such as a reduction in speed and the posting of extra lookouts. Super-refraction The distance to the radar horizon is extended. In calm weather with no turbulence when there is an upper layer of warm, dry air over a surface layer of cold, moist air, a condition known as SUPER-REFRACTION may occur (see figure 1.9). For this condition to exist, the weather must be calm with little or no turbulence, otherwise the layers of different densities will mix and the boundary conditions disappear. The effect of super-refraction will increase the downward bending of the radar rays and thus increase the ranges at which targets may be detected. Super-refraction frequently occurs in the tropics when a warm land breeze blows over cooler ocean currents. It is especially noticeable on the longer range scales. d ( 1.22 h) = Figure 1.8 - Sub-refraction. Figure 1.9 - Super-refraction.
  • 11. 11 Extra Super-refraction or Ducting Most radar operators are aware that at certain times they are able to detect targets at extremely long ranges, but at other times they cannot detect targets within visual ranges, even though their radars may be in top operating condition in both instances. These phenomena occur during extreme cases of super-refraction. Energy radiated at angles of 1˚ or less may be trapped in a layer of the atmosphere called a SURFACE RADIO DUCT. In the surface radio duct illustrated in figure 1.10, the radar rays are refracted downward to the surface of the sea, reflected upward, refracted downward again within the duct, and so on continuously. The energy trapped by the duct suffers little loss; thus, targets may be detected at exceptionally long ranges. Surface targets have been detected at ranges in excess of 1,400 miles with relatively low-powered equipment. There is a great loss in the energy of the rays escaping the duct, thus reducing the chances for detection of targets above the duct. Ducting sometimes reduces the effective radar range. If the antenna is below a duct, it is improbable that targets above the duct will be detected. In instances of extremely low-level ducts when the antenna is above the duct, surface targets lying below the duct may not be detected. The latter situation does not occur very often. Ducting Areas Although ducting conditions can happen any place in the world, the climate and weather in some areas make their occurrence more likely. In some parts of the world, particularly those having a monsoonal climate, variation in the degree of ducting is mainly seasonal, and great changes from day to day may not take place. In other parts of the world, especially those in which low barometric pressure areas recur often, the extent of nonstandard propagation conditions varies considerably from day to day. Figure 1.11 illustrates the different places in the world where known ducting occurs frequently. Refer to the map to see their location in relation to the climate that exists in each area during different seasons of the year. Atlantic Coast of the United States (Area 1). Ducting is common in summer along the northern part of the coast, but in the Florida region the seasonal trend is the reverse, with a maximum in the winter season. Western Europe (Area 2). A pronounced maximum of ducting conditions exists in the summer months on the eastern side of the Atlantic around the British Isles and in the North Sea. Mediterranean Region (Area 3). Available reports indicate that the seasonal variation in the Mediterranean region is very marked, with ducting more or less the rule in summer. Conditions are approximately standard in winter. Ducting in the central Mediterranean area is caused by the flow of warm, dry air from the south, which moves across the sea and thus provides an excellent opportunity for the formation of ducts. In winter, however, the climate in the central Mediterranean is more or less the same as Atlantic conditions, therefore not favorable for duct formation. Arabian Sea (Area 4). The dominating meteorological factor in the Arabian Sea region is the southwest monsoon, which blows from early June to mid- September and covers the whole Arabian Sea with moist-equatorial air up to considerable heights. When this meteorological situation is developed fully, no occurrence of ducting is to be expected. During the dry season, on the other hand, conditions are different. Ducting then is the rule, not the exception, and on some occasions extremely long ranges (up to 1,500 miles) have been observed on fixed targets. When the southwest monsoon begins early in June, ducting disappears on the Indian side of the Arabian Sea. Along the western coasts, however, conditions favoring ducting may still linger. The Strait of Hormuz (Persian Gulf) is particularly interesting as the monsoon there has to contend with the shamal (a northwesterly wind) over Iraq and the Persian Gulf from the north. The strait itself lies at the boundary between the two wind systems; a front is formed with the warm, dry shamal on top and the colder, humid monsoon underneath. Consequently, conditions are favorable for the formation of an extensive duct, which is of great importance to radar operation in the Strait of Hormuz. Bay of Bengal (Area 5). The seasonal trend of ducting conditions in the Bay of Bengal is the same as in the Arabian Sea, with standard conditions during the summer southwest monsoon. Ducting is found during the dry season. Figure 1.10 - Ducting.
  • 12. 12 Figure 1.11 - Ducting areas.
  • 13. 13 Pacific Ocean (Area 6). Frequent occurrences of ducting around Guadalcanal, the east coast of Australia, and around New Guinea and Korea have been experienced. Observations along the Pacific coast of the United States indicate frequent ducting, but no clear indication of its seasonal trend is available. Meteorological conditions in the Yellow Sea and Sea of Japan, including the island of Honshu, are approximately like those of the northeastern coast of the United States. Therefore, ducting in this area should be common in the summer. Conditions in the South China Sea approximate those off the southeastern coast of the United States only during the winter months, when ducting can be expected. During the rest of the year, the Asiatic monsoon modifies the climate in this area, but no information is available on the prevalence of ducting during this time. Trade winds in the Pacific quite generally lead to the formation of rather low ducts over the open ocean. WEATHER FACTORS AFFECTING THE RADAR HORIZON The usual effects of weather are to reduce the ranges at which targets can be detected and to produce unwanted echoes on the radarscope which may obscure the returns from important targets or from targets which may be dangerous to one’s ship. The reduction of intensity of the wave experienced along its path is known as attenuation. Attenuation is caused by the absorption and scattering of energy by the various forms of precipitation. The amount of attenuation caused by each of the various factors depends to a substantial degree on the radar wavelength. It causes a decrease in echo strength. Attenuation is greater at the higher frequencies or shorter wavelengths. Attenuation by rain, fog, clouds, hail, snow, and dust The amount of attenuation caused by these weather factors is dependent upon the amount of water, liquid or frozen, present in a unit volume of air and upon the temperature. Therefore, as one would expect, the affects can differ widely. The further the radar wave and returning echo must travel through this medium then the greater will be the attenuation and subsequent decrease in detection range. This is the case whether the target is in or outside the precipitation. A certain amount of attenuation takes place even when radar waves travel through a clear atmosphere. The affect will not be noticeable to the radar observer. The effect of precipitation starts to become of practical significance at wavelengths shorter than 10cm. In any given set of precipitation conditions, the (S-band) or 10cm will suffer less attenuation than the (X-band) or 3cm. Rain In the case of rain the particles which affect the scattering and attenuation take the form of water droplets. It is possible to relate the amount of attenuation to the rate of precipitation. If the size of the droplet is an appreciable proportion of the 3cm wavelength, strong clutter echoes will be produced and there will be serious loss of energy due to scattering and attenuation. If the target is within the area of rainfall, any echoes from raindrops will further decrease its detection range. Weaker target responses, as from small vessels and buoys, will be undetectable if their echoes are not stronger than that of the rain. A very heavy rainstorm, like those sometimes encountered in the tropics, can obliterate most of the (X-band) radar picture. Continuous rainfall over a large area will make the center part of the screen brighter than the rest and the rain clutter, moving along with the ship, looks similar to sea clutter. It can be clearly seen on long range scales. This is due to a gradual decrease in returning power as the pulse penetrates further into the rain area. Fog In most cases fog does not actually produce echoes on the radar display, but a very dense fogbank which arises in polar regions may produce a significant reduction in detection range. A vessel encountering areas known for industrial pollution in the form of smog may find a somewhat higher degree of attenuation than sea fog.
  • 14. 14 Clouds The water droplets which form clouds are too small to produce a detectable response at the 3cm wavelength. If there is precipitation in the cloud then the operator can expect a detectable echo. Hail With respect to water, hail which is essentially frozen rain reflects radar energy less effectively than water. Therefore, in general the clutter and attenuation from hail are likely to prove less detectable than that from rain. Snow Similar to the effects of hail, the overall effect of clutter on the picture is less than that due to rain. Falling snow will only be observed on the displays of 3cm except during heavy snowfall where attenuation can be observed on a 10cm set. The strength of echoes from snow depends upon the size of the snowflake and the rate of precipitation. For practical purposes, however, the significant factor is the rate of precipitation, because the water content of the heaviest snowfall will very rarely equal that of even moderate rain. It is important to keep in mind that in areas receiving and collecting snowfall and where the snow is collecting on possible danger targets it may render them less detectable. Accumulation of snow produces a limited absorption characteristic and reduces the detection range of an otherwise strong target. Dust There is a general reduction in radar detection in the presence of dust and sandstorms. On the basis of particle size, detectable responses are extremely unlikely and the operator can expect a low level of attenuation. Unusual Propagation Conditions Similar to light waves, radar waves going through the earth’s atmosphere are subject to refraction and normally bend slightly with the curvature of the earth. Certain atmospheric conditions will produce a modification of this normal refraction.
  • 15. 15 A BASIC RADAR SYSTEM RADAR SYSTEM CONSTANTS Before describing the functions of the components of a marine radar, there are certain constants associated with any radar system that will be discussed. These are carrier frequency, pulse repetition frequency, pulse length, and power relation. The choice of these constants for a particular system is determined by its operational use, the accuracy required, the range to be covered, the practical physical size, and the problems of generating and receiving the signals. Carrier Frequency The carrier frequency is the frequency at which the radio-frequency energy is generated. The principal factors influencing the selection of the carrier frequency are the desired directivity and the generation and reception of the necessary microwave radio-frequency energy. For the determination of direction and for the concentration of the transmitted energy so that a greater portion of it is useful, the antenna should be highly directive. The higher the carrier frequency, the shorter the wavelength and hence the smaller is the antenna required for a given sharpness of the pattern of radiated energy. The problem of generating and amplifying reasonable amounts of radio- frequency energy at extremely high frequencies is complicated by the physical construction of the tubes to be used. The common tube becomes impractical for certain functions and must be replaced by tubes of special design. Among these are the klystron and magnetron. Since it is very difficult to amplify the radio-frequency echoes of the carrier wave, radio-frequency amplifiers are not used. Instead, the frequency of the incoming signals (echoes) is mixed (heterodyned) with that of a local oscillator in a crystal mixer to produce a difference frequency called the intermediate frequency. This intermediate frequency is low enough to be amplified in suitable intermediate frequency amplifier stages in the receiver. Pulse Repetition Frequency The Pulse Repetition Frequency (PRF), sometimes referred to as Pulse Repetition Rate (PRR) is the number of pulses transmitted per second. Some characteristic values may be 600, 1000, 1500, 2200 and 3000 pulses per second. The majority of modern marine radars operate within a range of 400 to 4000 pulses per second. If the distance to a target is to be determined by measuring the time required for one pulse to travel to the target and return as a reflected echo, it is necessary that this cycle be completed before the pulse immediately following is transmitted. This is the reason why the transmitted pulses must be separated by relatively long nontransmitting time periods. Otherwise, transmission would occur during reception of the reflected echo of the preceding pulse. Using the same antenna for both transmitting and receiving, the relatively weak reflected echo would be blocked by the relatively strong transmitted pulse. Sufficient time must be allowed between each transmitted pulse for an echo to return from any target located within the maximum workable range of the system. Otherwise, the reception of the echoes from the more distant targets would be blocked by succeeding transmitted pulses. The maximum measurable range of a radar set depends upon the peak power in relation to the pulse repetition rate. Assuming sufficient power is radiated, the maximum range at which echoes can be received may be increased through lowering the pulse repetition rate to provide more time between transmitted pulses. The PRR must be high enough so that sufficient pulses hit the target and enough are returned to detect the target. The maximum measurable range, assuming that the echoes are strong enough for detection, can be determined by dividing 80,915 (radar nautical miles per second) by the PRR. With the antenna being rotated, the beam of energy strikes a target for a relatively short time. During this time, a sufficient number of pulses must be transmitted in order to receive sufficient echoes to produce the necessary indication on the radarscope. With the antenna rotating at 15 revolutions per minute, a radar set having a PRR of 800 pulses per second will produce approximately 9 pulses for each degree of antenna rotation. The PERSISTENCE of the radarscope, i.e., a measure of the time it retains images of echoes, and the rotational speed of the antenna, therefore, determine the lowest PRR that can be used. Pulse Length Pulse length is defined as the duration of the transmitted radar pulse and is usually measured in microseconds. The minimum range at which a target can be detected is determined largely by the pulse length. If a target is so close to the transmitter that the echo is returned to the receiver before the transmission stops, the reception
  • 16. 16 of the echo, obviously, will be masked by the transmitted pulse. For example, a radar set having a pulse length of 1 microsecond will have a minimum range of 164 yards. This means that the echo of a target within this range will not be seen on the radarscope because of being masked by the transmitted pulse. Since the radio-frequency energy travels at a speed of 161,829 nautical miles per second or 161,829 nautical miles in one million microseconds, the distance the energy travels in 1 microsecond is approximately 0.162 nautical mile or 328 yards. Because the energy must make a round trip, the target cannot be closer than 164 yards if its echo is to be seen on the radarscope while using a pulse length of 1 microsecond. Consequently, relatively short pulse lengths, about 0.1 microsecond, must be used for close-in ranging. Many radar sets are designed for operation with both short and long pulse lengths. Many of these radar sets are shifted automatically to the shorter pulse length on selecting the shorter range scales. On the other radar sets, the operator must select the radar pulse length in accordance with the operating conditions. Radar sets have greater range capabilities while functioning with the longer pulse length because a greater amount of energy is transmitted in each pulse. While maximum detection range capability is sacrificed when using the shorter pulse length, better range accuracy and range resolution are obtained. With the shorter pulse, better definition of the target on the radar-scope is obtained; therefore, range accuracy is better. RANGE RESOLUTION is a measure of the capability of a radar set to detect the separation between those targets on the same bearing but having small differences in range. If the leading edge of a pulse strikes a target at a slightly greater range while the trailing part of the pulse is still striking a closer target, it is obvious that the reflected echoes of the two targets will appear as a single elongated image on the radarscope. Power Relation The useful power of the transmitter is that contained in the radiated pulses and is called the PEAK POWER of the system. Power is normally measured as an average value over a relatively long period of time. Because the radar transmitter is resting for a time that is long with respect to the operating time, the average power delivered during one cycle of operation is relatively low compared with the peak power available during the pulse time. A definite relationship exists between the average power dissipated over an extended period of time and the peak power developed during the pulse time. The PULSE REPETITION TIME, or the overall time of one cycle of operation, is the reciprocal of the pulse repetition rate (PRR). Other factors remaining constant, the longer the pulse length, the higher will be the average power; the longer the pulse repetition time, the lower will be the average power. These general relationships are shown in figure 1.12. The operating cycle of the radar transmitter can be described in terms of the fraction of the total time that radio-frequency energy is radiated. This time relationship is called the DUTY CYCLE and may be represented as follows: For a radar having a pulse length of 2 microseconds and a pulse repetition rate of 500 cycles per second (pulse repetition time = 2,000 microseconds), the Figure 1.12 - Relationship of peak and average power. average power peak power ----------------------------------------- pulse length pulse repetition time ------------------------------------------------------------ - = duty cycle pulse length pulse repetition time ------------------------------------------------------------ - = duty cycle 2µsec 2 000 µsec , -------------------------- 0.001 = =
  • 17. 17 Likewise, the ratio between the average power and peak power may be expressed in terms of the duty cycle. In the foregoing example assume that the peak power is 200 kilowatts. Therefore, for a period of 2 microseconds a peak power of 200 kilowatts is supplied to the antenna, while for the remaining 1998 microseconds the transmitter output is zero. Because average power is equal to peak power times the duty cycle, High peak power is desirable in order to produce a strong echo over the maximum range of the equipment. Low average power enables the transmitter tubes and circuit components to be made smaller and more compact. Thus, it is advantageous to have a low duty cycle. The peak power that can be developed is dependent upon the interrelation between peak and average power, pulse length, and pulse repetition time, or duty cycle. COMPONENTS AND SUMMARY OF FUNCTIONS While pulse-modulated radar systems vary greatly in detail, the principles of operation are essentially the same for all systems. Thus, a single basic radar system can be visualized in which the functional requirements are essentially the same as for all specific equipments. The functional breakdown of a basic pulse-modulated radar system usually includes six major components, as shown in the block diagram, figure 1.13. The functions of the components may be summarized as follows: The power supply furnishes all AC and DC voltages necessary for the operation of the system components. The modulator produces the synchronizing signals that trigger the transmitter the required number of times per second. It also triggers the indicator sweep and coordinates the other associated circuits. The transmitter generates the radio-frequency energy in the form of short powerful pulses. The antenna system takes the radio-frequency energy from the transmitter, radiates it in a highly directional beam, receives any returning echoes, and passes these echoes to the receiver. The receiver amplifies the weak radio-frequency pulses (echoes) returned by a target and reproduces them as video pulses passed to the indicator. The indicator produces a visual indication of the echo pulses in a manner that furnishes the desired information. duty cycle average power peak power ----------------------------------------- = average power 200 kw x 0.001 0.2 kilowatt = = Figure 1.13 - Block diagram of a basic pulse-modulated radar system
  • 18. 18 FUNCTIONS OF COMPONENTS Power Supply In figure 1.13 the power supply is represented as a single block. Functionally, this block is representative. However, it is unlikely that any one supply source could meet all the power requirements of a radar set. The distribution of the physical components of a system may be such as to make it impractical to group the power-supply circuits into a single physical unit. Different supplies are needed to meet the varying requirements of a system and must be designed accordingly. The power supply function is performed by various types of power supplies distributed among the circuit components of a radar set. In figure 1.14 the modulator, transmitter, and receiver are contained in the same chassis. In this arrangement, the group of components is called a TRANSCEIVER. (The term transceiver is an acronym composed from the words TRANSmitter and reCEIVER.) Modulator The function of the modulator is to insure that all circuits connected with the radar system operate in a definite time relationship with each other and that the time interval between pulses is of the proper length. The modulator simultaneously sends a synchronizing signal to trigger the transmitter and the indicator sweep. This establishes a control for the pulse repetition rate (PRR) and provides a reference for the timing of the travel of a transmitted pulse to a target and its return as an echo. Transmitter The transmitter is basically an oscillator which generates radio-frequency (r-f) energy in the form of short powerful pulses as a result of being turned on and off by the triggering signals from the modulator. Because of the frequencies and power outputs required, the transmitter oscillator is a special type known as a MAGNETRON. Transmitting and Receiving Antenna System The function of the antenna system is to take the r-f energy from the transmitter, radiate this energy in a highly directional beam, receive any echoes or reflections of transmitted pulses from targets, and pass these echoes to the receiver. In carrying out this function the r-f pulses generated in the transmitter are conducted to a FEEDHORN at the focal point of a directional reflector, from which the energy is radiated in a highly directional pattern. The transmitted and reflected energy (returned by the same dual purpose reflector) are conducted by a common path. This common path is an electrical conductor known as a WAVEGUIDE. A waveguide is hollow copper tubing, usually rectangular in cross section, having dimensions according to the wavelength or the carrier frequency, i.e., the frequency of the oscillations within the transmitted pulse or echo. Because of this use of a common waveguide, an electronic switch, a TRANSMIT-RECEIVE (TR) TUBE capable of rapidly switching from transmit to receive functions, and vice versa, must be utilized to protect the receiver from damage by the potent energy generated by the transmitter. The TR tube, as shown in figure 1.14 blocks the transmitter pulses from the receiver. During the relatively long periods when the transmitter is inactive, the TR tube permits the returning echoes to pass to the receiver. To prevent any of the very weak echoes from being absorbed by the transmitter, another device known as an ANTI-TR (A-TR) TUBE is used to block the passage of these echoes to the transmitter.
  • 19. 19 Figure 1.14 - A basic radar system.
  • 20. 20 The feedhorn at the upper extremity of the waveguide directs the transmitted energy towards the reflector, which focuses this energy into a narrow beam. Any returning echoes are focused by the reflector and directed toward the feedhorn. The echoes pass through both the feedhorn and waveguide enroute to the receiver. The principles of a parabolic reflector are illustrated in figure 1.15. Since the r-f energy is transmitted in a narrow beam, particularly narrow in its horizontal dimension, provision must be made for directing this beam towards a target so that its range and bearing may be measured. Normally, this is accomplished through continuous rotation of the radar beam at a rate of about 10 to 20 revolutions per minute so that it will impinge upon any targets which might be in its path. Therefore, in this basic radar system the upper portion of the waveguide, including the feedhorn, and the reflector are constructed so that they can be rotated in the horizontal plane by a drive motor. This rotatable antenna and reflector assembly is called the SCANNER. Figure 1.16 illustrates a SLOTTED WAVEGUIDE ANTENNA and notice that there is no reflector or feedhorn. The last few feet of the waveguide is constructed so that it can be rotated in the horizontal plane. The forward and narrower face of the rotatable waveguide section contains a series of slots from which the r-f energy is emitted to form a narrow radar beam. Returning echoes also pass through these slots and then pass through the waveguide to the receiver. Receiver The function of the receiver is to amplify or increase the strength of the very weak r-f echoes and reproduce them as video signals to be passed to the indicator. The receiver contains a crystal mixer and intermediate frequency amplification stages required for producing video signals used by the indicator. Figure 1.15 - Principles of a parabolic reflector. Figure 1.16 - Slotted waveguide antenna.
  • 21. 21 Indicator The primary function of the indicator is to provide a visual display of the ranges and bearings of radar targets from which echoes are received. In this basic radar system, the type of display used is the PLAN POSITION INDICATOR (PPI), which is essentially a polar diagram, with the transmitting ship’s position at the center. Images of target echoes are received and displayed at either their relative or true bearings, and at their distances from the PPI center. With a continuous display of the images of the targets, the motion of the target relative to the motion of the transmitting ship is also displayed. The secondary function of the indicator is to provide the means for operating various controls of the radar system. The CATHODE-RAY TUBE (CRT), illustrated in figure 1.17, is the heart of the indicator. The CRT face or screen, which is coated with a film of phosphorescent material, is the PPI. The ELECTRON GUN at the opposite end of the tube (see figure 1.18) emits a very narrow beam of electrons which impinges upon the center of the PPI unless deflected by electrostatic or electromagnetic means. Since the inside face of the PPI is coated with phosphorescent material, a small bright spot is formed at the center of the PPI. If the electron beam is rapidly and repeatedly deflected radially from the center, a bright line called a TRACE is formed on the PPI. Should the flow of electrons be stopped, this trace will continue to glow for a short period following the stoppage of the electron beam because of the phosphorescent coating. The slow decay of the brightness is known as PERSISTENCE; the slower the decay the higher the persistence. At the instant the modulator triggers the transmitter, it sends a TIMING TRIGGER signal to the indicator. The latter signal acts to deflect the electron beam radially from the center of the CRT screen (PPI) to form a trace of the radial movement of the electron beam. This radial movement of the electron beam is called the SWEEP or TIME BASE. While the terms trace and sweep are frequently used interchangeably, the term trace is descriptive only of the visible evidence of the sweep movement. Since the electron beam is deflected from the center of the CRT screen with each pulse of the transmitter, the sweep must be repeated very rapidly even when the lower pulse repetition rates are used. With a pulse repetition rate of 750 pulses per second, the sweep must be repeated 750 times per second. Thus, it should be quite obvious why the sweep appears as a solid luminous line on the PPI. The speed of movement of the point of impingement of the electron beam is far in excess of the capability of detection by the human eye. While the sweep must be repeated in accordance with the PRR, the actual rate of radial movement of the electron beam is governed by the size of the CRT screen and the distance represented by the radius of this screen according to the range scale being used. If the 20-mile range scale is selected, the electron beam must be deflected radially from the center of the CRT screen having a particular radius at a rate corresponding to the time required for radio-frequency energy to travel twice the distance of the range scale or 40 nautical miles. When using the 20-mile range scale, the electron beam must move radially from the center of the CRT screen to its periphery in 247 microseconds. Speed of radio frequency - frequency energy = 0.161829 nm per microsecond Distance = Speed X Time 40 nm ÷ 0.161829 nm per microsecond = 247 microseconds The objective of regulating the rate of travel of the electron beam in this manner is to establish a time base on the PPI which may be used for direct measurements of distances to targets without further need to take into Figure 1.17 - Electromagnetic cathode-ray tube.
  • 22. 22 account the fact that the transmitted pulse and its reflected echo make a round trip to and from the target. With the periphery of the PPI representing a distance of 20 miles from the center of the PPI at the 20-mile range scale setting, the time required for the electron beam to move radially from the center to the periphery is the same as the time required for the transmitted pulse to travel to a target at 20 miles and return to the antenna as a reflected echo or the time to travel 40 miles in this case. It follows that a point on the sweep or time base halfway between the center of the PPI and its periphery Figure 1.18 - The sweep on the plan position indicator.
  • 23. 23 represents a distance of 10 miles from the center of the PPI. The foregoing assumes that the rate of travel of the electron beam is constant, which is the usual case in the design of indicators for navigational radar. If the antenna is trained on a target at 10 miles while using the 20-mile range scale, the time for the 20-mile round trip of the transmitted pulse and the returning echo is 123.5 microseconds. At 123.5 microseconds, following the instant of triggering the transmitter and sending the timing trigger pulse to the indicator to deflect the electron beam radially, the electron beam will have moved a distance of 10 miles in its sweep or on the time base. On receiving the echo at 123.5 microseconds after the instant of the pulse, the receiver sends a video signal to the indicator which in turn acts to intensify or brighten the electron beam at the point in its sweep at 123.5 microseconds, i.e., at 10 miles on the time base. This brightening of the trace produced by the sweep at the point corresponding to the distance to the target in conjunction with the persistence of the PPI produces a visible image of the target. Because of the pulse repetition rate, this painting of an image on the PPI is repeated many times in a short period, resulting in a steady glow of the target image if the target is a reasonably good reflector. In navigational and collision avoidance applications of radar, the antenna and the beam of r-f energy radiated from it are rotated at a constant rate, usually about 10 to 20 revolutions per minute in order to detect targets all around the observer’s ship. In the preceding discussion of how a target image is painted on the PPI, reference is made only to radial deflection of the electron beam to produce the sweep or time base. If target images are to be painted at their relative bearings as well as distances from the center of the PPI, the sweep must be rotated in synchronization with the rotation of the antenna. Just as the electron beam may be deflected radially by electrostatic or electromagnetic means, the sweep may be rotated by the same means. The sweep is usually rotated electromagnetically in modern radars. As the antenna is rotated past the ship’s heading, the sweep, in synchronization with the antenna, is rotated past the 0˚ graduation on the relative bearing dial of the PPI. The image of any target detected ahead is painted on the PPI at its relative bearing and distance from the center of the PPI. As targets are detected in other directions, their images are painted on the PPI at their relative bearings and distances from the center of the PPI. Up to this point the discussion of how target information is displayed on the PPI has been limited to how the target images are painted, virtually instantaneously, at their distances and relative bearings from the reference ship at the center of the PPI. It follows that through continuous display (continuous because of the persistence of the CRT screen and the pulse repetition rate) of the positions of targets on the PPI, their motions relative to the motion of the reference ship are also displayed. In summary, the indicator of this basic radar system provides the means for measuring and displaying, in a useful form, the relative bearings and distances to targets from which reflected echoes may be received. In displaying the positions of the targets relative to the reference ship continuously, the motions of the targets relative to the motion of the reference ship are evident.
  • 24. 24 FACTORS AFFECTING DETECTION, DISPLAY, AND MEASUREMENT OF RADAR TARGETS FACTORS AFFECTING MAXIMUM RANGE Frequency The higher the frequency of a radar (radio) wave, the greater is the attenuation (loss in power), regardless of weather. Lower radar frequencies (longer wavelengths) have, therefore, been generally superior for longer detection ranges. Peak Power The peak power of a radar is its useful power. Range capabilities of the radar increase with peak power. Doubling the peak power increases the range capabilities by about 25 percent. Pulse Length The longer the pulse length, the greater is the range capability of the radar because of the greater amount of energy transmitted. Pulse Repetition Rate The pulse repetition rate (PRR) determines the maximum measurable range of the radar. Ample time must be allowed between pulses for an echo to return from any target located within the maximum workable range of the system. Otherwise, echoes returning from the more distant targets are blocked by succeeding transmitted pulses. This necessary time interval determines the highest PRR that can be used. The PRR must be high enough, however, that sufficient pulses hit the target and enough echoes are returned to the radar. The maximum measurable range can be determined approximately by dividing 81,000 by the PRR. Beam Width The more concentrated the beam, the greater is the detection range of the radar. Target Characteristics Targets that are large can be seen on the scope at greater ranges, provided line-of-sight exists between the radar antenna and the target. Conducting materials (a ship’s steel hull, for example) return relatively strong echoes while nonconducting materials (a wood hull of a fishing boat, for example) return much weaker echoes. Receiver Sensitivity The more sensitive receivers provide greater detection ranges but are more subject to jamming. Antenna Rotation Rate The more slowly the antenna rotates, the greater is the detection range of the radar. For a radar set having a PRR of 1,000 pulses per second, a horizontal beam width of 2.0˚, and an antenna rotation rate of 6 RPM (1 revolution in 10 seconds or 36 scanning degrees per second), there is 1 pulse transmitted each 0.036˚ of rotation. There are 56 pulses transmitted during the time required for the antenna to rotate through its beam width. With an antenna rotation rate of 15 RPM (1 revolution in 4 seconds or 90 scanning degrees per second), there is only 1 pulse transmitted each 0.090˚ of rotation. There are only 22 pulses transmitted during the time required for the antenna to rotate through its beam width. From the foregoing it is apparent that at the higher antenna rotation rates, the maximum ranges at which targets, particularly small targets, may be detected are reduced. Beam Width Degrees per Pulse ----------------------------------------------------- 2.0° 0.036° --------------- - 56 pulses = = Beam Width Degrees per Pulse ----------------------------------------------------- 2.0° 0.090° --------------- - 22 = = pulses
  • 25. 25 FACTORS AFFECTING MINIMUM RANGE Pulse Length The minimum range capability of a radar is determined primarily by the pulse length. It is equal to half the pulse length of the radar (164 yards per microsecond of pulse length). Electronic considerations such as the recovery time of the receiver and the duplexer (TR and anti-TR tubes assembly) extend the minimum range at which a target can be detected beyond the range determined by the pulse length. Sea Return Sea return or echoes received from waves may clutter the indicator within and beyond the minimum range established by the pulse length and recovery time. Side-Lobe Echoes Targets detected by the side-lobes of the antenna beam pattern are called side-lobe echoes. When operating near land or large targets, side-lobe echoes may clutter the indicator and prevent detection of close targets, without regard to the direction in which the antenna is trained. Vertical Beam Width Small surface targets may escape the lower edge of the vertical beam when close. FACTORS AFFECTING RANGE ACCURACY The range accuracy of radar depends upon the exactness with which the time interval between the instants of transmitting a pulse and receiving the echo can be measured. Fixed Error A fixed range error is caused by the starting of the sweep on the indicator before the r-f energy leaves the antenna. The zero reference for all range measurements must be the leading edge of the transmitted pulse as it appears on the indicator. Inasmuch as part of the transmitted pulse leaks directly into the receiver without going to the antenna, a fixed error results from the time required for r-f energy to go up to the antenna and return to the receiver. This error causes the indicated ranges to be greater than their true values. A device called a trigger delay circuit is used to eliminate the fixed error. By this means the trigger pulse to the indicator can be delayed a small amount. Such a delay results in the sweep starting at the instant an echo would return to the indicator from a flat plate right at the antenna not at the instant that the pulse is generated in the transmitter. Line Voltage Accuracy of range measurement depends on the constancy of the line voltage supplied to the radar equipment. If supply voltage varies from its nominal value, ranges indicated on the radar may be unreliable. This fluctuation usually happens only momentarily, however, and after a short wait ranges normally are accurate. Frequency Drift Errors in ranging also can be caused by slight variations in the frequency of the oscillator used to divide the sweep (time base) into equal range intervals. If such a frequency error exists, the ranges read from the radar generally are in error by some small percentage of the range. To reduce range errors caused by frequency drift, precision oscillators in radars usually are placed in a constant temperature oven. The oven is always heated, so there is no drift of range accuracy while the rest of the set is warming up. Calibration The range to a target can be measured most accurately on the PPI when the leading edge of its pip just touches a fixed range ring. The accuracy of this measurement is dependent upon the maximum range of the scale in use. Representative maximum error in the calibration of the fixed range rings is 75 yards or 11 /2 percent of the maximum range of the range scale in use, whichever is greater. With the indicator set on the 6-mile range scale, the error in the range of a pip just touching a range ring may be about 180 yards or about 0.1 nautical mile because of calibration error alone when the range calibration is within acceptable limits. On some PPI’s, range can only be estimated by reference to the fixed range rings. When the pip lies between the range rings, the estimate is usually in error by 2 to 3 percent of the maximum range of the range scale setting plus any error in the calibration of the range rings. Radar indicators usually have a variable range marker (VRM) or
  • 26. 26 adjustable range ring which is the normal means for range measurements. With the VRM calibrated with respect to the fixed range rings within a tolerance of 1 percent of the maximum range of the scale in use, ranges as measured by the VRM may be in error by as much as 21 /2 percent of the maximum range of the scale in use. With the indicator set on the 8-mile range scale, the error in a range as measured by the VRM may be in error by as much as 0.2 nautical mile. Pip and VRM Alignment The accuracy of measuring ranges with the VRM is dependent upon the ability of the radar observer to align the VRM with the leading edge of the pip on the PPI. On the longer range scales it is more difficult to align the VRM with the pip because small changes in the reading of the VRM range counter do not result in appreciable changes in the position of the VRM on the PPI. Range Scale The higher range scale settings result in reduced accuracy of fixed range ring and VRM measurements because of greater calibration errors and the greater difficulty of pip and VRM alignment associated with the higher settings. PPI Curvature Because of the curvature of the PPI, particularly in the area near its periphery, range measurements of pips near the edge are of lesser accuracy than the measurements nearer the center of the PPI. Radarscope Interpretation Relatively large range errors can result from incorrect interpretation of a landmass image on the PPI. The difficulty of radarscope interpretation can be reduced through more extensive use of height contours on charts. For reliable interpretation it is essential that the radar operating controls be adjusted properly. If the receiver gain is too low, features at or near the shoreline, which would reflect echoes at a higher gain setting, will not appear as part of the landmass image. If the receiver gain is too high, the landmass image on the PPI will “bloom”. With blooming the shoreline will appear closer than it actually is. A fine focus adjustment is necessary to obtain a sharp landmass image on the PPI. Because of the various factors introducing errors in radar range measurements, one should not expect the accuracy of navigational radar to be better than + or - 50 yards under the best conditions. FACTORS AFFECTING RANGE RESOLUTION Range resolution is a measure of the capability of a radar to display as separate pips the echoes received from two targets which are on the same bearing and are close together. The principal factors that affect the range resolution of a radar are the length of the transmitted pulse, receiver gain, CRT spot size, and the range scale. A high degree of range resolution requires a short pulse, low receiver gain, and a short range scale. Pulse Length Two targets on the same bearing, close together, cannot be seen as two distinct pips on the PPI unless they are separated by a distance greater than one-half the pulse length (164 yards per microsecond of pulse length). If a radar has a pulse length of 1-microsecond duration, the targets would have to be separated by more than 164 yards before they would appear as two pips on the PPI. Radio-frequency energy travels through space at the rate of approximately 328 yards per microsecond. Thus, the end of a 1-microsecond pulse traveling through the air is 328 yards behind the leading edge, or start, of the pulse. If a 1-microsecond pulse is sent toward two objects on the same bearing, separated by 164 yards, the leading edge of the echo from the distant target coincides in space with the trailing edge of the echo from the near target. As a result the echoes from the two objects blend into a single pip, and range can be measured only to the nearest object. The reason for this blending is illustrated in figure 1.19. In part A of figure 1.19, the transmitted pulse is just striking the near target. Part B shows energy being reflected from the near target, while the leading edge of the transmitted pulse continues toward the far target. In part C, 1 /2 microsecond later, the transmitted pulse is just striking the far target; the echo from the near target has traveled 164 yards back toward the antenna. The reflection process at the near target is only half completed. In part D echoes are traveling back toward the antenna from both targets. In part E reflection is completed at the near target. At this time the leading edge of the echo from the far target coincides with the trailing edge of the first echo. When the echoes reach the antenna, energy is delivered to the set during a period of 2 microseconds so that a single pip appears on the PPI.
  • 27. 27 Figure 1.19 - Pulse length and range resolution.
  • 28. 28 The data below indicates the minimum separation in range for two targets to appear as separate echoes on the PPI for various pulse lengths. Receiver Gain Range resolution can be improved by proper adjustment of the receiver gain control. As illustrated in figure 1.20, the echoes from two targets on the same bearing may appear as a single pip on the PPI if the receiver gain setting is too high. With reduction in the receiver gain setting, the echoes may appear as separate pips on the PPI. CRT Spot Size The range separation required for resolution is increased because the spot formed by the electron beam on the screen of the CRT cannot be focused into a point of light. The increase in echo image (pip) length and width varies with the size of the CRT and the range scale in use. On the longer range scales, the increase in echo size because of spot size is appreciable. Range Scale The pips of two targets separated by a few hundred yards may merge on the PPI when one of the longer range scales is used. The use of the shortest range scale possible and proper adjustment of the receiver gain may enable their detection as separate targets. If the display can be off-centered, this may permit display of the targets on a shorter range scale than would be possible otherwise. Pulse Length (microseconds) Range Resolution (yards) 0.05 8 0.10 16 0.20 33 0.25 41 0.5 82 1.2 197 Figure 1.20 - Receiver gain and range resolution. CRT Diameter (Inches) Range Scale (nautical mi.) Spot Length or Width (yards) Nominal Effective 9 7.5 0.5 5 24 220 12 10.5 0.5 4 24 185 16 14.4 0.5 3 24 134
  • 29. 29 FACTORS AFFECTING BEARING ACCURACY Horizontal Beam Width Bearing measurements can be made more accurately with the narrower horizontal beam widths. The narrower beam widths afford better definition of the target and, thus, more accurate identification of the center of the target. Several targets close together may return echoes which produce pips on the PPI which merge, thus preventing accurate determination of the bearing of a single target within the group. The effective beam width can be reduced through lowering the receiver gain setting. In reducing the sensitivity of the receiver, the maximum detection range is reduced, but the narrower effective beam width provides better bearing accuracy. Target Size For a specific beam width, bearing measurements of small targets are more accurate than large targets because the centers of the smaller pips of the small targets can be identified more accurately. Target Rate of Movement The bearings of stationary or slowly moving targets can be measured more accurately than the bearings of faster moving targets. Stabilization of Display Stabilized PPI displays provide higher bearing accuracies than unstabilized displays because they are not affected by yawing of the ship. Sweep Centering Error If the origin of the sweep is not accurately centered on the PPI, bearing measurements will be in error. Greater bearing errors are incurred when the pip is near the center of the PPI than when the pip is near the edge of the PPI. Since there is normally some centering error, more accurate bearing measurements can be made by changing the range scale to shift the pip position away from the center of the PPI. Parallax Error Improper use of the mechanical bearing cursor will introduce bearing errors. On setting the cursor to bisect the pip, the cursor should be viewed from a position directly in front of it. Electronic bearing cursors used with some stabilized displays provide more accurate bearing measurements than mechanical bearing cursors because measurements made with the electronic cursor are not affected by parallax or centering errors. Heading Flash Alignment For accurate bearing measurements, the alignment of the heading flash with the PPI display must be such that radar bearings are in close agreement with relatively accurate visual bearings observed from near the radar antenna. FACTORS AFFECTING BEARING RESOLUTION Bearing resolution is a measure of the capability of a radar to display as separate pips the echoes received from two targets which are at the same range and are close together. The principal factors that affect the bearing resolution of a radar are horizontal beam width, the range to the targets, and CRT spot size. Horizontal Beam Width As the radar beam is rotated, the painting of a pip on the PPI begins as soon as the leading edge of the radar beam strikes the target. The painting of the pip is continued until the trailing edge of the beam is rotated beyond the target. Therefore, the pip is distorted angularly by an amount equal to the effective horizontal beam width.
  • 30. 30 As illustrated in figure 1.21, in which a horizontal beam width of 10˚ is used for graphical clarity only, the actual bearing of a small target having good reflecting properties is 090˚, but the pip as painted on the PPI extends from 095˚ to 085˚. The left 5˚ and the right 5˚ are painted while the antenna is not pointed directly towards the target. The bearing must be read at the center of the pip. Figure 1.21 - Angular distortion.
  • 31. 31 Range of Targets Assuming a more representative horizontal beam width of 2˚, the pip of a ship 400 feet long observed beam on at a distance of 10 nautical miles on a bearing of 090˚ would be painted on the PPI between 091.2˚ and 088.8˚, the actual angular width of the target being 0.4˚. The pip of a ship 900 feet long observed beam on at the same distance and bearing would be painted on the PPI between 091.4˚ and 088.6˚, the angular width of the target being 0.8˚. Since the angular widths of the pips painted for the 400 and 900-foot targets are 1.4˚ and 1.8˚, respectively, any attempt to estimate target size by the angular width of the pip is not practical, generally. Since the pip of a single target as painted on the PPI is elongated angularly an amount equal to beam width, two targets at the same range must be separated by more than one beam width to appear as separate pips. The required distance separation depends upon range. Assuming a 2˚ beam width, targets at 10 miles must be separated by over 0.35 nautical miles or 700 yards to appear as separate pips on the PPI. At 5 miles the targets must be separated by over 350 yards to appear as separate pips if the beam width is 2˚. Figure 1.22 illustrates a case in which echoes are being received from four targets, but only three pips are painted on the PPI. Targets A and B are painted as a single pip because they are not separated by more than one beam width; targets C and D are painted as separate pips because they are separated by more than one beam width. In as much as bearing resolution is determined primarily by horizontal beam width, a radar with a narrow horizontal beam width provides better bearing resolution than one with a wide beam. CRT Spot Size The bearing separation required for resolution is increased because the spot formed by the electron beam on the screen of the CRT cannot be focused into a point of light. The increase in the pip width because of CRT spot size varies with the size of the CRT and the range scale in use. WAVELENGTH Generally, radars transmitting at the shorter wavelengths are more subject to the effects of weather than radars transmitting at the longer wavelengths. Figure 1.23 illustrates the PPI displays of two radars of different wavelengths aboard a ship steaming in a rain squall and a choppy sea. Without use of anti-rain and anti-sea clutter controls, the clutter is more massive on the PPI of the radar having the shorter wavelength. Also, three targets, which can be detected on the PPI of the radar having the longer wavelength, cannot be detected on the PPI of the radar having the shorter wavelength. Following use of the anti-rain and anti-sea clutter controls, the three targets still cannot be detected on the PPI of the radar having the shorter wavelength because too much of the energy has been absorbed or attenuated by the rain. Similarly, figure 1.24 illustrates detection of close targets by a radar having a relatively long wavelength and no detection of these targets by a radar having a relatively short wavelength. Figure 1.22 - Bearing resolution.
  • 32. 32 Two identical 8 mile range PPI pictures taken on Raytheon 3 cm. and 10 cm. radars in a rain squall and with a choppy sea. Three ships bearing 225˚, 294˚ and 330˚ shown on the 10 cm. radar right are not shown on the 3 cm. radar left. On both radars the anti-rain and anti-sea clutter devices are switched in. The three ships are clearly visible on the 10 cm. radar right. There are no targets visible on the 3 cm. radar left as the echo power has been absorbed by rain. Reproduced by Courtesy of the Raytheon Company. Figure 1.23- Effects of rain and sea on PPI displays of radars having different wavelengths.
  • 33. 33 Two identical 20 mile range PPI pictures taken on Raytheon 3 cm. and 10 cm. radars showing the effects of sea clutter. On the 10 cm. radar right targets inside the 5 mile range marker are clearly visible. On the 3 cm. radar left the close range targets are missing. On both radars the anti-sea clutter control has been carefully adjusted to remove sea clutter. The close range targets are clearly visible on the 10 cm. right, whereas they are missing on the 3 cm. radar left. Reproduced by Courtesy of the Raytheon Company. Figure 1.24 - Effects of sea on PPI displays of radars having different wavelengths.
  • 34. 34 TARGET CHARACTERISTICS There are several target characteristics which will enable one target to be detected at a greater range than another, or for one target to produce a stronger echo than another target of similar size. Height Since radar wave propagation is almost line of sight, the height of the target is of prime importance. If the target does not rise above the radar horizon, the radar beam cannot be reflected from the target. Because of the interference pattern, the target must rise somewhat above the radar horizon. Size Up to certain limits, targets having larger reflecting areas will return stronger echoes than targets having smaller reflecting areas. Should a target be wider than the horizontal beam width, the strength of the echoes will not be increased on account of the greater width of the target because the area not exposed to the radar beam at any instant cannot, of course, reflect an echo. Since the vertical dimensions of most targets are small compared to the vertical beam width of marine navigational radars, the beam width limitation is not normally applicable to the vertical dimensions. However, there is a vertical dimension limitation in the case of sloping surfaces or stepped surfaces. In this case, only the projected vertical area lying within the distance equivalent of the pulse length can return echoes at any instant. Aspect The aspect of a target is its orientation to the axis of the radar beam. With change in aspect, the effective reflecting area may change, depending upon the shape of the target. The nearer the angle between the reflecting area and the beam axis is to 90˚, the greater is the strength of the echo returned to the antenna. Shape Targets of identical shape may give echoes of varying strength, depending on aspect. Thus a flat surface at right angles to the radar beam, such as the side of a steel ship or a steep cliff along the shore, will reflect very strong echoes. As the aspect changes, this flat surface will tend to reflect more of the energy of the beam away from the antenna, and may give rather weak echoes. A concave surface will tend to focus the radar beam back to the antenna while a convex surface will tend to scatter the energy. A smooth conical surface will not reflect energy back to the antenna. However, echoes may be reflected to the antenna if the conical surface is rough. Texture The texture of the target may modify the effects of shape and aspect. A smooth texture tends to increase the reflection qualities, and will increase the strength of the reflection, but unless the aspect and shape of the target are such that the reflection is focused directly back to the antenna, the smooth surface will give a poor radar echo because most of the energy is reflected in another direction. On the other hand, a rough surface will tend to break up the reflection, and will improve the strength of echoes returned from those targets whose shape and aspect normally give weak echoes. Composition The ability of various substances to reflect radar pulses depends on the intrinsic electrical properties of those substances. Thus metal and water are good reflectors. Ice is a fair reflector, depending on aspect. Land areas vary in their reflection qualities depending on the amount and type of vegetation and the rock and mineral content. Wood and fiber glass boats are poor reflectors. It must be remembered that all of the characteristics interact with each other to determine the strength of the radar echo, and no factor can be singled out without considering the effects of the others.