1. ODA
ASSET MANAGEMENT PROCEDURES
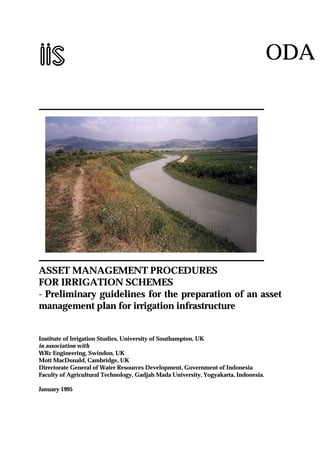
FOR IRRIGATION SCHEMES
- Preliminary guidelines for the preparation of an asset
management plan for irrigation infrastructure
Institute of Irrigation Studies, University of Southampton, UK
in association with
WRc Engineering, Swindon, UK
Mott MacDonald, Cambridge, UK
Directorate General of Water Resources Development, Government of Indonesia
Faculty of Agricultural Technology, Gadjah Mada University, Yogyakarta, Indonesia.
January 1995
3. ASSET MANAGEMENT PROCEDURES
FOR IRRIGATION SCHEMES
- Preliminary guidelines for the preparation of an asset
management plan for irrigation infrastructure
Main subject area: Water and Sanitation
Theme: Improved availability of water for sustainable food production
Project Title: Asset management procedures for irrigation schemes
Project reference: R6078
This document is an output from an ODA-funded research project, carried out for the benefit
of developing countries. The views experessed in this report are not necessarily those of the
Overseas Development Administration.
Institute of Irrigation Studies, University of Southampton, UK
in association with
WRc Engineering, Swindon, UK
Mott MacDonald, Cambridge, UK
Directorate General of of Water Resources Development, Government of Indonesia
Faculty of Agricultural Technology, Gadjah Mada University, Yogyakarta, Indonesia.
January 1995
4. Summary
The report is the result of a six-month project to study Asset Management Planning, a technique
derived from the UK water industry, and to examine its potential application to irrigation in
developing countries. Central to the work was a four month field trial in Yogyakarta, Indonesia, in
which practical procedures were formulated and tested. Experience of this trial enabled the
feasibility of applying the methodology to irrigation to be established and aspects requiring further
research to be identified.
The approach to the project, the reasoning behind it and its execution are described. There is a
review of the origins of Asset Management and a brief examination of the setting within irrigation
which concerns the study. More similarities than differences were found between asset management
for irrigation and that for the UK water industry. These are summarised together with the
implications for transferring the techniques between these two fields of application. Current issues
and initiatives in Indonesia are described as a background to the field trial there.
The application of Asset Management to irrigation is described. Procedures are set out and discussed
for the production and use of an Asset Management Plan (AMP). Each of the steps is described, with
background information, recommendations and examples or illustrations, wherever possible, from
the experiences of the trial in Yogyakarta. Aspects for which the requirements are location-specific
or which will demand particular attention for other reasons, are identified and discussed.
The report concludes that Asset Management Procedures for Irrigation Schemes are feasible and that
the methodology provides a framework for strategic management in the sector. Through the detailed
information provided and the references to the trial, practicability is demonstrated and the extent to
which the ideas are developed is shown. Resource requirements and the logistics of undertaking the
procedures are set out in broad terms. It is recommended that an overall programme for AMP
production of nine to eighteen months may realistically be envisaged. The extension of the
methodology into other areas is considered briefly and further research needs are identified.
Supporting information is given in the Appendices.
5. Acknowledgements
The financial assistance of the Overseas Development Administration (ODA), which enabled this
study to be carried out, is gratefully acknowledged.
Thanks are extended to all those who gave of their time and expertise during the study, particularly
the staff and students of the Faculty of Agricultural Technology, Gadjah Mada University, and the
staff of the Directorate General of Water Resources Development, both in Yogyakarta and in Jakarta.
The authors are especially grateful to Dr. Suprodjo, Dr. Sigit, Dr. Saiful and Ir. Budi for the warmth
of their hospitality in Yogyakarta as well as for their help and advice, and to team in Yogyakarta,
Fauzan Umar and ‘Tining’ Murtiningrum for their excellent assistance.
The logistical support provided in Indonesia by Mott MacDonald International is appreciated and our
thanks go to Mr. Masood Khan, Mr. Chris Brown, Mr. Purnomo Tarmidi and to Mrs. Menny Triono.
Also too for the practical advice that Phil Richardson, Tim Hannan and ‘Mahe’ Mahendrarajah gave
me on technical aspects of the project.
Doug Vermillion of the International Irrigation Management Institute (IIMI), Bill Davidson of
Anglian Water and Keith Howells of Mott MacDonald all very kindly gave the benefit of their time,
as did Prof. Martin Snaith and Dr. Henry Kerali of the University of Birmingham, Highways
Development and Management Project. We are grateful to Ian Makin, John Skutch, Phil McAteer,
Gez Cornish and Tim Forster of HR Wallingford for some valuable discussions in UK and in
Yogyakarta. Many others, who cannot all be named, contributed, and we are grateful for their help.
The contribution made by the four specialists, Jim Perry of Mott MacDonald, Bill Kingdom and
Edward Glennie of WRc, and Ian Smout of Loughborough University of Technology is gratefully
acknowledged.
6. Asset Management Procedures for Irrigation Schemes
CONTENTS
Summary
Acknowledgements
Glossary of Terms
Part I: Concepts
1. Introduction page 1
1.1 Managing Infrastructure - the Contemporary Challenge 1
1.2 Structure of the Report 1
1.3 Background to the Project 2
1.4 Collaborating Organisations 2
1.5 Project Objectives 2
1.6 Underlying Aims 3
1.7 Work Programme 3
1.8 Field Trial 3
2. Asset Management 6
2.1 Definition 6
2.2 Origins in the Water Industry of England and Wales 6
2.3 Essential Features of the Asset Management Plan (AMP) 7
2.4 Statistics in Asset Management Planning 7
2.5 Application to Irrigation - Similarities and Differences 8
2.6 Asset Management for Irrigation in the Indonesian Context 8
Part II: Application - Asset Management Planning for Irrigation
3 Producing the Asset Management Plan 13
3.1 Introduction 13
3.2 Systems Definition 13
3.3 Stratified Random Sampling 15
3.4 Environmental, Legal and Development Context 18
3.5 Performance Assessment 20
3.6 Management Issues 25
3.7 The Asset Survey 27
3.8 The Cost Model 34
4 Using the Asset Management Plan 37
4.1 Presentation of the AMP 37
4.2 Confidence Grades 38
4.3 Financial Modelling 40
4.4 Organisational Adjustments 43
4.5 Applications 44
Part III: Conclusions
5 Arrangements for Implementation 46
5.1 General 46
5.2 Tasks 46
5.3 Staffing 48
5.4 Logistics 48
6. Further Considerations 50
6.1 Institutional Context 50
6.2 Further Research 51
6.3 Application to Other Utilities 51
7. Conclusions 55
References and Bibliography
APPENDICES
A1 Examples of Data Collection Proformae
A2 Examples of Standard Output Forms
A3 Data Transformation Requirements and Database Architecture
A4 Examples of Data Collected in the Field Trial
A5 Research Paper
7. GLOSSARY OF TERMS
Aggregation The extrapolation of results of sampling, taking due account of stratification
and normalisation criteria, to represent all systems together.
Alternative Strategies Mutually exclusive means to achieving a single set of ultimate goals.
Asset Condition A measure of the state of deterioration of an asset from its new condition
against a defined reference scale. This is assessed independently of the ability
of the asset to perform its function (see Asset Serviceability).
Asset Extent The number of assets which exist, counted under various categories describing
assets of similar characteristics and in size bands.
Asset Importance A measure of the potential influence of an individual asset on system
performance due to its position within the system.
Asset Management Plan (AMP) A comprehensive report on a piece of infrastructure, prepared in accordance
with a prescribed format, setting out the nature and extent of the assets
concerned, their value and the liabilities associated with each. In order to
present this information in a meaningful way, the report will necessarily set out
a plausible plan of investment related to the sustained achievement of a
satisfactory service to users.
Asset Serviceability The ability of the asset to perform its function(s). Measured on a scale by
reference to appropriate functional definitions.
Asset Stock, Condition and
Serviceability Profiles
A report detailing the extent of assets, their size (by band) and MEA value, both
‘gross’ and ‘net’ (depreciated - allowing for condition). Condition and
Serviceability Profiles are given by reporting the value of assets (by gross MEA)
in each condition grade and in each serviceability grade respectively. Provides
a clear summary of the current state of the asset stock. (See also ‘Modern
Equivalent Asset Value’ - MEA).
Asset Survey The inspection of assets in the field to determine (or confirm) their physical
attributes, condition and serviceability.
Asset Types and Components
Depreciation Categories
The grouping of asset types and components thereof on the basis of similar
rates of deterioration from new condition to a degraded state.
Asset Value The value of an asset based on its replacement cost or MEA (see also ‘Modern
Equivalent Asset Value’). Reported both as ‘gross’ and ‘net’ (depreciated)
value.
Band A continuous range of values from a lower to an upper limit.
Budget Planning and
Investment Priorities
The allocating of ‘baskets of money’ to identified types of investment activity
over a short term (5 year) planning horizon but in conformity with the long
term strategic business plan arrived at as a result of the financial modelling
process.
CAPEX Capital Expenditure.
Capital Investment Activities
Unit Cost Index
A ‘look-up table’ of unit prices at current rates for rehabilitation, upgrading
and extension works (e.g. ‘replace gates’, ‘re-line canals’, ‘repair wingwalls’
etc.) related to each asset type and size band. Facilitates the rapid build up of
cost estimates for any identified investment need.
Capital Planning The process of defining the capital investment requirements implied by the
preferred investment strategy and established from the financial model. To
achieve this it is necessary to know the cost stream, to examine the income stream
and to consider the flow of capital.
Components Each asset comprises a number of component parts. Their identification
facilitates condition assessment when different components may be subject to
different degrees of deterioration.
8. Condition See ‘Asset Condition’
Condition Grade An indicator, on a defined scale from ‘Good’ to ‘Bad’, of the state of
degradation of an asset from new. See also ‘Asset Serviceability’.
Cost Model A reference data-base for use in the preparation of the AMP and for the
comparison of alternative investment strategies in the subsequent financial
modelling process. Costs related to each asset type and size are needed to value
existing assets (Modern Equivalent Asset); to provide unit costs for system capital
investment activities; and to quantify operational costs.
Cost Recovery The matching of revenue levels to the actual cost of providing the service over
the long term.
Daerah Irigasi (DI) An Indonesian term used to define an irrigation network. The area may range
from a few to several thousand hectares. A DI is often characterised as an
irrigation network offtaking from a weir or a river.
Demand The demand placed on the service. The demand may change over time,
resulting in changes to the infrastructure requiring additional investment.
Engineering Studies Studies required to relate system performance to the characteristics of the
infrastructure and thus to establish the extent of work needed to maintain
and/or improve asset condition and system performance.
Existing Performance Quantifies the existing performance of the system. The gap between the
existing performance and the target (Standards) identifies the performance gap
that is to be narrowed through further investment.
Extent See ‘Asset Extent’.
Financial Model A process of reviewing and refining the provisional ideas presented in the
AMP to ensure a realistic investment strategy in terms of funds available
including identifying any necessary CAPEX/OPEX trade-offs.
Function See ‘Asset Serviceability’.
Importance Band See ‘Asset Importance’
Investment Activities The specific activities (e.g. items of construction work) for which the investment
is intended to pay and which are essential to achieve the investment objectives.
Investment Benefits The intended benefits, in terms of improved levels of performance under
acknowledged criteria, associated with specific investments.
Irrigation Service The people, organisation and infrastructure that together provide to users all
the services associated with irrigation (including drainage).
Irrigation Service Fee (ISF) A charge to users of the irrigation service intended to reflect the real costs of its
provision.
Modern Equivalent Asset
Value (MEA)
The cost, at current prices, of a modern asset of equivalent function, not
necessarily replicating the existing asset in precise detail.
Needs Based Budgeting
(NBB)
The attempt to allocate annual budget provisions on the basis of clearly
identified investment needs rather than on some arbitrary or nominal
apportioning measure.
Normalisation The process of reducing system characteristics, especially costs, to a common
unit measure such as cost per unit irrigated area, number of structures per unit
irrigated area, etc. Normalised values of quantities or costs can then be used to
derive numbers and/or costs for schemes of different sizes.
O&M Operation and Maintenance.
Operating Costs The costs of operating (including routine maintenance - see definition) the
9. system over the budgeting horizon.
OPEX Operating Expenditure.
Performance Assessment A series of stages in which the performance of a system, in terms of ‘output
measures’, is compared with targets and the reasons for differences identified.
Performance Target See ‘Standard(s)’
Policies Declared intentions against which an organisation expects its achievements to
be measured.
Primary Canal The main supply canal at the top of an irrigation system from its intake to the
division into a number of Secondary Canals
Privatisation The transfer of ownership and management of infrastructure assets and the
service they support from the public sector into private hands
Revenue The income received to pay for the service provided.
Routine Maintenance Costs Costs associated with regular and frequent activities intended to keep assets
operational and in a good state of repair.
Scheme The complete operation including the infrastructure and all those people and
other influences involved in its operation and use. An irrigation scheme
includes the ‘system’, the farmers and operators, the land/soil, the crops, the
market etc. (see also ‘System’).
Secondary Canal One of a number of secondary canals which convey water from the main
Primary Canal of an irrigation system to several ‘tertiary’ offtakes
Serviceability See ‘Asset Serviceability’.
Serviceability Grade An indicator of the ability of an asset to perform its function(s) on a defined
scale from ‘Fully Functional’ to ‘Ceased to Function’.
Size A measure associated with each asset type which gives an indication of its scale
and hence its monetary value.
Standard(s) The intended level(s) of performance - i.e. the ‘Target(s)’
Strata See ‘Stratification’.
Stratification The statistical procedure of dividing a diverse collection of systems into groups
(termed Strata) having common characteristics from which representative
samples can be taken.
System The infrastructure itself or engineering hardware, separated from other
influences (see also ‘Scheme’).
Technical Level
(of an irrigation system)
A classification method used in Indonesia to define the degree of control and
measurement of flow which is possible in a system due to its design and
construction. Three levels are used: Technical - full control and measurement
at all divisions/offtakes; Semi-technical - full control and measurement at
selected points only in the system; Non-technical - no measurement of flow
within the system and control, if any, using simple structures only.
Tertiary Canal The canal conveying water from a Secondary Canal offtake to Quartinary
Canals and thus to the field.
Tertiary Unit A grouping of fields, generally totalling between 30 to 150 ha, which are served
by a single offtake from the Secondary (or, occasionally, the Primary) Canal.
Management and control of water distribution within the Tertiary Unit is
usually the responsibility of the water users.
Turnover The transfer of responsibility for operation and maintenance (of an irrigation
system) to a farmer group or Water Users Association.
12. Jim Welch/Asset Management - Irrigation/Sep-95 1
1. Introduction
1.1 Managing Infrastructure - the Contemporary Challenge
It is a characteristic of modern technological society that, as ‘development’ continues, so dependence
upon networks of artificial infrastructure increases. Transportation, telecommunications, energy
distribution, water and sewerage systems (for instance) have become essential to the ability of our
societies to function ‘normally’. These facilities and the depth of our reliance on them, have grown at
an unprecedented rate in recent decades. Invariably they have been accumulated over a long period on
a project-by-project basis, the cost of each project being justified by the particular need it satisfied.
As the stock of infrastructure assets thus accumulates, a creeping maintenance liability accrues and
this eventually dominates the requirement for resources. Society expects the continuation or
improvement of the service to which it has grown accustomed and value for money is demanded. The
old ‘project’ approach which served so well for past development is found to be inadequate to the
emerging task. New methodologies are needed to provide a clear overview of objectives, options,
benefits and competing needs and to resolve these into a comprehensive strategy for investment The
institutions responsible for management of the infrastructure may themselves need reform. This
phenomenon is quite dramatically illustrated by recent privatisations of public infrastructure in the UK
and elsewhere.
The challenge facing irrigation is at least as great as that in other sectors. The following quotation is
illustrative (Rabindranath, 1993):
“Irrigated agriculture is up against an enormous challenge. Global population continues to
grow at a tremendous rate... Water is becoming increasingly scarce... The most attractive
irrigation sites have already been exploited. Yet, irrigated agriculture will have to deliver
average output increases of at least 3.5% per year if future food demands are to be met.”
The era of the Green Revolution saw the large scale development of irrigation schemes. That era of
new construction is past. The challenge now is to maintain existing infrastructure and to improve it in
terms of water-use efficiency and of cost-effectiveness. This challenge sets the context of the report.
1.2 Structure of the Report
The report is centred on a project set up to study Asset Management Planning, a technique derived from the
UK water industry, and to examine its potential application to irrigation. In Part I the concepts are set
out. The approach to the project, the reasoning behind it and its execution are described. There is a
review of Asset Management and of the setting within irrigation which concerns the study. Current
issues and initiatives in Indonesia are described as a background to the field trial there. Part II
describes the application of Asset Management to irrigation. Procedures are set out and discussed for
the production and use of an Asset Management Plan (AMP). These were devised in the course of the
study based on its findings and, importantly, on the experiences of the field trial. The report
concludes, in Part III, with reflections on the benefits of the AMP, how these can be mobilised and on
13. Jim Welch/Asset Management - Irrigation/Sep-95 2
some practicalities of implementation. The extension of the methodology into other areas is
considered briefly and further research needs are identified. Supporting information is given in the
Appendices.
1.3 Background to the Project
The project is a feasibility study led by the Institute of Irrigation Studies with funding from the British
Overseas Development Administration (ODA Project R6078). The author worked on the project
throughout its six-month programme which included a four-month field trial based in Yogyakarta,
Indonesia. Collaborators in Indonesia were funded by the Indonesian Department of Public Works.
The research hypothesis is that Asset Management procedures and techniques developed and used in
the water supply and sewerage industry of England and Wales, at the time of privatisation in 1989 and
since, can be adapted for application to irrigation in many developing countries. A pressing need
exists for a framework which integrates diverse considerations in the approach to investment planning
in the irrigation sector. It is proposed that Asset Management can provide exactly such a framework.
Thus it has potential benefit for water users, for irrigation managers, funding agencies, tax-payers and
for the environment.
1.4 Collaborating Organisations
The following organisations collaborated in the execution of the study:
Institute of Irrigation Studies, University of Southampton, England (Lead).
WRc, Swindon, England.
Mott MacDonald, Cambridge, England.
Department of Public Works, Directorate of Water Resources, Government of Indonesia.
Faculty of Agricultural Technology, University Gadjah Mada, Yogyakarta, Indonesia.
1.5 Project Objectives
The overall aim of the project has been to ascertain the potential for transferring and adapting the
methodology concerned and, based upon these findings, to identify longer term research needed to
formulate detailed procedures for Asset Management within the irrigation sector in developing
countries. Thus the objectives were to:
• study Asset Management procedures in the UK water industry
• consider these in the context of irrigation in developing countries
• formulate ideas for the transfer and adaptation of the methodology
• review these ideas in the light of a trial under real conditions in Indonesia
• prepare provisional guidelines for Asset Management procedures in irrigation
• identify key aspects where further research is required.
14. Jim Welch/Asset Management - Irrigation/Sep-95 3
1.6 Underlying Aims
It is important at the outset to identify the intended purpose of applying Asset Management to
developing country irrigation. The methodology was originated in response to some very specific
needs of privatisation in the UK context under social, financial and institutional conditions which, it is
recognised, do not prevail in many countries. In the English and Welsh water industry, the objectives
of the first Asset Management Plan (AMP1) were (i) to inform potential investors whilst (ii) providing
assurances that appropriate levels of investment were intended to be made in unseen underground
assets of crucial national importance and that the resulting charges to customers would be reasonable.
The introduction of Asset Management into irrigation is seen as having the following aims:
• To help achieve more cost-effective management of the infrastructure.
• To this end, to enable managers to make better-informed investment decisions which have a
clear basis of justification and which can be audited or replicated.
• To facilitate turnover of assets from central government control where desired.
• To provide a cost-effective technique for calculating irrigation service charges based on a
realistic assessment of the costs of sustaining the supply of water.
• To facilitate comparative performance assessment.
For the purpose of the project the desirability of these objectives is taken as self-evident.
1.7 Work Programme
Work on the project formally commenced on 1st July 1994. The first month was spent studying the
origins and techniques of Asset Management in the water industry of England and Wales and then
reviewing the needs of irrigation management against this background. Of the four months in
Indonesia, the first two weeks or so were occupied in formulating skeletal procedures and in planning
their trial. An outline programme for the field trial, as drawn up at that time, is shown in Figure 1.1.
The two weeks prior to leaving Indonesia were used to prepare papers and presentations for a
workshop held in Yogyakarta at the University Gadjah Mada (UGM).
A meeting of specialists from the collaborating organisations, to review the findings of the field trial
and to consider their implications, took place in England early in December. The final month of the
project was devoted to writing up the work.
1.8 Field Trial
1.8.1 Nature of the trial
The object of the trial was to use actual conditions prevailing in Indonesia both as a proving ground
for the development of practical procedures and as a stimulant to wider thought. The focus of
attention had therefore to be on checking the practicability of methods for Asset Management Plan
(AMP) production and on exploring potential problems rather than on actually producing an AMP.
15. Jim Welch/Asset Management - Irrigation/Sep-95 4
AUGUST SEPTEMBER OCTOBER NOVEMBER
week commencing 8 15 22 29 5 12 19 26 3 10 17 24 31 7 14 21 28
Specialists Visits Bill Kingdom
Jim Perry
Ian Smout
Martin Burton
Summary Develop skeletal procedures
Cost Model
Stratification and Normalisation
Database design, Input and Output Forms
Select sample DI ⇔
⇔ ⇔ ⇔ ⇔ ⇔ ⇔ ⇔ ⇔ ⇔ ⇔⇔
Collect data
Analysis and Confidence limits
Strat/Norm & Conf data sent to UK
Draft Report/Guidelines
⇔ ⇔ ⇔ ⇔ ⇔ ⇔ ⇔ ⇔ ⇔ ⇔
⇔.
⇔
⇔ ⇔ ⇔ ⇔
Cost Model (from PRIS/consultants records)
”Pie chart” asset value by type across all DIs
Extract data on value for each major asset type
Estimate figures for all other asset types
“Pie chart” rehab costs by rehab activity
category
Extract rehab costs for each major category
Estimate rehab costs for other rehab activities
Stratification and Normalisation (from PRIS info)
Collect DI stratification data
Select strata
Demonstrate “sample DI “ selection and
clustering
⇔ ⇔ ⇔ ⇔ ⇔ ⇔ ⇔ ⇔ ⇔ ⇔ ⇔ ⇔ ⇔ ⇔ ⇔
Database
Design Output Forms
Design all Input Forms
Database design ⇔ ⇔ ⇔ ⇔ ⇔ ⇔ ⇔ ⇔ ⇔ ⇔
System Performance Assessment
Collect data (1) - from PRIS
(2) - from field.
Analyse for “Standard” and “Level” of service
Asset Valuation (working from Cost Model)
Relate value to “size” for each asset type
Regression tests to decide on best size measure
Apportion each asset value amongst components
⇔ ⇔ ⇔ ⇔ ⇔ ⇔ ⇔ ⇔ ⇔
Asset Survey - Extent, Condition and
Serviceability
Field trials of Survey Forms
Collect asset data
Review of System Engineering Study:
Acquire and study Report on rehab needs
Breakdown rehab costs by time, asset type, imp.
Categorise rehabilitation “Activities”
Categorise rehabilitation “Benefits”
Analysis and Reporting:
Statistical observations report (from UK)
Gather info. on related work in Indonesia
Estimate workload for full AMP
Write Reports
⇔ ⇔ ⇔ ⇔ ⇔ ⇔ ⇔ ⇔ ⇔
⇔ ⇔ ⇔
⇔ ⇔ ⇔
⇔ ⇔ ⇔
⇔ ⇔ ⇔
⇔ ⇔ ⇔
⇔ ⇔ ⇔
⇔ ⇔ ⇔
⇔ ⇔
⇔
⇔ ⇔ ⇔
⇔ ⇔ ⇔
⇔ ⇔ ⇔
⇔ ⇔ ⇔
⇔ ⇔ ⇔ ⇔ ⇔ ⇔ ⇔ ⇔ ⇔ ⇔ ⇔ ⇔ ⇔ ⇔ ⇔
⇔
⇔ ⇔
Project Closure Prepare for Workshop
Hold Workshop
Debriefing meetings
Figure 1.1 ASSET MANAGEMENT FOR IRRIGATION - FIELD TRIAL WORK PROGRAMME
16. Jim Welch/Asset Management - Irrigation/Sep-95 5
The author was assisted by a graduate civil engineer from the Department of Public Works (DPU) and a
final year student of agricultural engineering from UGM, each with inputs of about seven weeks (see
‘Acknowledgements’). Senior staff at UGM and DPU and visiting expatriate specialists provided
guidance and advice. A number of meetings were held in order to seek the ideas and opinions of others
involved locally in irrigation matters (consultants, DPU staff and UGM staff).
1.8.2 Irrigation in Yogyakarta Special Province
Yogyakarta Special Province (Daerah Istimewa Yogyakarta - DIY) lies south of Central Java between
the active volcano Mount Merapi to the north and the Indonesian Sea to the south. Its western border is
delineated by a line of subsidiary mountains whilst to the east is the elevated karst area of the Wonarsari
Plateau. The hydrology of the province is dominated by two major rivers, the Kali Progo to the west and
the Kali Opak, which flows below the escarpment of the Wonasari plateau, to the east.
The area recorded as under command in the province is just under 70,000 ha. Most of this lies to the
south of the Mataram Canal which transfers flow eastwards from the Kali Progo, via the northern
suburbs of Yogyakarta, eventually draining into the Kali Opak. This canal, which is about 30 km long,
supplies the Van der Wijck scheme (5000 ha) and allows the flow in several smaller rivers to be
supplemented. These in turn feed a large number of small irrigation schemes amounting to a total of
about 12,000 ha. Whilst the Mataram Canal serves the left bank of the Kali Progo, the right bank is
served by the Kalibawang Canal. This supplies the Kalibawang scheme (1750 ha) and supplements flow
to a further 4000 ha or so.
1.8.3 The Sample System - DI Papah
System Daerah Irigasi (DI) Papah serves an area of around 900 ha on the west (right) bank of the Kali
Progo. It draws its water from a weir (Bendung Papah) on the Kali Papah, which is one of those rivers
whose flow is supplemented from the Kali Progo via a branch of the Kalibawang Canal. The DI had
recently been the subject of an engineering study (as part of a ‘Priority Area’ associated with the Sermo
Dam Project) as a result of which capital investment had been recommended to ‘improve’ and to
‘extend’ system performance. The consequent construction contract was 15% complete at the
commencement of the trial. These facts made selection of the DI attractive for the following reasons:
• The system could be observed largely in its ‘unimproved’ state.
• Since it was dry, its assets could be inspected without causing disruption.
• Insight into the requirements for ‘Engineering Studies’ within the AMP process could be gained
from that already completed for this system.
17. Jim Welch/Asset Management - Irrigation/Sep-95 6
2. Asset Management
This chapter introduces the concept of asset management and sets out its origins in the UK water
industry. Essential features of the Asset Management Plan are listed and the role of statistics in
compiling the Plan is described. Considering the application of the technique to irrigation, similarities
and differences with the UK water industry are noted and the Indonesian context examined.
2.1. Definition
The term ‘Asset Management’ has its origins in the world of finance and business. Assets are “the entire
property of all sorts belonging to a merchant or to a trading association” (Chambers Twentieth Century
Dictionary). Whatever the reason for ownership, asset management is intended to maximise the benefits to
the owner (i.e. the return on investment) through trading, servicing or extending assets at the most
appropriate time. This requires a comprehensive knowledge of the assets and what affects their value.
Applying the term ‘asset management’ to engineering infrastructure is a relatively new concept. An
obvious link lies in businesses regarding their buildings (offices, factories, warehouses etc.) as they
would any other asset. The immediate benefits of the approach lie in the clarity which it brings. The
focus is essentially on investment efficiency and on the contribution of assets to ‘Output Performance’
(service to the customer). At the same time, being prepared and presented in a structured manner, it
facilitates scrutiny (or ‘auditing’) at the outset by all interested parties (described as ‘stakeholders’) be
they users, investors, staff members, the government or society as a whole. Thereafter it enables
performance monitoring against the same criteria and facilitates comparative performance assessment.
Asset Management, in this context, is defined as a structured and auditable process for planning
investment in infrastructure in a sustainable manner, to provide users with a reliable service.
2.2 Origins in the Water Industry of England and Wales
Preparatory to privatisation in 1989 there was an urgent need to quantify the extent, nature, condition
and value of the infrastructure whose ownership it was intended to transfer from the public to the private
sector. Of this infrastructure (e.g. pipes, sewers, treatment works etc.), referred to as ‘the assets’, 70%
was underground and there was much speculation about its true condition. The requirement was to
inform investors of their opening assets and liabilities in a manner that could be independently certified.
Simultaneously, the public and the government needed to be assured that assets would not be ‘stripped’;
that is to say, that the intended investment after privatisation would be adequate to sustain an appropriate
standard of service. Furthermore, since the new water companies would each have a geographic
monopoly, charges to customers had to be demonstrated to be neither excessive nor subject to temporal
fluctuations.
The device developed for this purpose became known as the Asset Management Plan (AMP). This has
since evolved to become a comprehensive strategic business plan and indeed was described as such at
the time the second AMP was produced (AMP2) in 1994. The first (1989) AMPs were prepared in
18. Jim Welch/Asset Management - Irrigation/Sep-95 7
eighteen months and identified investments, across ten major water and sewerage companies, of some
£24 billion. Currently AMPs are prepared on a five year cycle and have a twenty year strategic time
horizon. Budget plans (from which consumer charges are derived) are set out for the first five years.
2.3 Essential Features of the Asset Management Plan (AMP)
Asset Management Plans are prepared within a regulatory framework in which charges to customers and
standards of service are subject to the scrutiny of the government regulator, known as OFWAT (Office
of Water Regulation). They must therefore follow a common format so that companies can be compared
with each other and, subsequently, the actual performance of each can be reported and evaluated against
that company’s plan. The key elements are set out in Table 1.1.
Table 1.1 Key Elements of the Asset Management Plan
Definition of Procedures The detailed methodology used in producing the AMP set out so
that it can be traced and independently audited.
Standards and Policies Standards are the benchmarks against which achieved
performance is to be measured. Policies set out the company’s
approach to investment decision making.
Existing Performance The level of service currently provided under each output
performance measure against the declared Standard.
Asset Extent, Value,
Condition and
Serviceability
A report summarising what assets exist under various category
headings, their ‘Modern Equivalent Asset’ value, their current
condition and functional serviceability
Long term (20 years)
Investment Plans
The investment need identified through engineering studies to
rectify performance shortfalls and to extend or improve the
service to meet demand.
Programme of planned
Activities accounting for
the Investment
A schedule of specific works identified in the engineering
studies as requiring to be undertaken, showing when it is
intended to implement them.
Programme of
Performance Benefits
accruing from the
Investment
A report of how the investment will be rewarded by
improvements in performance over time against the declared
targets.
Short term (5-year)
Expenditure programme
Budgets for the first five years and how these are arrived at.
Operating Costs A summary of the company’s operating costs consistent with its
capital expenditure programme.
Revenue Requirements The implications of the Plan for customer charges.
2.4 Statistics in Asset Management Planning
Although theoretically optional, the use of statistics is seen as central to practical implementation of
asset management planning. The methods concerned have been developed and refined in response to the
practical needs of the water industry in England and Wales from the time of producing the first AMP in
1989. Each company has complex systems of supply mains and sewers totalling several thousand
kilometres. Constraints on time and resources prohibited a comprehensive survey of assets, 70% of
which are underground. Estimates of the investment required on all systems had to be prepared from
knowledge of some of them. Statistical methods were developed (i) to choose the systems to be
investigated and (ii) to estimate the total investment needs from the findings in individual systems.
19. Jim Welch/Asset Management - Irrigation/Sep-95 8
Two main methods were used by the Water Authorities: Stratified Random Sampling, and the Bayes
Linear Estimator (BLE). Of the ten former Water Authorities in England and Wales, one used the BLE
for their 1989 AMP while the majority used Stratified Random Sampling. For their second AMP in
1994, approximately half the companies used the BLE, through specially written computer software.
The BLE is a relatively complex tool which makes the best use of good quality information where it
exists. However, it requires specialised statistical skills that are not widely available. It is necessary that
a statistician be employed to design the statistical aspects of the survey. Stratified Random Sampling is
a well known statistical method throughout the world. For this reason, only Stratified Random Sampling
has been considered in this study.
2.5 Application to Irrigation - Similarities and Differences
A comparison between the characteristics of irrigation and those of the UK water industry was fundamental to
the project. A provisional approach to asset management planning for irrigation systems had to be
formulated in planning the field trial and this provided a sharp practical focus for consideration of the
key issues. More similarities than differences were found and these are summarised in Table 1.2.
2.6 Asset Management for Irrigation in the Indonesian Context
The irrigation sector in Indonesia has seen a number of specific initiatives taken in response to the
changing challenges faced in managing the infrastructure. In October 1987 the Government of Indonesia
(GOI) set out new policies, on a 15 year planning horizon, for greater efficiency in operation and
maintenance (O&M) of irrigation systems and for the recovery, direct from beneficiaries (i.e. the water
users), of O&M costs. The implementation of these policies has been aided by projects promoted by the
World Bank (the Irrigation Sub Sector Project, ISSP) and the Asian Development Bank (the Integrated
Irrigation Sector Project, IISP) in a number of phases. Some elements of these and related initiatives,
which are relevant to the study outlined in this dissertation, are as follows:
(1) Needs based budgeting (NBB)
(2) Irrigation Service Fee (ISF)
(3) Turnover Programme (PIK)
(4) Efficient Operation and Maintenance (EOM)
(5) Programming and Monitoring System (PMS)
(6) Integrated Basin Water Resources Management (WRM)
(7) Project Benefit Monitoring and Evaluation (PBME)
(8) Cost Effective Rehabilitation and Modernisation of Irrigation Schemes research study
The essence of each of these initiatives is briefly summarised in the following sections.
20. Jim Welch/Asset Management - Irrigation/Sep-95 9
Table 1.2 Comparison between AMP for Irrigation and that for UK Water Industry
Key similarities Key differences
(i) Large number of systems and assets. As with water supply there are a considerable
number of systems, and assets within those systems. Consequently it is not cost effective to
undertake detailed studies of all systems and assets to obtain an overall investment profile.
Some form of sampling and extrapolation is required.
(ii) Assets operate as hydraulically definable systems. As with the water supply and
wastewater functions an irrigation network is an hydraulic system which requires physical
assets to convey and control water from a source to the end user. It is therefore
appropriate to break the total study into a number of separate, hydraulically definable
units on which to undertake sample detailed studies for subsequent extrapolation.
(iii)Assets can be given a condition ranking. Assets can be inspected and given a
condition ranking, thus enabling assessments to be made of investment needed to maintain
or enhance overall system condition.
(iv)Assets perform a defined function. As such their function can be identified and their
serviceability quantified, enabling performance ranking.
(v) Cost models can be prepared. Cost models can be developed to prepare asset
valuations
(vi)Long term investment needs must be determined. These are required in order to plan
budgetary allocations for a sustainable service and to set water charges.
(vii)Customer/supplier relationship. Irrigation has customers who are increasingly
involved in decision making on the running of their irrigation systems and on how to pay
for the provision of irrigation water. Over time they can be expected to become
increasingly discerning and to expect higher standards of service at reduced costs.
(viii)Geographical monopolies. Both water supply/wastewater and irrigation utilities
have geographical monopolies. Use of asset management procedures allows comparison
of performance between geographical zones.
(ix)Asset stripping. Concern over “asset stripping” by farmers of privatised irrigation
water companies are relevant. Failure to monitor investment levels and condition profiles of
‘turned over’ or privatised units may result in government being faced with a significant
and unexpected investment after failure of such schemes.
(i) Influence of management. In irrigation there is found to be a much greater influence
of management on the performance of the systems. In formulating asset management
procedures for irrigation it is necessary to separate out clearly the influences of management and
of infrastructure (assets) on the overall performance of an irrigation scheme.
(ii) Irrigation performance indicators are not as well defined. Indicators must reflect the
constraints on an irrigation system. Setting appropriate indicators of infrastructure
performance needs careful thought. The key indicators identified so far relate to adequacy
and equity. In each case the study will need to question whether poor performance on
either or both indicators is truly due to the infrastructure (assets). Though not strictly an
output performance measure, a further indicator related to asset condition has been
proposed as a means to ensure adequate asset maintenance is being carried out over time.
(iii)Discretionary and statutory levels of performance. It is interesting to note that there
are few, if any, statutory levels of service stipulated for the irrigation sector, rather they are
discretionary (i.e. not stipulated by law). This makes the determination of appropriate
standards of service more difficult. Ideally, they would best be decided through some
process of user-consultation or cost-benefit analysis.
(iv)Customer Service Standards. Customer service standards are formal measures of an
agency’s performance in responding to queries from the customer. At present, unlike in
the UK water industry, this feature is not often found in the irrigation sector.
(v) Access to water. In a water supply network the use of pressurised, looped, piped
systems allows inadequate performance of individual parts of the system to be
compensated for by other parts, leading to no noticeable degradation in the overall
performance of the system. In a gravity fed irrigation system the malfunction of an asset in
the upstream reaches of the system can have a major impact on the downstream users.
Assets higher up the system are thus generally more “important“ than those at the bottom
end of the system. This can be captured through an importance ranking and used as one
way of presenting the investment need i.e. investment reported by importance category. This
allows planners to see the effect of different levels of capital expenditure related to the
importance of assets needing to be refurbished.
Source: Adapted from W. Kingdom, WRc, in Project Interim Report No. 1, August 1994
21. Jim Welch/Asset Management - Irrigation/Sep-95 10
2.6.1 Needs Based Budgeting (NBB)
Annual maintenance budgets were at one time disbursed from central funds to local provincial, section
(Cabang Dinas) and sub-section (Ranting Dinas) agencies in proportion to the irrigated area served by
systems within the jurisdiction of each. This approach was inadequate in the face of increasing demands
for greater efficiency in targeting investment. Needs Based Budgeting changed this by requiring specific
needs to be identified by local O&M staff when seeking their budget allocation. However, budget
requests calculated in this way have far exceeded the funds made available. Little or no information is
provided to enable the balancing of priorities identified by staff in one area against those in another area.
Planning horizons are short term or immediate and no meaningful relationship can be made between
investments proposed and the benefits which will justify them.
2.6.2 Irrigation Service Fee (ISF)
A programme to introduce a charge to water users which reflects the costs of providing the irrigation
service is in course of implementation. Its introduction to a particular area depends upon the existence
of an effective Water Users Association (WUA - or P3A in Indonesian) with whom negotiations can take
place and who, it is intended, will administer collection of the fee from individual farmers. The
underlying concept of the ISF programme is that the beneficiaries, through the WUA, should bear the
cost of operating and maintaining the irrigation system which serves them. However, payment is also
linked to ability to pay through a complex formula that takes into account harvest yields. The following
implications are apparent:
• ISF is calculated based on a scheme’s annual Needs Based Budget for O&M.
• ISF can be expected to vary from year to year as maintenance needs vary.
• The level of ISF will be different for each irrigation scheme and these differences could be
substantial. Where this occurs on adjacent schemes, neighbouring farmers will experience
apparently inequitable charges.
• The ‘ability to pay’ formula means that a scheme’s revenue, as a proportion of its assessed need,
will vary. This variation will be subject to the full range of influences in the agricultural system
as a whole.
2.6.3 Turnover Programme (PIK)
This involves the transfer of responsibility for irrigation infrastructure from the government agency to
Water User Associations. It is also dependent, therefore, upon the prior formation of effective WUAs.
Its not clear whether ownership of the assets themselves is actually transferred (i.e. they are removed
from the government’s inventories); the process was held up for some time because of uncertainty over
the legal status of WUAs. The programme aims ultimately to turnover all irrigation schemes serving
areas of 500 ha or less: its introduction is being phased by applying it initially to the smallest schemes
(e.g. in Yogyakarta province, to schemes of 75 ha or less). Generally the deal includes the
implementation of improvement works at government expense prior to turnover taking effect. Progress
is therefore dependent upon the availability of funds as well as on the stage of development of WUAs.
22. Jim Welch/Asset Management - Irrigation/Sep-95 11
2.6.4 Efficient Operation and Maintenance (EOM)
This programme aims to break the cycle of neglect followed by expensive rehabilitation which has
apparently been the norm for much of the irrigation infrastructure. Individual schemes (Daerah Irigasi)
are brought into the EOM programme through a process of physical improvement to the infrastructure
(termed ‘Special Maintenance’), changes to organisation and procedures, staff retraining and the
establishment of a “realistic O&M budget”. The streamlined section office of the irrigation service,
responsible for a number of EOM schemes, is termed an Advanced Operations Unit (AOU). A range of
thirteen performance indicators has been developed for monitoring the schemes concerned.
2.6.5 Programming and Monitoring System (PMS)
The PMS is a computer based Management Information System currently being implemented under
ISSP-II in pilot areas in Central and East Java. Its object is to improve the process of needs-based
budgeting and prioritising for maintenance activities (and also to provide operation and hydrological
information) based on data generated through operational procedures. It incorporates an asset database
which will include detailed information on present condition of each asset and its importance within the
system. Summaries from the information systems for each DI will be provided to the Provincial
Irrigation Service office (PRIS) as an aid to strategic planning. Data will be entered on desk-top
computers at field offices and updated, it is envisaged, on a regular basis whilst information will be fed
back to PRIS on dedicated data-links. Implementation rate will therefore be constrained by the
expenditure required to introduce the necessary technical hardware and the training of operators. Its
effectiveness as an aid to strategic planning will depend upon how the huge amounts of detailed
information are to be summarised, interpreted and used and on the quality of that information, its
accuracy and how well it is kept up to date.
2.6.6 Integrated Basin Water Resources Management (WRM)
This initiative reflects the GOI’s recognition of the place of water as an economic good within an overall
programme for sustainable national development. Previous planning was strongly project-oriented
largely focusing on irrigation and power development. Ongoing studies recognise the range of river
basin uses from the supply of water for consumption, industry, agriculture and power generation, to the
disposal of wastes and the extraction of river gravel for example. The objective is principally to achieve
efficient and reliable day-to-day management of a basin’s surface and groundwater overall. The studies
examine, inter alia, the kind of legal and institutional changes necessary to facilitate such an integrated
approach. They are also concerned with practical implementation requirements such as the physical
accounting and monitoring of water allocations, the issuing of abstraction licences, through the use of
geographical information systems (GIS) to record river basin details.
23. Jim Welch/Asset Management - Irrigation/Sep-95 12
2.6.7 Project Benefit Monitoring and Evaluation (PBME)
This is a methodology for the assessment of irrigation system performance developed for the
identification of schemes for rehabilitation and upgrading (R&U) under ADB loan projects and the
subsequent monitoring and evaluation of their benefit. The methodology apparently recognises the
impracticalities of adopting an approach which is too rigid in its demands for particular types of data and,
instead, offers alternative approaches depending on the circumstances. These range from subjective
assessments based upon a survey of farmer perceptions and expectations on a sampling basis to an
analysis of performance data collected by the provincial irrigation and agricultural services. An Agro-
Institutional Profile (AIP) is produced which quantifies the benefits of a scheme in the local context in
order to justify the expenditure required.
2.6.8 Cost Effective Rehabilitation and Modernisation of Irrigation Schemes
This is a joint UK/Indonesian collaborative study being carried out by HR Wallingford (funded by the
UK Overseas Development Administration) and the Directorate General of Water Resources
Development (DGWRD). The aim of the study, which has a three-year programme, is to develop and
test a formalised procedure for setting priorities in the rehabilitation and modernisation of irrigation
schemes. It involves the identification of under-performing schemes, the diagnosis of causes of
performance shortfalls and the relating of specific performance benefits to each proposed corrective
action. A number of performance measures are considered for evaluation. The analysis of systems
includes the use of a computer-based hydraulic model.
2.6.9 Relevance of Asset Management Planning
With regard to the initiatives set out above, Asset Management provides an integrating framework in
which each of the elements described has its place and through which those elements (and others) are
related to one another. This must be so by definition since Asset Management is concerned with all
aspects of assets and the influences upon them. The technique of Asset Management Planning cannot be
thought of as something apart from, or as alternative to, these existing approaches. The great benefit of
the technique is its effect of achieving an integrated overview. Indeed, it is this which represents the
challenge in devising appropriate procedures.
The following chapters outline such procedures for irrigation and describe the application of the results.
Chapter 7, ‘Conclusions’, then returns to the subject of existing practices and Table 7.1 shows how each
the above initiatives is related to the AMP.
24. Jim Welch/Asset Management - Irrigation/Sep-95
Part II: Application -
Asset Management Planning for Irrigation
26. Jim Welch/Asset Management - Irrigation/Sep-95 13
3. Producing the Asset Management Plan
The previous chapter described asset management in outline and set the context of its application to
irrigation. This chapter sets out the approach to producing an Asset Management Plan for irrigation as a
series of inter-related steps. These steps are illustrated by reference to the field trial in Yogyakarta.
3.1 Introduction
Figure 3.1 shows the principal elements of asset management planning. To these must be added some
preliminary steps including those necessary to take advantage of the time and resource savings of using
statistical sampling techniques. The steps involved in the process may be summarised as follows:
• defining systems and function;
• stratified random sampling;
• establishing the environmental, legal and development context;
• assessing system performance - achieved levels of service, how these fit with present and future
requirements and what infrastructure adjustments are needed;
• studying Management and Operations - a parallel review of the organisation and its procedures;
• doing an Asset Survey - their extent, value and the liabilities they represent;
• building the Cost Model - analysis of historical Capital Expenditure (CAPEX) and Operational
Expenditure (OPEX) as a basis for future projections;
Each of these steps is outlined and discussed in the following sections.
3.2 Systems Definition
It is necessary to define at the outset exactly what primary functions the service is intended to provide.
Appropriate systems can then be identified in this context. For irrigation the following are identified:
• supply of water for irrigation
• removal of water by drainage
Irrigation infrastructure is commonly used for several subsidiary purposes (for example, public use of
maintenance access roads; non-irrigation uses of water; waste disposal; flood protection). What
constitutes a primary function is a matter of particular circumstances and of policy. The more there are,
however, the more complex becomes the analysis. Isolating primary functions is essential not only to
provide clarity in system definition but also, ultimately, to assessing performance.
The extent of the infrastructure to be included in the AMP must be defined. It was decided for the field
trial in Yogyakarta to consider systems supplying water for irrigation, including primary and secondary
canals down to a point 50m beyond each tertiary offtake gate. This is where the irrigation authority’s
management responsibility ends. Tertiaries were excluded as they are farmer-managed.
27. Jim Welch/Asset Management - Irrigation/Sep-95 14
OPERATIONS/ PERFORMANCE ASSETS COSTS
MANAGEMENT
Figure 3.1 Overview of asset management planning for irrigation
Management
Adjustments/
Training
Needs
OPEX
Budgets
Existing
Management
Establishment
Existing
Operational
Procedures
Legal obligations
Environmental Impact
National Water Policy
Liaison with
Water User
Associations
Regional
Development
Trends
Performance
Survey of
Asset Systems
Standards of
Service Targets
Future Demand
Estimates
Current Levels
of Service
Asset Survey
Asset Database:
• Extent
• Size
• Value
• Condition
• Serviceability
• Importance
Analysis of
Historical Costs
CAPEX Analysis
Unit Cost Index
New-
Build
(Modern
Equivalent
Asset)
Rehabilitn
/
Upgrade
Activities
OPEX Analysis
Operating Costs
Routine
Main-
tenance
Activities
Operations
OPEX
Adjustments
Management
Studies
Investment Needs Identified
Activities Planned
Benefits (performance improvements)
Engineering Studies
ASSET
MANAGEMENT
PLAN
Financial Modelling:
* Alternative strategies
* Capital Planning
(eg 20 years)
* Budget Planning
(5 years)
* Budget Priorities
Privatisation/Turnover
Negotiations
Pricing for Cost
Recovery
Needs Based Budget
Allocations
Comparative Performance
Assessment & Rewards
Changes to
Procedures
28. Jim Welch/Asset Management - Irrigation/Sep-95 15
3.3 Stratified Random Sampling
Sampling is the process of choosing items from a larger population in a representative way. Random
samples are chosen in order to avoid bias in the selection. In this case it is irrigation systems which are
to be sampled. The steps required for the AMP are these:
• subdivision of the study area into suitable unit systems;
• grouping the systems (‘stratification’) according to characteristics related to investment need;
• deciding how many sample systems are needed and selecting them;
• estimating the total investment need from the results of sampling.
These steps are discussed in the following sections.
3.3.1 Subdividing the Study Area
The regional infrastructure must be divided up into individual systems each of which can, for practical
purposes, be considered in isolation as more or less independent. For this it is essential to establish an
overview of the infrastructure network under consideration using maps and schematic diagrams. The
field trial in Yogyakarta demonstrated that it can be surprisingly difficult to obtain such information in a
comprehensive and unambiguous form. Here, individual operational units known as Daerah Irigasi (DI)
appeared to be suitable for adoption as the unit system required. In all, 1396 DIs were identified in
Yogyakarta province, serving areas of less than 75 to over 5000 ha.
Each system delivers water from a source to ‘customers’ via a number of outlets. Some systems are
cross-linked with others. Examples of this occur where systems abstract from the same river at different
points along its length and where link canals transfer flow from one river to another. In such situations
some ‘interference’ may arise between ‘separate’ systems. This effect must be minimised in the course
of system definition. In the subsequent analysis, any ‘super-systems’ (i.e. those parts, such as the link
canal example, which feed several of the defined independent systems) must be treated separately.
3.3.2 Stratification
Stratification is the term used for dividing up the members of a set into groups, termed ‘strata’, having
similar characteristics. The benefit of doing this is greater confidence in the estimates obtained from any
given number of samples. The characteristics of interest here are those likely to identify systems with
similar investment needs. Table 3.1 shows possible criteria. Many factors may be considered as a basis
for stratification but their number should be reduced so that there are only a few strata, ideally about five
and certainly less than ten. This can be done as follows:
(a) Only factors which are known or can easily be determined for all systems should be used.
(b) Factors are preferred that are believed to be closely related to the investment need.
(c) Where two factors are strongly correlated they may be counted as one composite factor.
29. Jim Welch/Asset Management - Irrigation/Sep-95 16
Table 3.1 Possible Criteria for Stratification of Irrigation Systems
Purpose: To identify
• similar investment requirements in each strata
• similar extent and type of problem*
Typical Elements
Geographical/Topographical
• topography
• sediment load
• soil types
• climate
• water availability; adequacy and reliability
Physical System
• levels of technical sophistication
• size
• age /condition of system
• main construction materials/methods
• source of water supply
• crop type
Management/Ownership
• management type - levels of responsibility and
degree of water user participation
• ‘customer’ satisfaction
Socio-economic
• payment of Irrigation Service Fee
• farmer income levels
• urban or rural
• ownership/land tenure
*Note: where characteristics are common within a region they do not affect stratification.
In the field trial the following data were sought for each DI:
(a) The “technical level” which expresses the degree of flow measurement and control in three classes
- ‘Technical’, ‘Semi-technical’ and ‘Non-technical’ (defined in Glossary of Terms).
(b) The topography, either ‘flat’ or ‘steep/undulating’.
(c) The availability of water when needed, expressed as ‘good’, ‘variable’ or ‘poor’. Unfortunately
this could not be used for stratification as data was available only for some systems and it would
have required a separate survey to obtain complete data.
(d) The peak flow at the system intake. This is more likely to be subject to error than the irrigated
area with which it correlates and data was not available for some systems (no measurement
capability). It was therefore not used in this example.
(e) The irrigated area. This is best used for ‘normalisation’ of investment figures derived from the
investigations (see Section 3.3.4) and should not then be used for stratification.
Thus the two factors used to stratify the systems were technical level and topography as shown in Table
3.2. Both factors are related to the types and extent of engineering structures and therefore to the likely
investment needs.
30. Jim Welch/Asset Management - Irrigation/Sep-95 17
Table 3.2 shows that, whilst there are many Non-technical systems, most of the irrigated area is served
by Technical and Semi-technical systems. There are a relatively large number of small Technical
systems in undulating/steep areas while those in flat terrain generally serve a larger area.
Table 3.2 Stratification of Irrigation Systems (DIs) in Yogyakarta province
Technical level
Topography Technical Semi-technical Non-technical Total
(number of systems / % of irrigated area)
Flat 20/24% 110/19% 34/0.6% 164/43.6%
Undulating 159/21% 260/22% 813/13.4% 1232/56.4%
Total 179/45% 370/41% 847/14% 1396/100%
Roughly equal investigative effort should be directed towards four strata: ‘flat-Technical’, ‘undulating-
Technical’, ‘flat-Semi-technical’, and ‘undulating-Semi-technical’. Each of these represent roughly
equal areas. Rather less effort should be devoted to Non-technical systems in undulating areas, and
almost none to Non-technical systems in flat terrain. Since the investigative effort per system is likely to
be less for the smaller Non-technical systems, equal numbers of each type of system could be selected.
3.3.3 Deciding which systems to investigate
The number of systems investigated will be a compromise between the desired precision of the
investment estimate and the time and resources available. The minimum number of samples from any
one stratum to allow the within stratum variability to be estimated is two, whilst at least five are needed
for confidence in the estimate of variability. The number of systems for which AMPs were prepared by
the English and Welsh Water Authorities in 1989 ranged between 50 and nearly 400 systems. The
number of samples varied between 12 and around 60.
For the field trial, an initial estimate of the minimum number of systems to be investigated might be in
the range 50 to 70, with 10 or more in each of the 5 main strata, i.e. with flat-Non-technical systems
excluded. This would be likely to give reasonable confidence in the estimated total investment need.
Having decided how many systems to investigate from each stratum, their selection should be by random
numbers in order to ensure that the systems chosen are representative. Detailed investigations can then
commence as detailed in Sections 3.5 to 3.7.
3.3.4. Estimating the Total Investment Need
Having conducted detailed investigations on the sample systems, the identified investment needs must be
aggregated in order to represent all systems in the study area. To do this, ‘normalisation’ measures are
used along with the strata previously determined. Normalisation measures provide the means to relate
characteristics of systems to some common unit of size. Thus characteristics established for a sample
can be converted into a general form applicable to all systems. A number of possible normalisation
31. Jim Welch/Asset Management - Irrigation/Sep-95 18
measures are presented in Table 3.3. Typically in irrigation the measure used is area, so for example
costs are expressed ‘per hectare’.
Table 3.3 Possible Normalisation Measures
Relates characteristics to some common units of size. For example:
• irrigated area/command area
• volume/length of canal
• number of structures
• number of farms/tertiaries
The stages in the calculation to estimate the total investment need are these:
(i) For each stratum, calculate the stratum mean and variance from the individual sample results. The
variance is a measure of the differences between individual samples.
(ii) For each stratum, calculate the stratum total by multiplying by the area served by all systems in
the stratum, and its variance.
(iii) Add the stratum totals and their variances to obtain the regional total and its variance.
Detailed formulae are given by Barnett (1974).
3.4 Environmental, Legal and Development Context
It is essential to review the general context within which the irrigation service is to operate in order to
establish appropriate and comprehensive Standards of Service, both for the present and over the coming
twenty years. Once established, these Standards become the benchmark against which performance will
be assessed. This review must therefore be done before detailed investigations of assets and systems can
proceed.
3.4.1 Environmental Impact
Heightened awareness by governments and populations of environmental impacts of development
projects makes their examination imperative. As an integral part of the water resources development
sector, irrigation has a particular significance. Essentially, irrigation will directly affect:
• the location and timing of water availability;
• water quality.
Specific local effects will be many and varied, with several counteracting environmental costs and
benefits across a broad range from public health to natural habitats. In setting the Standards of Service
criteria for ongoing operation (or improvement, extension or contraction) of an existing irrigation
system, it is necessary to focus on net effects which are subject to the influence of managers of the
system. Examples might be:
• quantity and quality of “compensation flow” (i.e. that part of the flow not diverted) at the point(s)
of abstraction;
32. Jim Welch/Asset Management - Irrigation/Sep-95 19
• quality and quantity of drainage water discharged into natural water courses (or otherwise
disposed of);
• health and safety aspects of public access to irrigation infrastructure (including water quality,
contamination risks to downstream users and potential injury);
• direct effects of management practices (e.g. de-silting);
• impact of irrigation on groundwater quality and level.
Those things taken into account will include:
• national environmental legislation and policies;
• international obligations (e.g. Agenda 21 agreement) if not already incorporated in the above;
• discretionary standards (good practices) reflecting local concerns;
3.4.2 Legal Obligations
The obligations placed on the irrigation service by national and regional legislation must be taken into
account when setting or reviewing Standards of Service. As governments move towards an integrated
water sector, the laws affecting irrigation may be expected to change. So far as possible such changes
should be anticipated within the term of the investment plans.
3.4.3 Social Development
There are two aspects of this which affect the setting of Standards:
• the changing perceptions and demands of water users as ‘customers’;
• the movement of populations from a rural, agricultural base towards an urban, industrial one.
The first of these requires good liaison with water users associations or other customer representative
groups to establish their perceptions of need and what, for them, constitutes a good service. This will
also help with anticipation of changing farming practices which could lead to significantly altered
technical requirements on the irrigation system. Urbanisation and industrialisation could affect the
planning of an irrigation system in a number of ways:
• by construction of buildings on land which has been irrigated;
• by making conflicting demands on the available water supplies;
• by polluting irrigation water;
• by secondary effects on the rural population (e.g. greater affluence, reduced dependency on
agricultural income) leading to changes in their demands on the irrigation system.
Regional development trends must be studied to ensure such factors are taken into account so far as
possible.
33. Jim Welch/Asset Management - Irrigation/Sep-95 20
3.5 Performance Assessment
3.5.1 Performance Indicators
Irrigation performance assessment is the subject of much discussion at present. Recent publications
(such as Murray-Rust and Snellen, 1991; Small and Svendsen, 1992; Bos, Murray-Rust, Merrey,
Johnson and Snellen, 1993) should be referred to for a comprehensive treatment. The distinction
between different levels at which performance can be measured is usefully summarised in Figure 3.2
(Small and Svendsen’s nested systems diagram). It is particularly important to distinguish between the
system (i.e. the infrastructure: canals, structures etc.) and the scheme (which includes agricultural
elements - see also Glossary of Terms).
Asset Management planning is concerned with ‘output performance measures’ (quality of service to the
‘customer’) at the level of irrigation system performance. Key performance measures are related to the
supply and distribution of water . These are considered to be:
• adequacy
• timeliness
• equity
• reliability.
Adequacy is a measure of the ability of the system to supply the designed or required quantity of water
to a delivery point. In terms strictly of the system infrastructure (i.e. not management or other
influences), it is principally a matter of hydraulic capacity. Timeliness is a measure of the ability of the
system to deliver water at the ‘required time’ - usually stipulated by the water user and, of course, related
to crop irrigation needs. It is principally a matter of system operation. Equity is a measure of the ability
of the system to provide an equitable distribution of water amongst the many points of delivery. This
again is principally a matter of system operation (assuming that the ‘adequacy’ measure is satisfied
throughout the system). It is particularly relevant if water supplies are short. Reliability is a measure of
the level of confidence that water will be delivered in adequate quantity at the required time. This is
related to hydraulic capacity, system operation and to water availability.
Additional measures of performance may be required to reflect the demands of the environmental, legal
and development context, as described in Section 3.4 above.
3.5.2 Performance Assessment for Asset Management Planning
There are considered to be three stages in performance assessment for asset management planning:
Stage 1 System performance assessment using the indicators selected.
Stage 2 Appraisal of a system performance shortfall and its causes.
Stage 3 Quantification of causes of a system performance shortfall and its correction.
These three stages are outlined below.
34. Jim Welch/Asset Management - Irrigation/Sep-95 21
Other Inputs Other Inputs
Key to Inputs/Outputs:
1 Operation of irrigation facilities 3 Agricultural production 5 Rural economic development
2 Supply of water to crops 4 Incomes in the rural sector 6 National development
Figure 3.2 irrigation in the context of nested systems (Small and Svendsen, 1992)
6
5
4
3
2
1
4
4
5
5
6 6
1
2
2
3
3
IRRIGATION SYSTEM
IRRIGATED AGRICULTURAL
SYSTEM
AGRICULTURAL ECONOMIC SYSTEM
RURAL ECONOMIC SYSTEM
POLITICO-ECONOMIC SYSTEM
35. Jim Welch/Asset Management - Irrigation/Sep-95 22
3.5.3 Stage 1 - System Performance Assessment
A short cut to assessing system performance may be to look at the scheme performance. If the scheme is
performing well against targets then it may be assumed that the physical system is performing adequately
(though Stages 2 and 3 as outlined below may be needed to confirm this). There are various ways in
which this initial performance survey might be done. Approaches described below consider:
• crop area planted in comparison to that planned;
• water delivery performance ratio;
• views expressed by Water User Associations.
Appropriate measures must be chosen to reflect local circumstances including the type of data existing
and the resources available. The projected future demands on the system must be considered as well as
current requirements. Additional measures of performance will be related to environmental, legal and
social development criteria.
In the example of the trial on system DI Papah, Yogyakarta, a number of different approaches were
tested for the System Performance Assessment. In the first of these the area of crop actually planted by
farmers in each tertiary in each season, when compared with that planned or designed, was regarded as
an indicator of farmer ‘confidence’ in the system. For this purpose planted area is relevant rather than
harvested area or yield. It was expected that a pattern would emerge where planted area in any given
tertiary was consistently slightly higher or rather lower than the plan or design figure. In order to allow
for variations in farmers choice of crop, a relative area was calculated based approximately on relative
crop water demand.
The second approach compared actual with planned water delivery (Delivery Performance Ratio) at the
tertiary offtake. Actual to planned Water Delivery Ratios were also examined at measuring points on the
secondary and primary canals. The discharge into the system was compared with its maximum design
value to see how closely the system is operated to its theoretical capacity. Given reliable data, these
checks should give very ‘precise’ measures of system performance.
The difficulties experienced in these two approaches lay in the availability of data and in its quality. In
some cases less than a full year’s data was found. At many tertiaries no measurement of flow is taken
because they have no measuring structures. Where figures for crop areas and discharges were available
for both ‘actual’ and ‘planned’, these were frequently identical which led to doubts as to their
authenticity. For crop areas, no design values could be traced.
Another possible approach would be to make spot checks of key parameters on a one-off basis. These
would be made under controlled conditions on the day(s) of the survey in preference to relying on
uncertain historical data. The confidence in results obtained on such a limited sample would have to be
considered. This could not be tried on the sample system because it was drained down.
36. Jim Welch/Asset Management - Irrigation/Sep-95 23
The third approach tested was to visit Water User Associations and to interview them about the type of
problems they faced, their view of system performance and their opinions on the availability and
reliability of water. The results of such a survey are, however, difficult to quantify. The design and
implementation of a survey of this type is a specialised exercise in its own right which would need
careful treatment in order to provide quantitative results suitable for use in the AMP.
3.5.4 Stage 2 - Appraisal of a Performance Shortfall
A performance shortfall may be current or it may relate to some future anticipated requirement. The
cause could be due to:
(i) problems with the system assets;
(ii) problems with management of the system;
(iii) a combination of both the above.
A clear distinction must be drawn between performance shortfalls related to management and those
related to the system. This distinction is crucial. In irrigation, the quality and dedication of management
has a vital impact on performance. This is in marked contrast to the assumptions made in the Asset
Management procedures developed for the UK water industry. It is quite possible that an irrigation
scheme may have a perfectly well functioning system but is nevertheless performing badly due to
inadequate management. Conversely, management interventions can and often do offset infrastructure
inadequacies of design, construction or maintenance. System and management performance shortfalls
must be separately identified. Section 3.6 refers to Management Issues.
The Asset Management Plan itself is concerned with the infrastructure (the system), not its management.
The method of appraisal will be tailored to the type of system under investigation. For systems where
discharges are theoretically fixed by the design, the study will involve monitoring in sample locations
whether or not these discharges are being obtained. In other systems (such as in Indonesia) where water
allocations are planned, questions that the study will seek to answer will include:
• Is sufficient data collected to enable water allocations to be planned?
• Is water allocation planning a real or a “paper” exercise?
• Are discharges in the field in accordance with those planned?
• Are the organisational structure and the facilities for operation and maintenance adequate to
enable effective system operation?
• Do system operators experience difficulties with passing design or maximum required discharges
through the system?
Through detailed analysis of both the management organisation and the physical system, the causes of a
performance shortfall can be diagnosed. Where confidence in a system’s infrastructure remains in
doubt, more extensive Engineering Studies will be required.
37. Jim Welch/Asset Management - Irrigation/Sep-95 24
3.5.5 Stage 3 - Engineering Studies
The purpose of undertaking Engineering Studies is to recommend remedial works necessary to adjust the
performance of a system to match the prescribed standard of service. To do this, the cause of a system
performance shortfall must first be located and confirmed as being infrastructure related rather than due
to management. This will involve a combination of fieldwork and desk study and may usefully include
hydraulic modelling. The technical solution produced, taken together with information provided in the
Cost Model (see Section 3.8), determines the investment required.
The distinction between these Engineering Studies and the Asset Survey is important. The latter is
concerned with the assessed condition of individual assets which, important as this is within the AMP,
may be of little consequence to the former which considers system performance as a whole. Examples
might occur where an individual asset could be bypassed, abandoned or superseded or where it had little
influence on the system. Where the system needs to be upgraded, for example due to obsolescence, new
technology or future demand changes, the engineering studies will include investigation of different
options. The study might examine, for instance, changing control structures from manually operated to
automatic. The design, operational and cost implications of such a move would need quantification.
Estimates of anticipated benefits must be prepared, showing how performance indicators are expected to
improve over time as a consequence of capital investment in the system. The implications for operating
costs of any proposed capital investment must also be quantified. Such analyses are required to inform
decisions made during Financial Modelling following preparation of the AMP. General inferences must
be drawn from engineering studies carried out on the selected sample systems.
For the sample system in the field trial, DI Papah, engineering studies had been undertaken during the
preparation of a project design report for the ‘Rehabilitation and Upgrading’ project which was ongoing.
Although the report had served as a basis for justifying the project and for the decision to go ahead with
its implementation, the form of the report was unsuitable for the AMP. The following needs of the AMP
were not satisfied by the report as it stood:
• It did not relate specific investment activities to specific performance shortfalls. Instead, overall
financial costs and benefits were compared.
• It did not enumerate separately the costs of specific investment activities. All activities were
aggregated and re-divided into Bill of Quantity items before costs were applied.
• It did not detail benefits in terms of improvements in performance indicators or how these would
be distributed over time.
The experience gained from trying to adapt the engineering studies carried out for the trial area
demonstrated the particular nature and extent of the data required by the AMP. It is clear that such
Engineering Studies will need specific terms of reference to match the requirements of the AMP with
those for the location. To understand the variety of such requirements, further research is required.
38. Jim Welch/Asset Management - Irrigation/Sep-95 25
3.6 Management Issues
3.6.1 The Crucial Role of Management
An overview of the Asset Management Planning process is shown in Figure 3.1. This shows the
consideration of management and operation as a parallel activity which interacts with the rest of the
process. The Asset Management Plan itself is concerned essentially with the infrastructure (i.e. the
engineering hardware) of the system providing the basis of the service. It is important when drawing up
the AMP to keep attention focused on the infrastructure and not to allow the effects of system
management to confuse the issue (see Section 3.5 - Performance Assessment).
It is a feature of irrigation systems, however, (with the possible exception of the most technologically
sophisticated, automated systems) that the influence of management is crucial to the quality of service
provided. This sets irrigation apart from many other types of infrastructure and particularly from the UK
water industry where the AMP originated. Recognition of this important difference demands that a
parallel but integrated study of management issues must therefore be incorporated.
3.6.2 Existing Management Structure
It is important to establish an understanding of the existing management structure both as an aid to
conducting and interpreting the AMP generally and as a basis for considering its appropriateness to
future needs. The types of questions which will be asked are:
• What is the nominal existing management structure?
• Is it clearly and unambiguously defined?
• How widely is it known and understood by line managers and staff?
• How is authority and responsibility delegated?
• How are goals defined and achievements rewarded?
• What steps are taken to ensure that staff are able to perform as required and that they keep abreast
of changing needs and practices?
• What relationship does the formal management structure bear to the day-to-day practice?
• Is the structure rigid or can it readily respond to changing needs?
The answers to these questions will help to determine whether the existing structure is adequately set up
to enable true management of the irrigation system(s) concerned or whether it is merely administrative in
nature. Administration implies that processes and procedures are followed in a manner which protects
individuals from sanction whatever bearing this may have on performance oriented objectives.
Management implies that important decisions are routinely taken and implemented at an appropriate
level, in response to needs as they arise, in general conformance with the policies of the organisation.
Management is achieved through the setting of objectives and targets and the monitoring of performance
indicators.
39. Jim Welch/Asset Management - Irrigation/Sep-95 26
3.6.3 Existing Operational Procedures
These procedures and how they are actually implemented are crucial to the performance of the irrigation
system. It is necessary to determine, for example,
• what procedures exist;
• whether they are formally recorded in an unambiguous manner;
• how actively and consistently they are used;
• how helpful they are to staff who operate and maintain the system;
• whether they are appropriate to the current situation and to future needs;
• how relevant they are to achieving the specified performance criteria;
• how frequently they are reviewed against the results of operational performance monitoring and
evaluation.
It cannot be assumed, of course, that the findings will be the same across all the sample systems. Each
must be independently investigated. Indeed the variability between systems may itself be instructive.
3.6.4 Management Studies
3.6.4.1 The Implementation of the AMP
It is obviously crucial to the success of the whole procedure that the management of the irrigation service
will be able to interpret and to implement the Asset Management Plan. This must not be taken as a
foregone conclusion. It will depend on the capabilities of individuals, the quality of their briefing and
training and the procedural constraints under which they operate. An important aspect of the
Management Studies will be to check that an appropriate structure exists with adequate capability.
3.6.4.2 The Influence on System Performance
Liaison and interaction with the Engineering Studies (being conducted under Performance Assessment)
is vital at this stage. The Performance Assessment should have established how well the system meets
current and projected Standards of Service targets. Adjustments to the infrastructure (‘hardware’) and to
management practice (‘software’) will be under consideration to achieve:
• corrections to existing performance shortfalls;
• changes needed to meet new Standards;
• changes needed in response to altered demand;
• greater overall financial efficiency;
• trade-offs between capital (CAPEX) and operational (OPEX) expenditure;
• institutional reforms (e.g. turnover or privatisation).
Clearly the adjustments proposed to the infrastructure and to the management must be co-ordinated and
harmonised. The studies conducted under the two headings will inform and stimulate each other.
40. Jim Welch/Asset Management - Irrigation/Sep-95 27
3.7 Asset Survey
3.7.1 Background
Fundamental to an Asset Management Plan is a knowledge of what assets exist, their value and the
liabilities they represent derived from a knowledge of the state of repair of each asset and its life
expectancy. It is important to distinguish between the Asset Survey and the Engineering Studies related
to system performance assessment as explained in Section 3.5.5. Information derived from the former
indicates immediately the scale of the financial commitment represented by the infrastructure system.
For example if assets with a value of ‘x’ dollars have a life expectancy of ‘n’ years then it is apparent
that, for replacement alone, there is an average annual liability of ‘x/n’ dollars per year. Assuming that
some sort of inventory already exists, the task will be to confirm this inventory and to extend it as may
be necessary to include all the asset data requirements of the AMP. These are defined in the following
sections.
3.7.2 Extent
The unit measure of extent for assets will most commonly be the ‘number present’ or, for linear assets such
as canals, ‘length’ in kilometres. In order to count them meaningfully assets must be classified by type.
The classification method developed for the field trial is shown in Table 3.4.
Table 3.4 Grouping Of Principal Asset Types
Group 1 - WATER CAPTURE
River Offtake Weirs.
Dams & Impounding Reservoirs.
Groundwater Abstraction Wells.
Group 2 - CONVEYANCE
Canals.
Hydraulic Structures.
Supplementary Structures.
Group 3 - OPERATIONS
(CONTROL) FACILITIES
Head Regulators.
Cross Regulators.
Measuring Structures.
Group 4 - MANAGEMENT AND GENERAL
Access Roads.
Offices and Laboratories.
Depots and Workshops.
Field Officers Quarters.
Vehicles and Plant.
‘Information Technology’ Systems.
Here, asset types are distinguished by Function at the first level, with structural similarity as the second
level. Drop structures and culverts, for example, are thus classified together as hydraulic structures.
This approach provides a manageable number of asset types and descriptions. Some irrigation engineers
may prefer to extend the typology to identify the irrigation assets more precisely by adding a third level.
3.7.3 Defining Asset Types and Components
A list of asset types and components, based on a reconnaissance of schemes in the Yogyakarta area
combined with general experience of irrigation specialists, is shown in Table 3.5. Asset types which are
of interest are those into which most investment will be concentrated. Components of assets are defined
in order to facilitate condition assessment when different components may be subject to different
degrees of deterioration. No more components should be identified than is necessary. An asset’s overall
condition score can be arrived at by weighting the individual scores of its components and then adding
41. Jim Welch/Asset Management - Irrigation/Sep-95 28
them. The weighting factor suggested for a component is the proportion of its value to that of the asset
as a whole.
Table 3.5 Asset types and components used in the trial
Asset Type Size measures
to be recorded
Functions to be
assessed
Components to
check
Depreciation
Life (est.)
Weir
crest length
crest height
HYDRAULIC
-provide level
-pass offtake
design flow
-pass design flood
OPERATIONS
-gates
-gauges
weir wall
dividing walls
abutments
crest
apron
sluice gate
offtake gate
stilling basin
superstructure
civil
50 years
mechanical
and electrical
(m&e)
10 years
Head Regulator
total gate
width
design flow
HYDRAULIC
-pass design flow
OPERATIONS
-control flow
-gauges
gate(s)
structure
notice board
shelter
civil
25 years
m&e
10 years
Cross
Regulator
* options
-fixed crest
-gate(s)
-stop logs
-flume
total gate
width
design flow
HYDRAULIC
-pass design flow
OPERATIONS
-control command
(level)
-gauges
control section*
structure
notice board
u/s wingwalls
d/s wingwalls
gauge(s)
shelter
civil
25 years
m&e
10 years
Measuring
Structure total crest
width
design flow
HYDRAULIC
-pass design flow
OPERATIONS
-measure flow
control section
gauges
structure
u/s w/walls
d/s w/walls
stilling box
25 years
Canal
(linings
-earth
-masonry
-concrete tile
-cont. concrete)
design flow
length
HYDRAULIC
-pass design flow
OPERATIONS
-n/a
embankment
side slopes
(note type)
bed
civil
25 years
m&e
10 years
Hydraulic
Structure
-aqueduct
-culvert
-drop struct.
-escape struct.
(note type)
(depends on
structure)
design flow
length
fall
HYDRAULIC
-pass design flow
OPERATIONS
-n/a
conveyance
support struct.
u/s w/walls
d/s w/walls
stilling basin
civil
25 years
m&e
10 years
Supplementary
Structure
e.g.:
-bridge
-cattle dip
(depends on
structure)
design flow
length
HYDRAULIC
-pass design flow
OPERATIONS
-n/a
structure
safety
other features
civil
25 years
m&e
10 years
Access Roads width
length
OPERATIONS
-access to system
structure
surface
drains
civil
25 years
42. Jim Welch/Asset Management - Irrigation/Sep-95 29
3.7.4 Size and Size Bands
Within each asset category the nature of the asset, its value and the liabilities associated with it, will vary
according to its ‘size’. In order for classification to be manageable, the use of ‘Size bands’ (or ranges of
size) is necessary. Definition of the bands will depend on the range of sizes existing in the particular
region under consideration and upon the cost-size relationship. The measure of size should be chosen to
give a reasonably simple correlation (preferably linear) with value. It should also be an unambiguous
measure which can be practically and reliably determined as part of the survey. Measures which are
obscure, difficult to check or liable to be in error are impractical.
Table 3.6 Size Measures for typical assets in the Trial Area
Asset type Size measure Extent units
Weirs (crest height)3 x (crest width) number existing
Canals Maximum design flow length in kilometres
Cross Regulators Maximum design flow number existing
Head Regulators Maximum design flow number existing
Measuring Structures Maximum design flow number existing
Hydraulic Structures (Maximum design flow)x(length) number existing
Supplementary Structures:
- Bridges (Span)3 number existing
- Other Canal Maximum design flow number existing
For the trial, insufficient information was available to be able to do correlation tests of size measures
against value (see discussion of Cost Model). The size measures presented in Table 3.6 were selected on
the basis of engineering judgement. In cases where maximum design flow is difficult to determine (for
example because the design has been subject to several modifications) then the area served by the asset
may be a more reliable size indicator. This makes the broad assumption that crop water demands per
unit area are roughly consistent across the region under consideration. Given that the intention is to
place assets in size bands rather than to measure their size precisely, this assumption is reasonable.
Table 3.7 Size Bands for ‘Maximum Design Flow’ selected in the Trial
Band 1 Band 2 Band 3 Band 4 Band 5
0 - 249 l/s 250 - 749 l/s 750 - 1249 l/s 1250 - 2249 l/s > 2250 l/s
The definition of size bands also needs to be reasonably straightforward. In the trial the bands shown in
Table 3.7 were chosen for ‘maximum design flow’ to fit well with cost figures located for different sized
standard structures (East Java Irrigation Study, Vol. 2, 1981).
3.7.5 Value (‘Gross MEA’ and ‘Net’)
The value of the asset depends upon its type and its size and is represented in terms of the ‘Modern
Equivalent Asset’ (MEA) value (that is to say the cost of a modern asset of equivalent function, not
necessarily replicating the existing asset in precise detail) at current prices. The gross MEA value is the
full amount currently needed to acquire such an asset. The net value takes account of the fact that the
asset is not new and assumes that its value depreciates in accordance with a formula (the simplest of
which is a straight line relationship between net value and age) until it reaches its ‘depreciation life’ at
which time its value is nil (because it would need to be replaced). This conforms with conventional
accounting practice. The establishment in the survey of an asset’s type and size enables its gross value
43. Jim Welch/Asset Management - Irrigation/Sep-95 30
to be derived by reference to the Cost Model. Condition information then allows net value to be derived
similarly.
3.7.6 Condition and Serviceability
3.7.6.1 General
An important difference between the approach to the asset survey defined here and that more commonly
described is that here a distinction is made between the general condition of an asset on the one hand and
its ability to perform its function (its ‘serviceability’) on the other. As soon as a new asset is put in place
it begins to deteriorate. Its condition progressively degrades until it reaches its depreciation life when it
will need to be replaced. Thus the condition of an asset, taken with its MEA value, can be used to give
an indication of the likely cost associated with its restoration.
The serviceability of an asset (that is its ability to perform its function) is often assumed to be directly
related to its condition. But this can be a misleading assumption. In practice, assets very often continue
to perform their function quite satisfactorily even though their condition is significantly deteriorated. On
the other hand there are frequent instances when an asset which is generally in excellent condition is
rendered unserviceable by a very minor fault. It is the serviceability therefore which indicates the
urgency of the work needed to restore the asset to its fully functional state.
By measuring separately these two indicators, a much clearer picture emerges than is the case when
condition and serviceability are treated as one and the same. Condition implies cost whereas
serviceability implies urgency. Expenditure priorities are thus much more readily determined and their
implementation is more likely to be effective in keeping the assets functional rather than merely
maintaining their appearance.
3.7.6.2 Condition Grades
The number of condition grades to be used should be chosen to suit the particular circumstances in
which the Asset Management Plan is being created. Due regard must be given to the way in which it is
intended to use the information and to the ability of those who will undertake the survey to distinguish
between different condition grades. A number of grades between three and six is recommended. The
World Bank has a six point scoring system although this rolls together condition and serviceability. The
Department of Public Works (DPU) in Indonesia has in some cases used a three point score of ‘Good’,
‘Average’ or ‘Broken’. In other examples, including that of the UK water industry, a five point system
is used although, where the top score is ‘new’ and the bottom score is ‘derelict’, these extremes may
rarely be selected. There is an argument for having an even number of grades so that a judgement must
be made by surveyors as to whether an asset is above or below average condition.
In the trial four condition grades were chosen. These are defined in detail for each asset category under
the following broad definitions: