Downloaded 285 times


![> class(tips)
[1] "data.frame"
> mode(tips) # data.frame list
[1] "list"
> head(tips[["total_bill"]]) # list
[1] 16.99 10.34 21.01 23.68 24.59 25.29
> head(tips$total_bill) #
[1] 16.99 10.34 21.01 23.68 24.59 25.29
> head(tips["total_bill"]) # data.frame
total_bill
1 16.99
2 10.34
3 21.01
4 23.68
5 24.59
6 25.29](https://image.slidesharecdn.com/rdataframemanupilation-111112012754-phpapp01/75/R-11-2048.jpg)
![> head(tips[c("total_bill", "tip")]) #
total_bill tip
1 16.99 1.01
2 10.34 1.66
3 21.01 3.50
4 23.68 3.31
5 24.59 3.61
6 25.29 4.71
> head(tips[[c("total_bill", "tip")]]) #
Error in .subset2(x, i, exact = exact) : subscript out of bounds
> tips[[c(1, 2)]] # tips[[1]][[2]]
[1] 10.34](https://image.slidesharecdn.com/rdataframemanupilation-111112012754-phpapp01/75/R-12-2048.jpg)
![> tips[1:2, 1:2] #
total_bill tip
1 16.99 1.01
2 10.34 1.66
> tips[1:2, c("total_bill", "tip")] #
total_bill tip
1 16.99 1.01
2 10.34 1.66
> head(tips[-(1:2), -(1:2)]) #
sex smoker day time size
3 Male No Sun Dinner 3
4 Male No Sun Dinner 2
5 Female No Sun Dinner 4
6 Male No Sun Dinner 4
7 Male No Sun Dinner 2
8 Male No Sun Dinner 4](https://image.slidesharecdn.com/rdataframemanupilation-111112012754-phpapp01/75/R-13-2048.jpg)
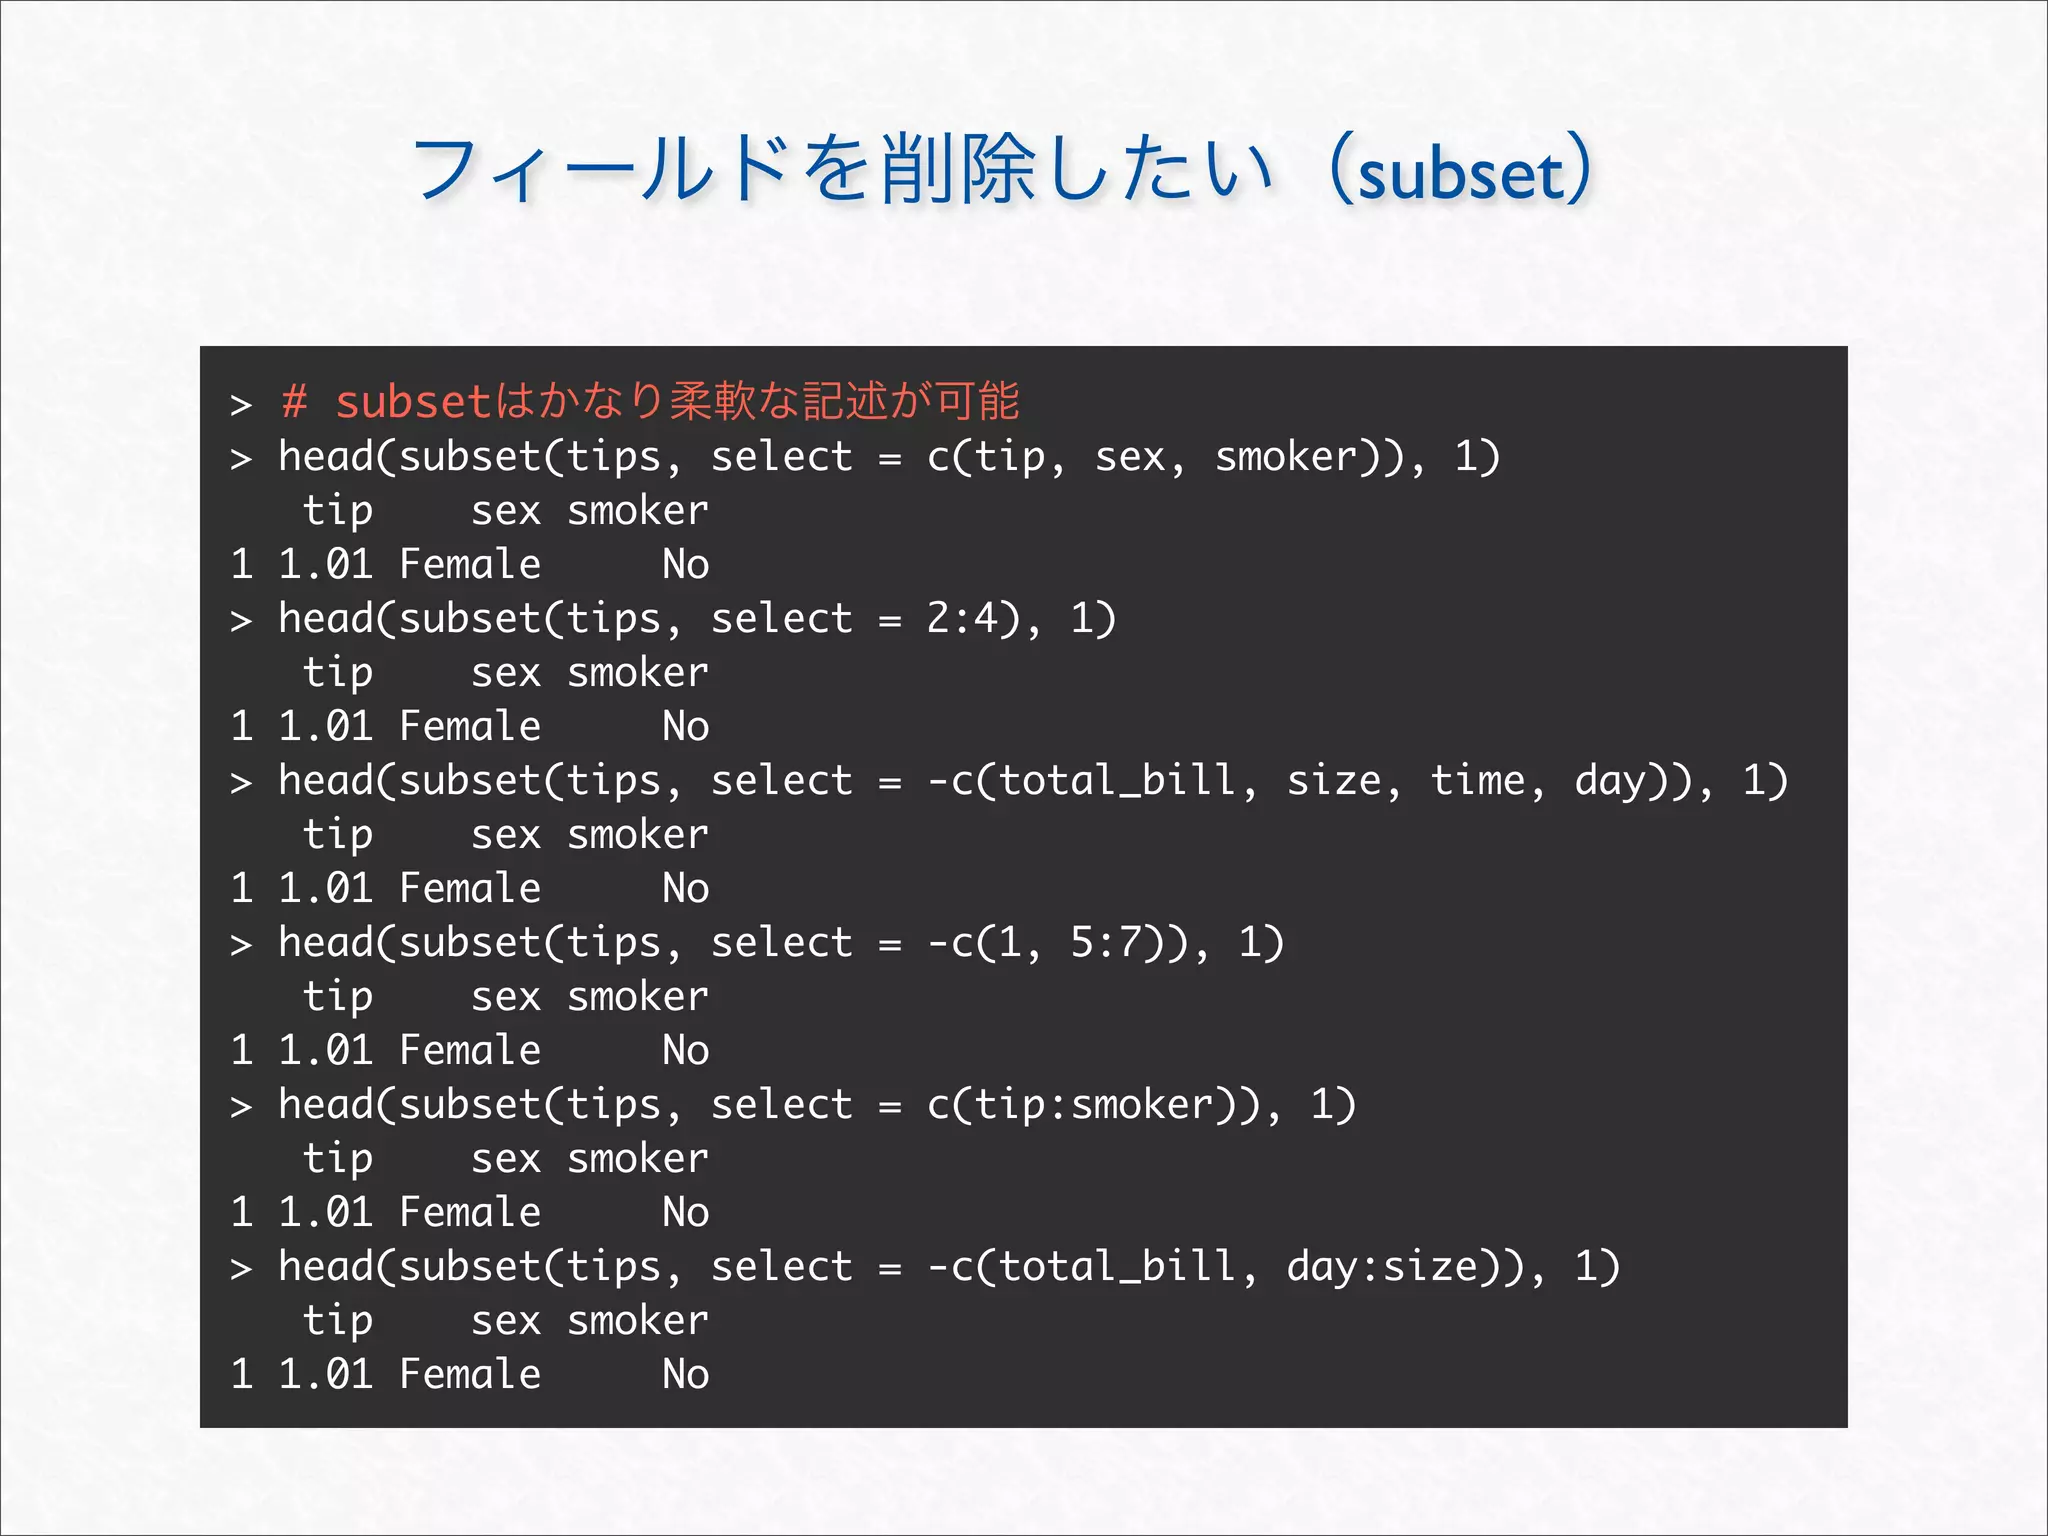
![subset
> args(subset.data.frame)
function (x, subset, select, drop = FALSE, ...)
NULL
> (tips.vip <- subset(tips, total_bill > 30 & size == 2))
total_bill tip sex smoker day time size
84 32.68 5.00 Male Yes Thur Lunch 2
174 31.85 3.18 Male Yes Sun Dinner 2
176 32.90 3.11 Male Yes Sun Dinner 2
180 34.63 3.55 Male Yes Sun Dinner 2
185 40.55 3.00 Male Yes Sun Dinner 2
238 32.83 1.17 Male Yes Sat Dinner 2
> levels(tips.vip$smoker) #
[1] "No" "Yes"
> levels(droplevels(tips.vip)$smoker) #
[1] "Yes"](https://image.slidesharecdn.com/rdataframemanupilation-111112012754-phpapp01/75/R-14-2048.jpg)
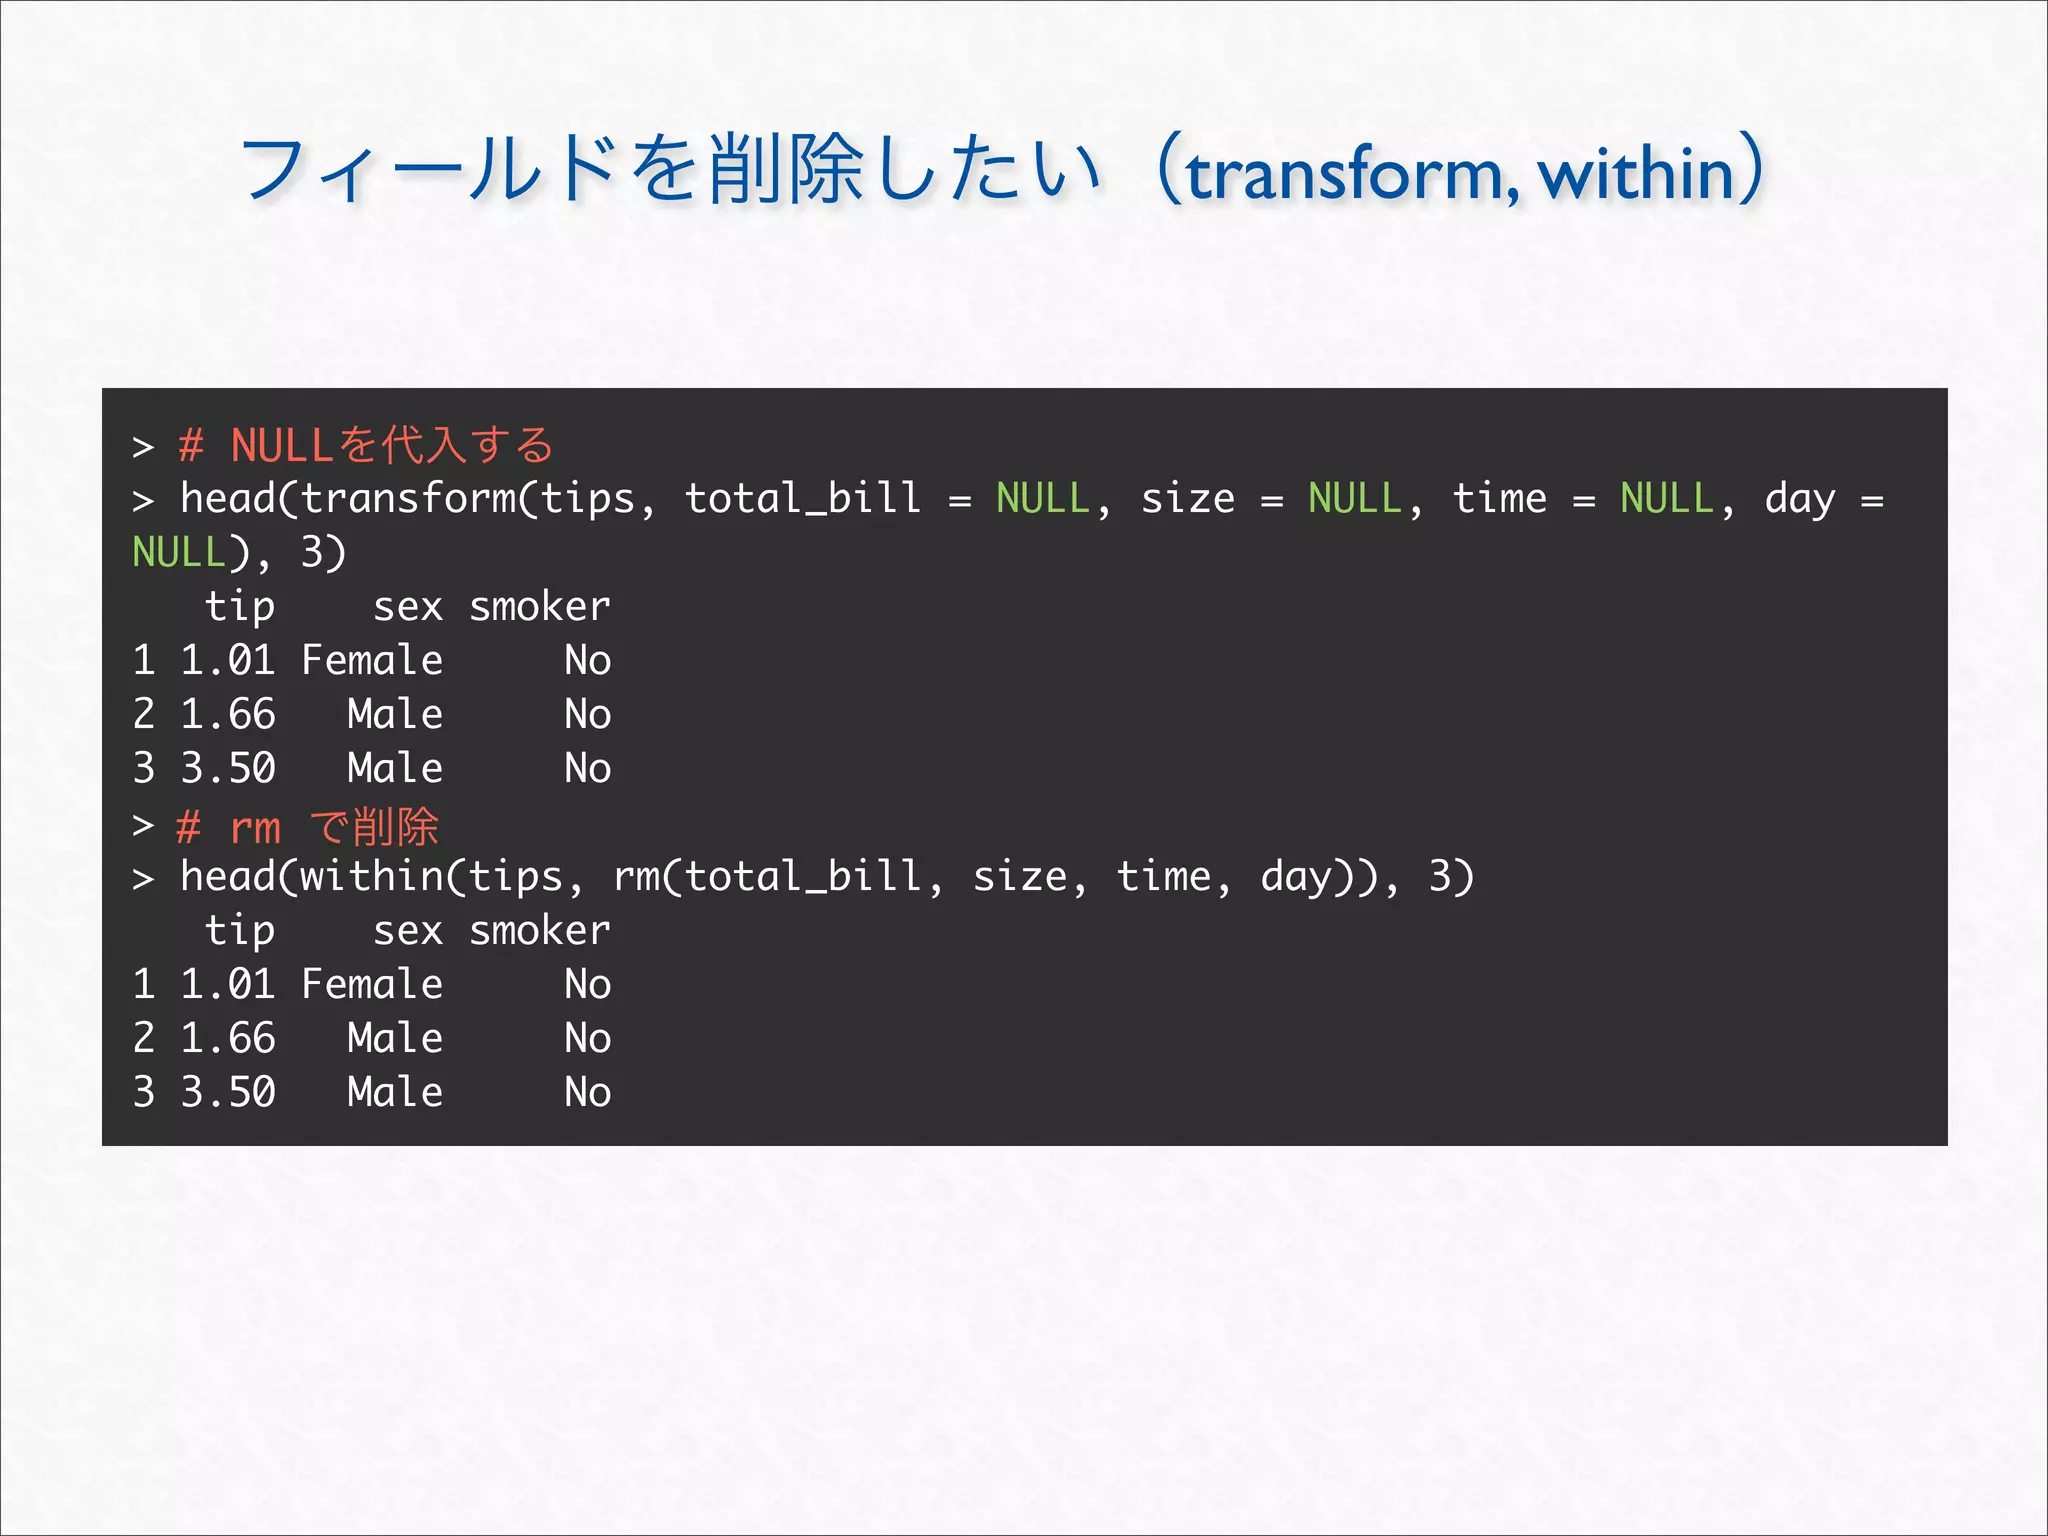
![transform, within
> args(transform.data.frame)
function (`_data`, ...)
NULL
> head(transform(tips, type = ifelse(tips$tip < 2, " ", " ")), 3)
total_bill tip sex smoker day time size type
1 16.99 1.01 Female No Sun Dinner 2
2 10.34 1.66 Male No Sun Dinner 3
3 21.01 3.50 Male No Sun Dinner 3
> args(within.data.frame)
function (data, expr, ...)
NULL
> head(within(tips, { type <- c() # within
+ type[tip < 2] <- " "
+ type[tip >= 2] <- " " }), 3)
total_bill tip sex smoker day time size type
1 16.99 1.01 Female No Sun Dinner 2
2 10.34 1.66 Male No Sun Dinner 3
3 21.01 3.50 Male No Sun Dinner 3](https://image.slidesharecdn.com/rdataframemanupilation-111112012754-phpapp01/75/R-16-2048.jpg)
![[, $, [[
> # NULL
> tips$size <- NULL
> head(tips, 3)
total_bill tip sex smoker day time
1 16.99 1.01 Female No Sun Dinner
2 10.34 1.66 Male No Sun Dinner
3 21.01 3.50 Male No Sun Dinner
> tips[["time"]] <- NULL
> head(tips, 3)
total_bill tip sex smoker day
1 16.99 1.01 Female No Sun
2 10.34 1.66 Male No Sun
3 21.01 3.50 Male No Sun
> tips["day"] <- NULL; tips[1] <- NULL
> head(tips, 3)
tip sex smoker
1 1.01 Female No
2 1.66 Male No
3 3.50 Male No
> data(tips)](https://image.slidesharecdn.com/rdataframemanupilation-111112012754-phpapp01/75/R-18-2048.jpg)
![order
> head(tips[order(tips$sex), ], 4) #
total_bill tip sex smoker day time size
1 16.99 1.01 Female No Sun Dinner 2
5 24.59 3.61 Female No Sun Dinner 4
12 35.26 5.00 Female No Sun Dinner 4
15 14.83 3.02 Female No Sun Dinner 2
> head(tips[order(tips$sex, decreasing = TRUE), ], 4) #
total_bill tip sex smoker day time size
2 10.34 1.66 Male No Sun Dinner 3
3 21.01 3.50 Male No Sun Dinner 3
4 23.68 3.31 Male No Sun Dinner 2
6 25.29 4.71 Male No Sun Dinner 4
> head(tips[order(tips$sex, tips$tip), ], 4) #
total_bill tip sex smoker day time size
68 3.07 1.00 Female Yes Sat Dinner 1
93 5.75 1.00 Female Yes Fri Dinner 2
112 7.25 1.00 Female No Sat Dinner 1
1 16.99 1.01 Female No Sun Dinner 2](https://image.slidesharecdn.com/rdataframemanupilation-111112012754-phpapp01/75/R-21-2048.jpg)
![data.frame
> (tip <- data.frame(date = sample(seq(as.Date("2011-11-09"), by = "day", len = 4)),
+ total_bill = sample(1:4 * 10),
+ tip = sample(1:4)))
date total_bill tip
1 2011-11-10 30 4
2 2011-11-12 40 2
3 2011-11-11 10 1
4 2011-11-09 20 3
> #
> tip <- tip[order(tip$date), ]
> transform(tip, total_bill = cumsum(total_bill), tip = cumsum(tip))
date total_bill tip
4 2011-11-09 20 3
1 2011-11-10 50 7
3 2011-11-11 60 8
2 2011-11-12 100 10](https://image.slidesharecdn.com/rdataframemanupilation-111112012754-phpapp01/75/R-22-2048.jpg)
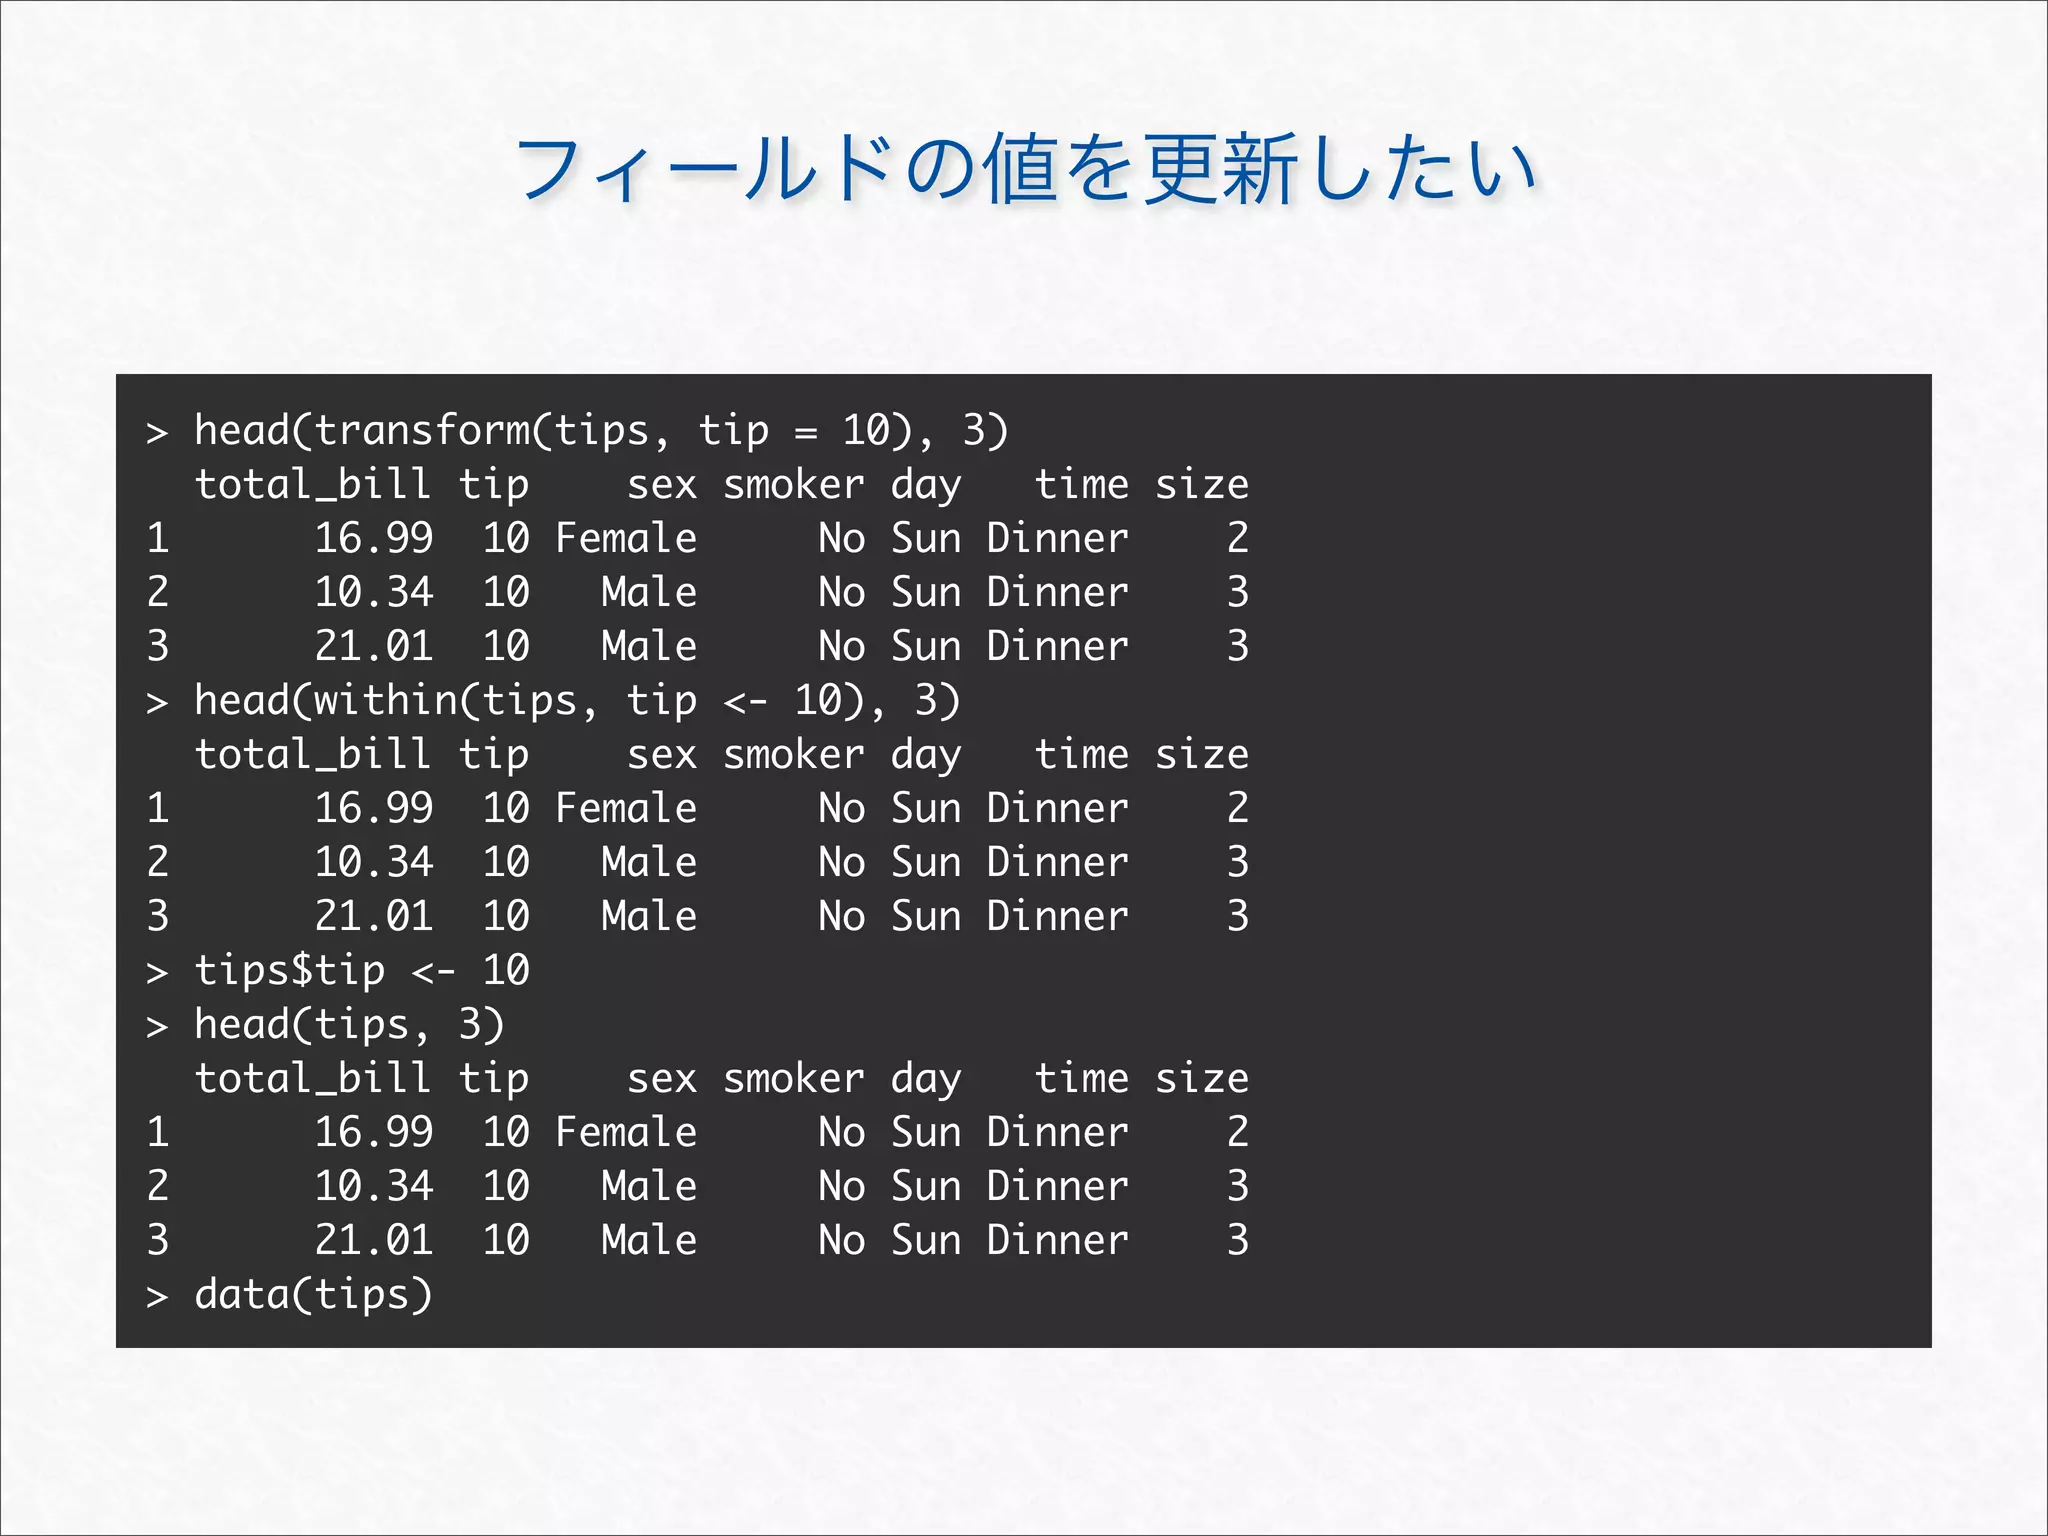
![> head(tips[c("tip", "total_bill", "sex", "size", "time", "day", "smoker")])
tip total_bill sex size time day smoker
1 10 16.99 Female 2 Dinner Sun No
2 10 10.34 Male 3 Dinner Sun No
3 10 21.01 Male 3 Dinner Sun No
4 10 23.68 Male 2 Dinner Sun No
5 10 24.59 Female 4 Dinner Sun No
6 10 25.29 Male 4 Dinner Sun No](https://image.slidesharecdn.com/rdataframemanupilation-111112012754-phpapp01/75/R-23-2048.jpg)

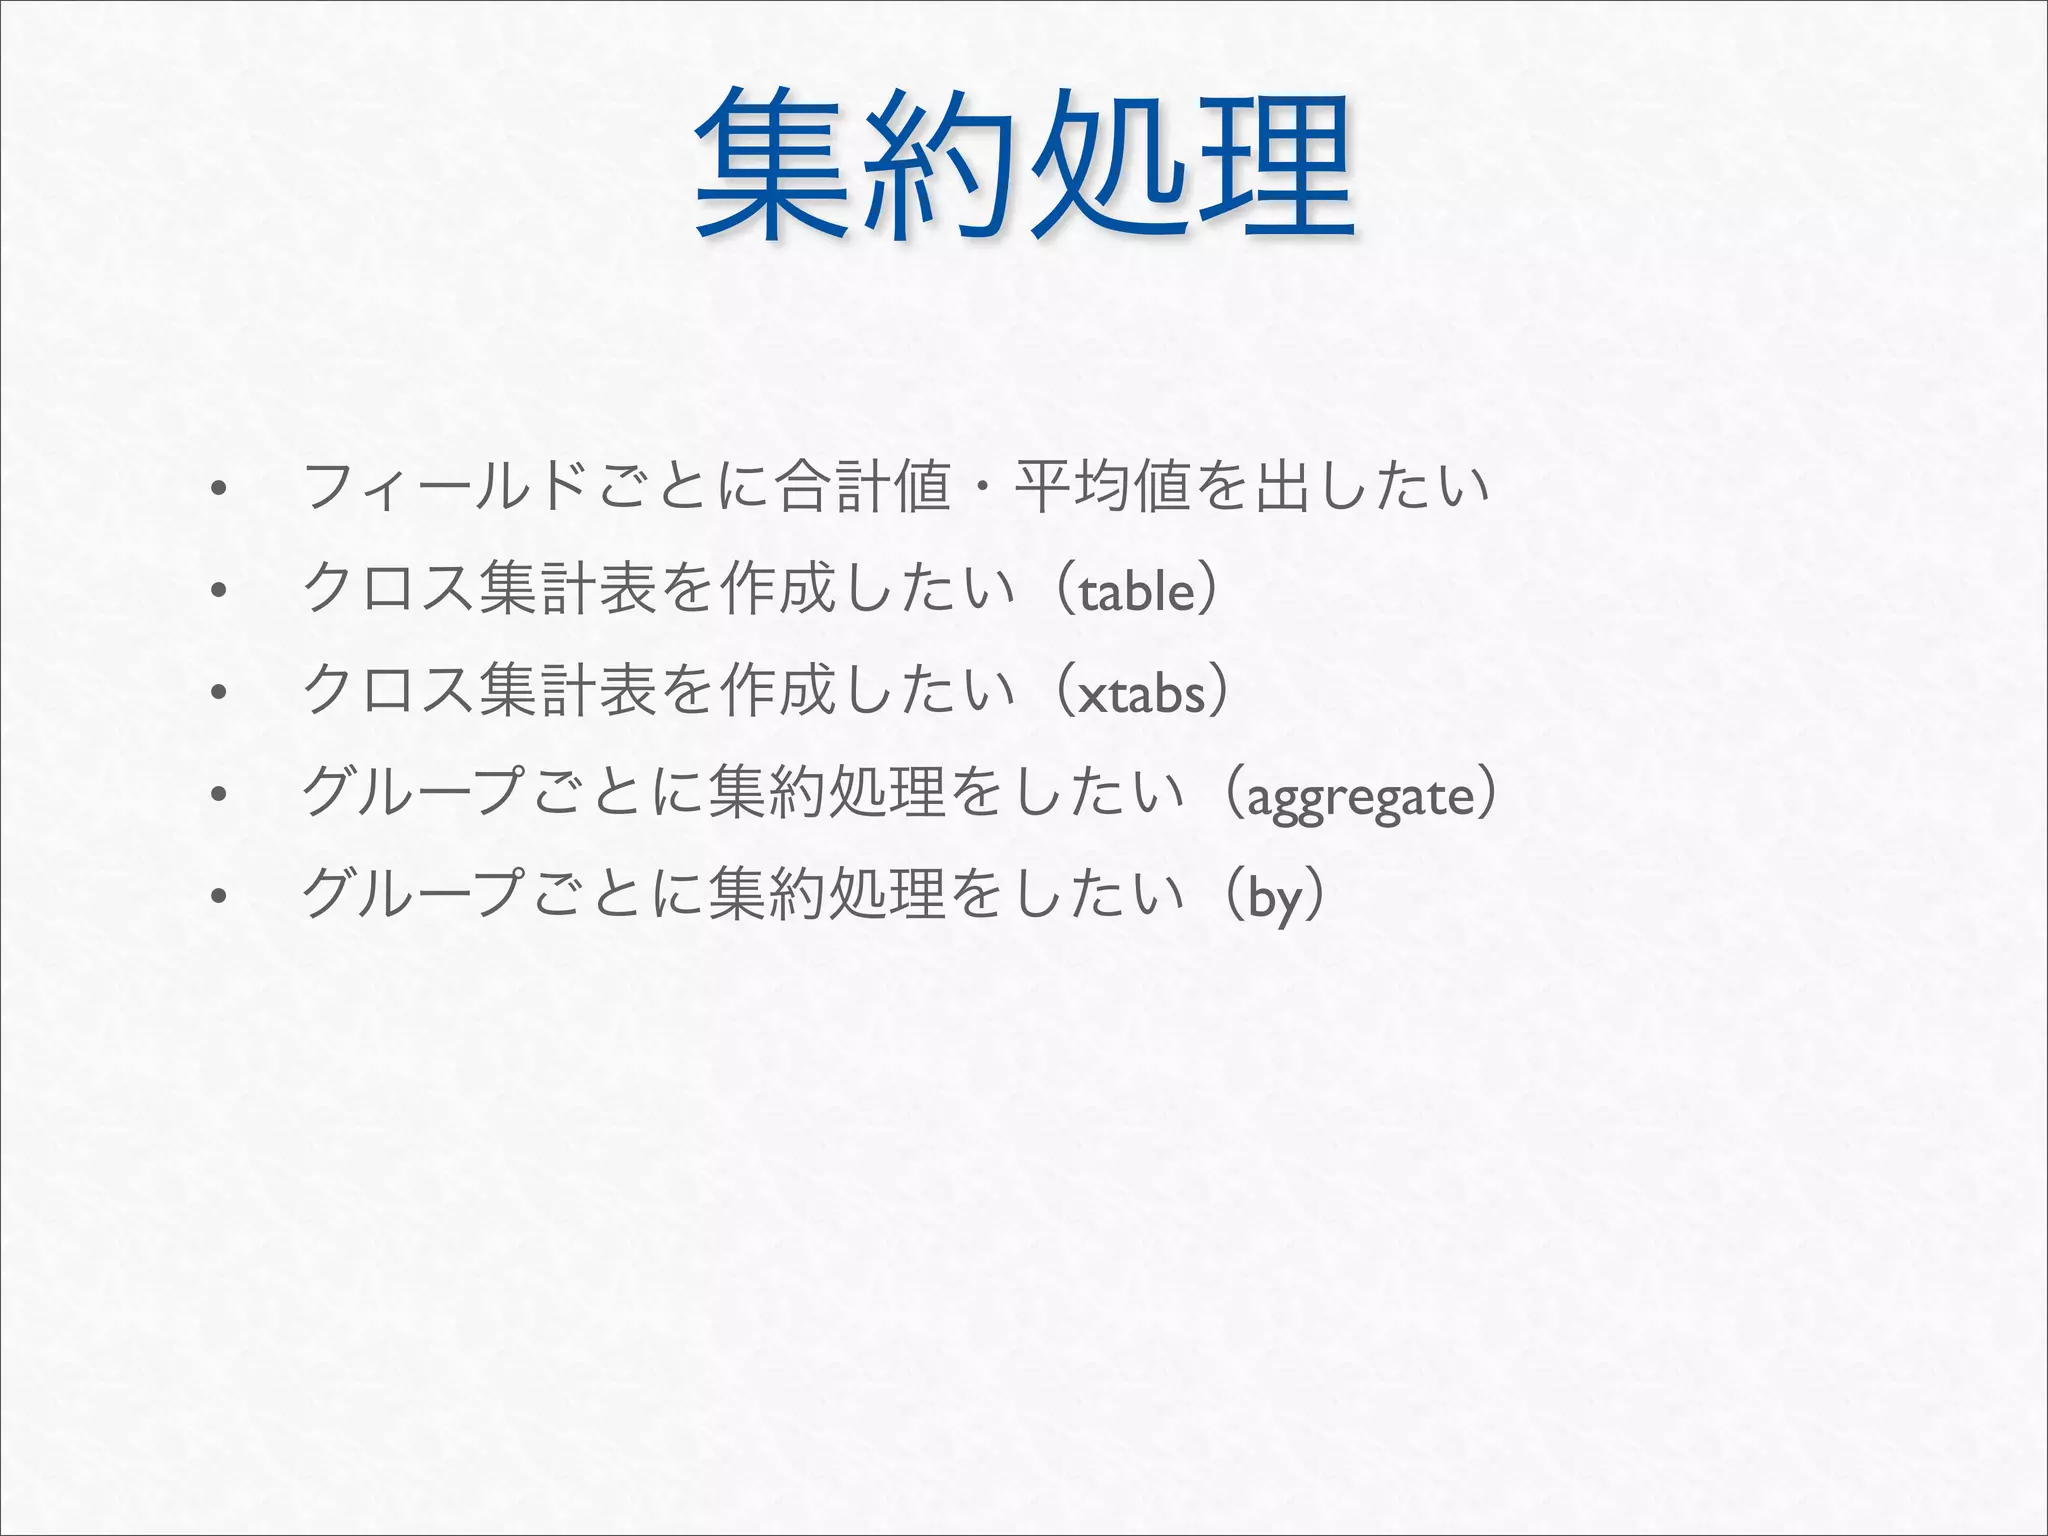
![aggregate
> args(aggregate.data.frame)
function (x, by, FUN, ..., simplify = TRUE)
NULL
> # FUN 1
> aggregate(tips[c("total_bill", "tip")], tips[c("sex", "day")], sum)
sex day total_bill tip
1 Female Fri 127.31 25.03
2 Male Fri 198.57 26.93
3 Female Sat 551.05 78.45
4 Male Sat 1227.35 181.95
5 Female Sun 357.70 60.61
6 Male Sun 1269.46 186.78
7 Female Thur 534.89 82.42
8 Male Thur 561.44 89.41
> # formula
> aggregate(cbind(total_bill, tip) ~ sex + day, tips, sum)
sex day total_bill tip
1 Female Fri 127.31 25.03](https://image.slidesharecdn.com/rdataframemanupilation-111112012754-phpapp01/75/R-30-2048.jpg)
![by
> args(by)
function (data, INDICES, FUN, ..., simplify = TRUE)
NULL
> # aggregate FUN OK
> (ret <- by(tips[c("total_bill", "tip")], tips[c("sex", "day")], range))
sex: Female
day: Fri
[1] 1.00 22.75
------------------------------------------------------------
sex: Male
day: Fri
[1] 1.50 40.17
> # data.frame
> cbind(expand.grid(dimnames(ret)), do.call(rbind, ret))
sex day 1 2
1 Female Fri 1.00 22.75
2 Male Fri 1.50 40.17](https://image.slidesharecdn.com/rdataframemanupilation-111112012754-phpapp01/75/R-31-2048.jpg)

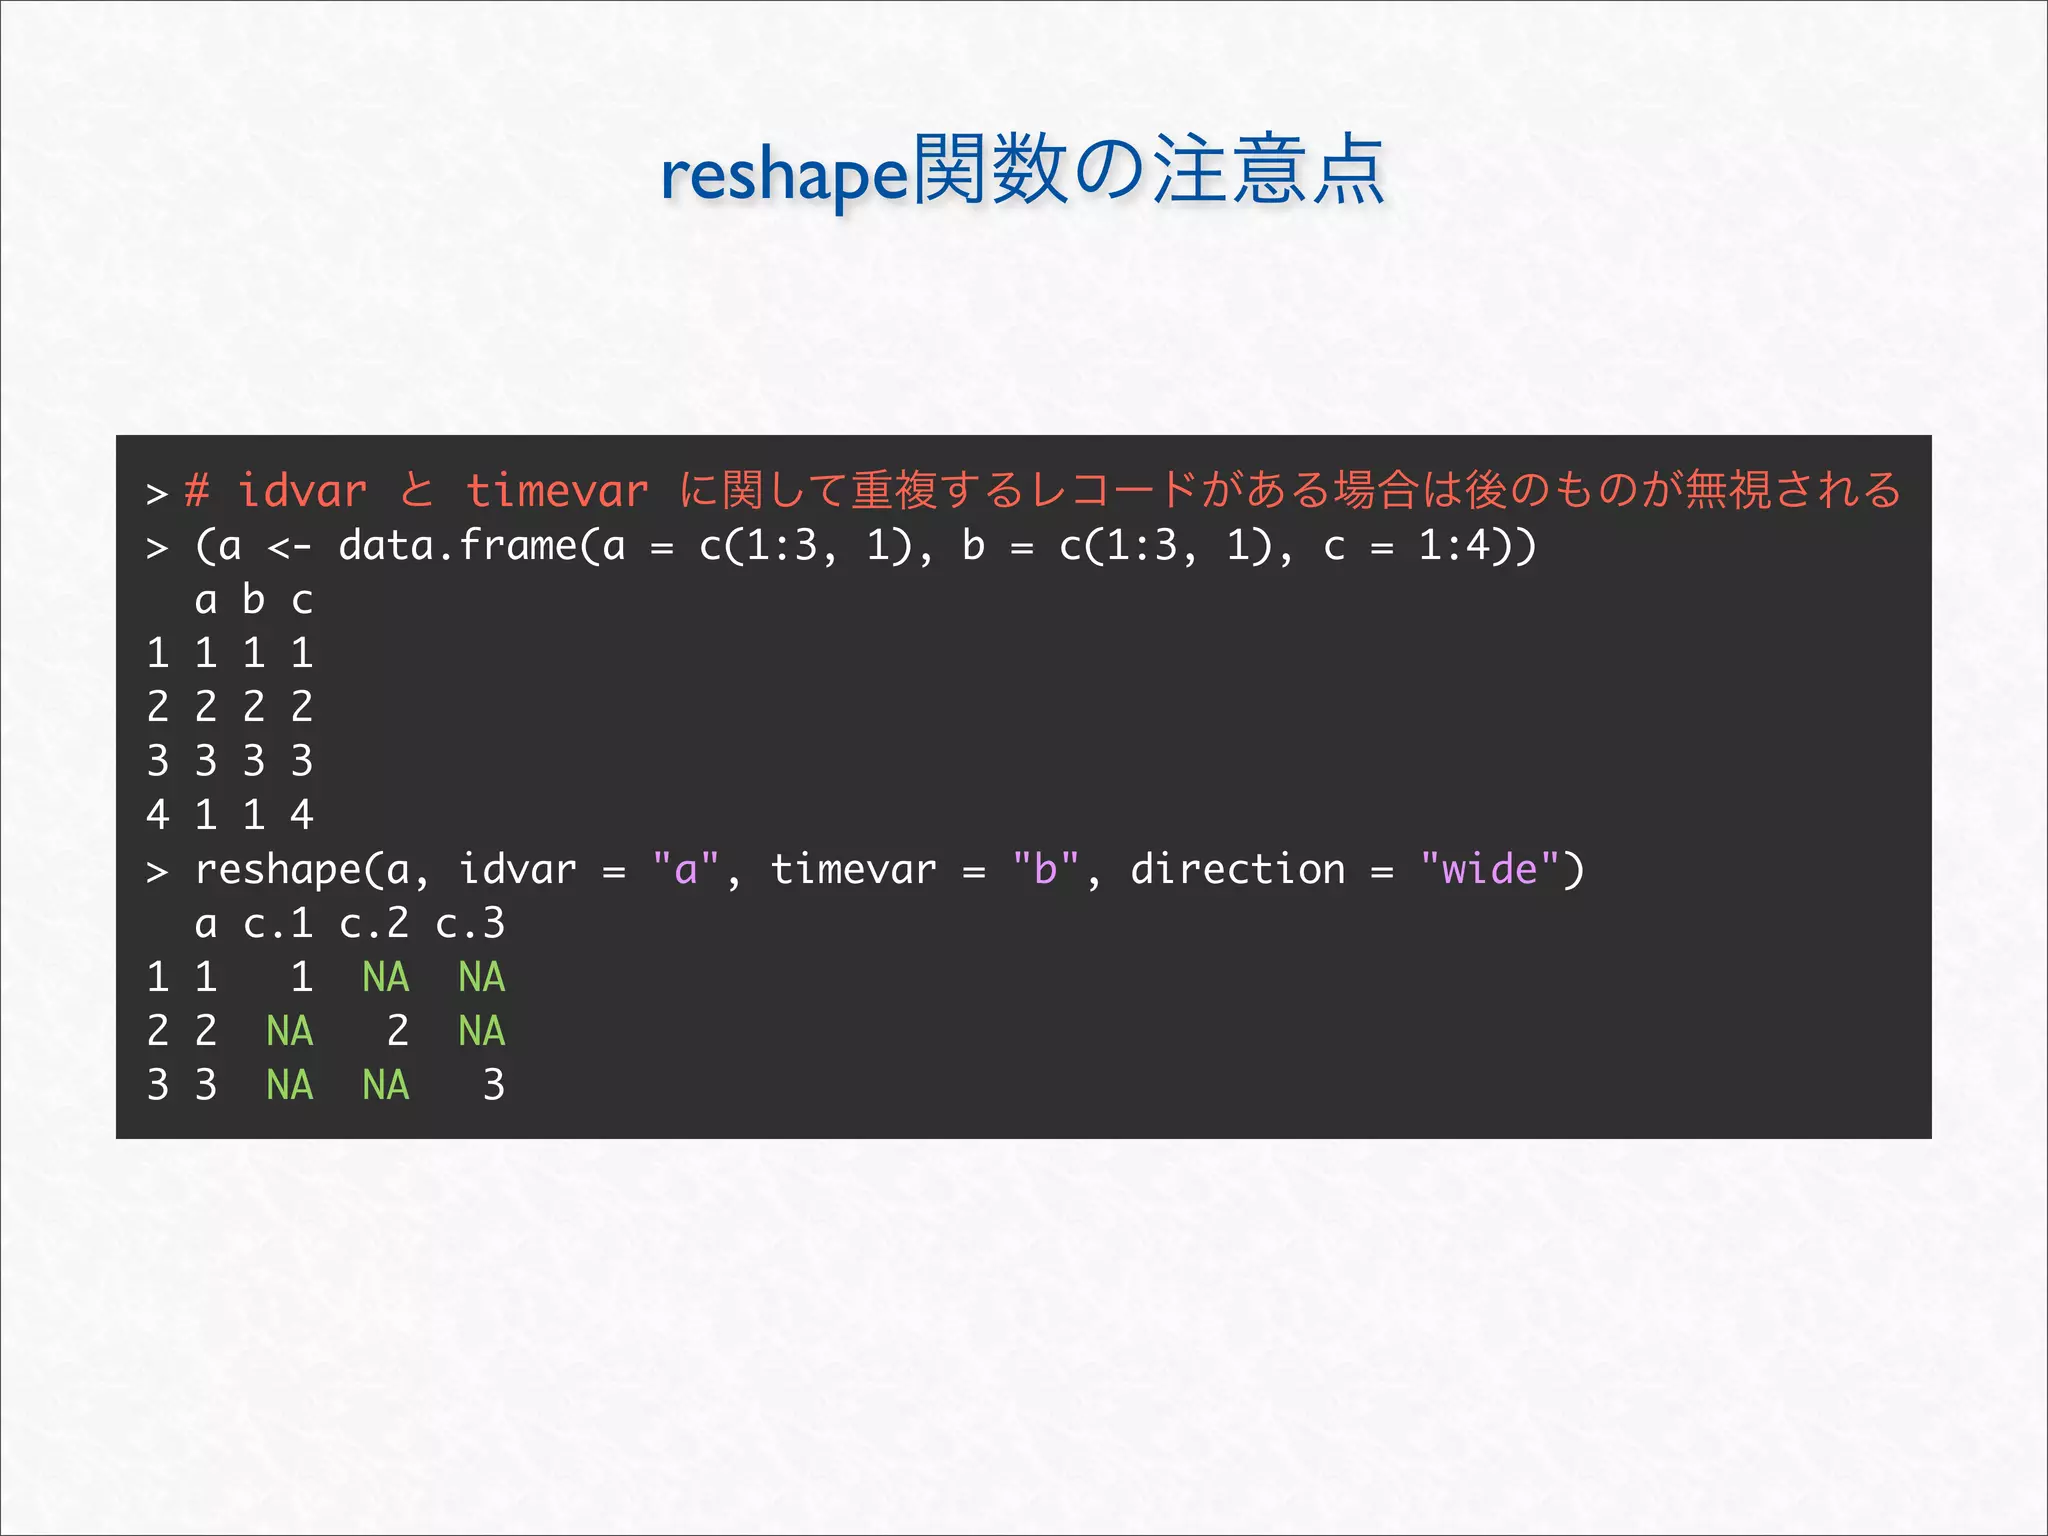
![reshape
> args(reshape)
function (data, varying = NULL, v.names = NULL, timevar = "time",
idvar = "id", ids = 1L:NROW(data), times = seq_along(varying[[1L]]),
drop = NULL, direction, new.row.names = NULL, sep = ".",
split = if (sep == "") {
list(regexp = "[A-Za-z][0-9]", include = TRUE)
} else {
list(regexp = sep, include = FALSE, fixed = TRUE)
})
NULL
> head(reshape(tips, idvar = c("sex", "smoker", "time", "size"),
+ timevar = "day", drop = "total_bill", direction = "wide"))
sex smoker time size tip.Sun tip.Sat tip.Thur tip.Fri
1 Female No Dinner 2 1.01 2.75 3 3.25
2 Male No Dinner 3 1.66 3.35 NA NA
4 Male No Dinner 2 3.31 4.08 NA 3.50
5 Female No Dinner 4 3.61 2.45 NA NA
6 Male No Dinner 4 4.71 7.58 NA NA
17 Female No Dinner 3 1.67 3.07 NA NA](https://image.slidesharecdn.com/rdataframemanupilation-111112012754-phpapp01/75/R-34-2048.jpg)
![merge
> #
> (user.type <- data.frame(sex = rep(c("Male", "Female"), each = 2),
+ smoker = c("Yes", "No"),
+ type = LETTERS[1:4]))
sex smoker type
1 Male Yes A
2 Male No B
3 Female Yes C
4 Female No D
> args(merge.data.frame)
function (x, y, by = intersect(names(x), names(y)), by.x = by,
by.y = by, all = FALSE, all.x = all, all.y = all, sort = TRUE,
suffixes = c(".x", ".y"), incomparables = NULL, ...)
NULL
> merge(tips, user.type, by = c("sex", "smoker"), sort = FALSE)[54:55, ]
sex smoker total_bill tip day time size type
54 Female No 10.65 1.50 Thur Lunch 2 D
55 Male No 10.27 1.71 Sun Dinner 2 B](https://image.slidesharecdn.com/rdataframemanupilation-111112012754-phpapp01/75/R-36-2048.jpg)

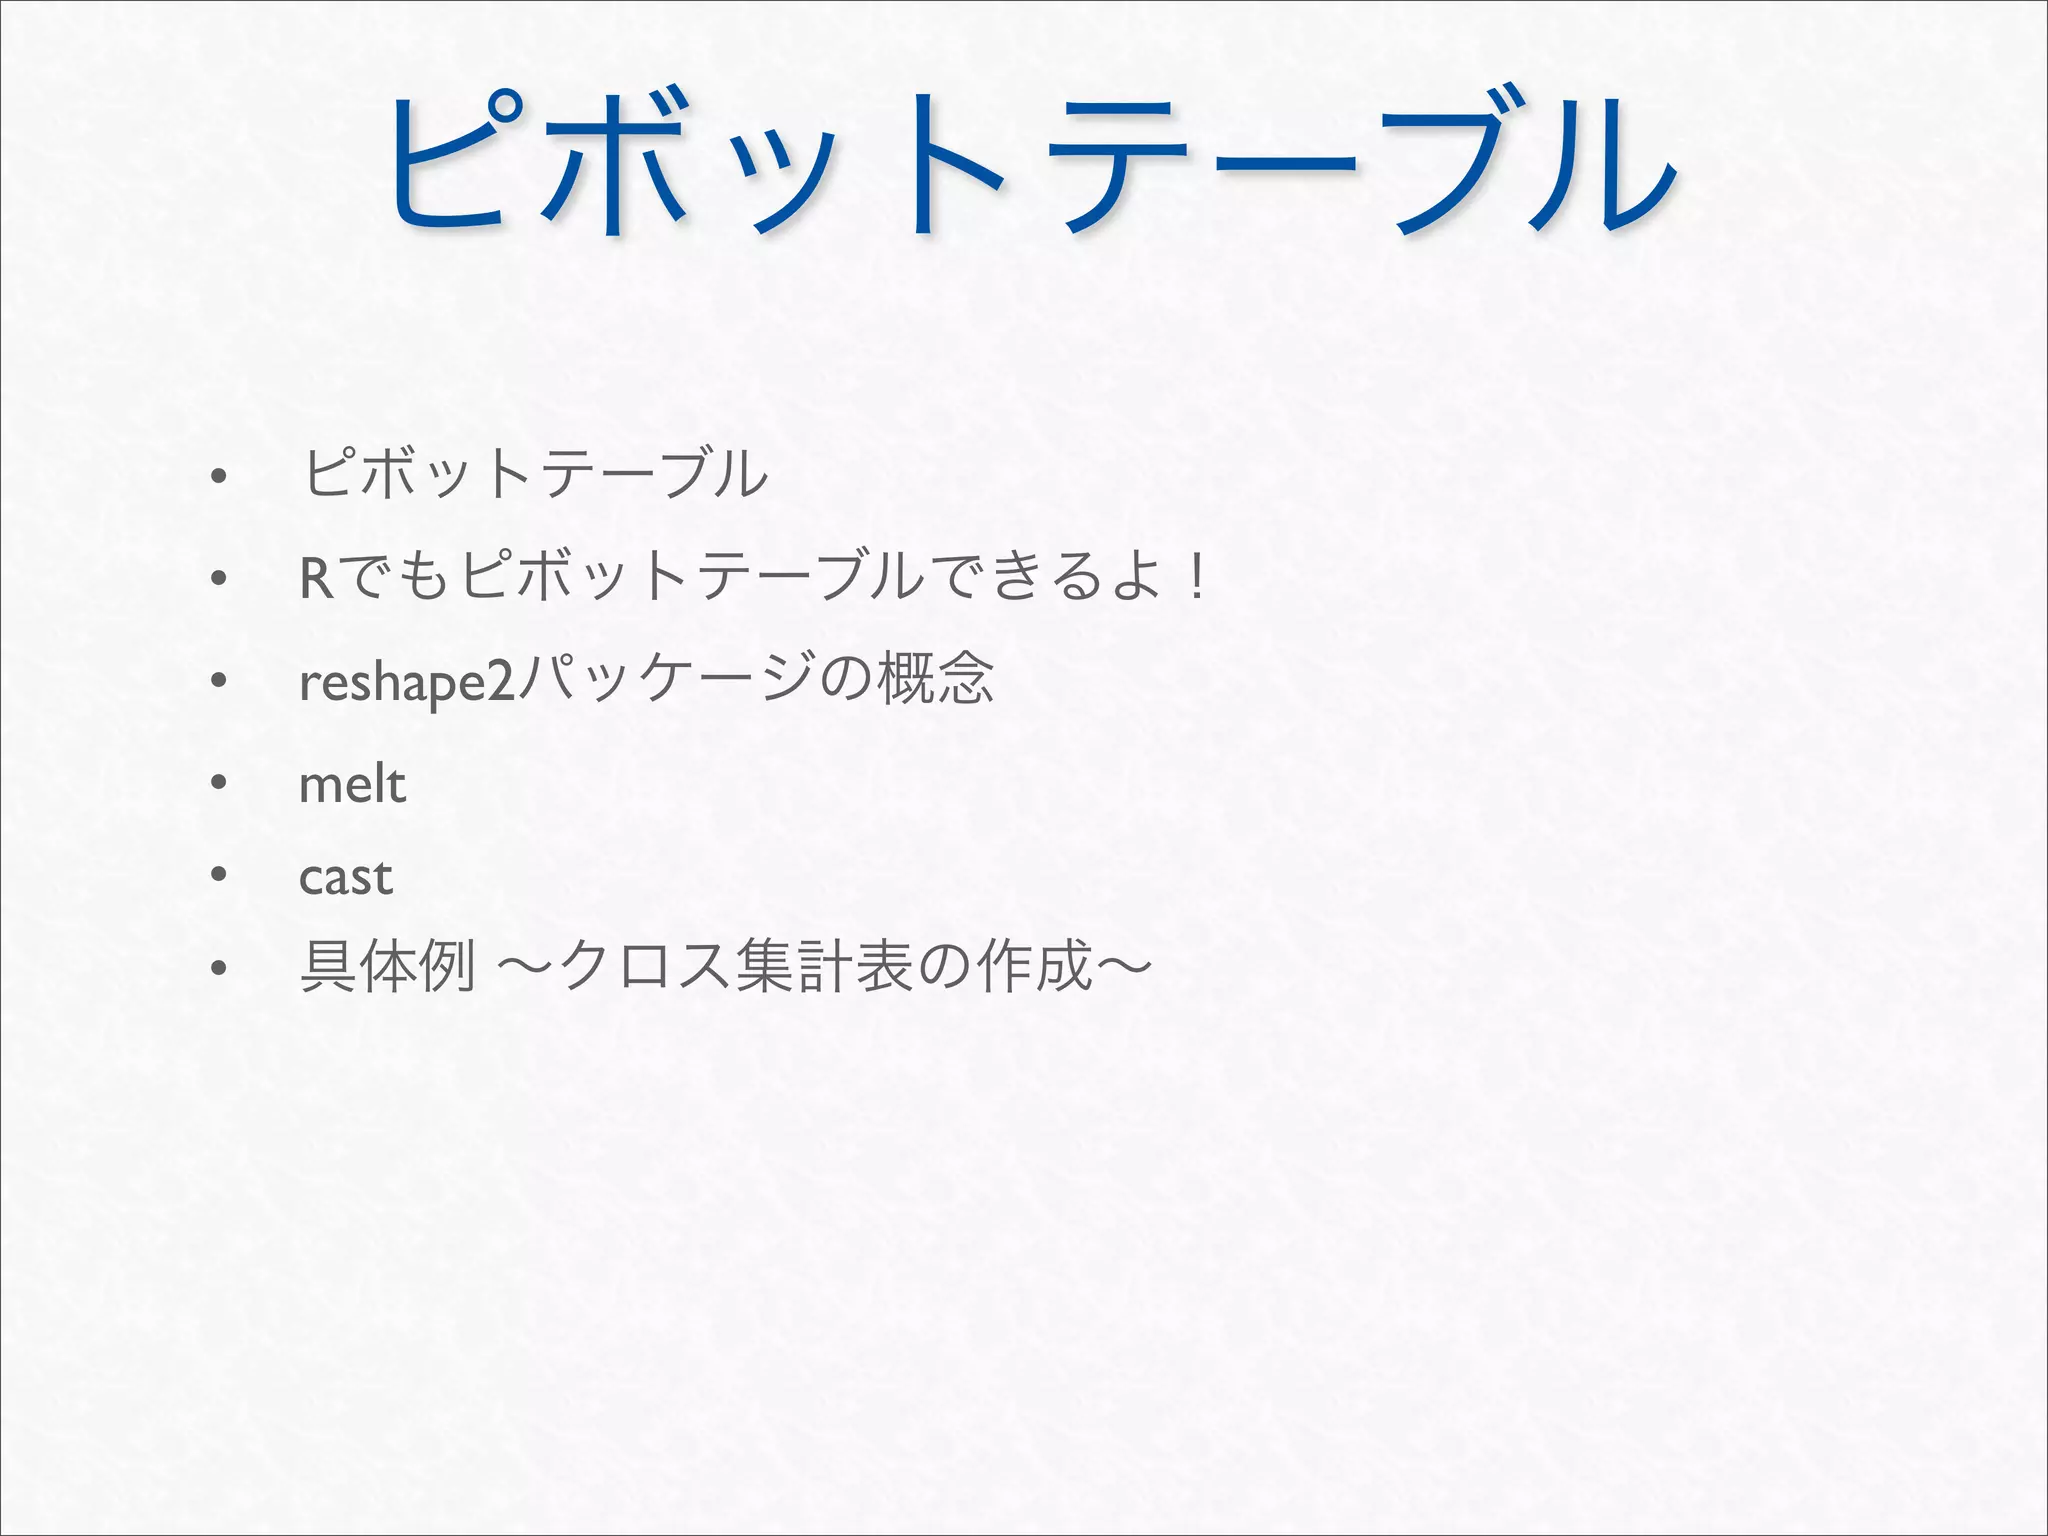
![reshape2
melt cast
melt
id
> head(tipsm <- melt(tips, measure.vars = c("total_bill", "tip")))
sex smoker day time size variable value
1 Female No Sun Dinner 2 total_bill 16.99
2 Male No Sun Dinner 3 total_bill 10.34
3 Male No Sun Dinner 3 total_bill 21.01
4 Male No Sun Dinner 2 total_bill 23.68
5 Female No Sun Dinner 4 total_bill 24.59
6 Male No Sun Dinner 4 total_bill 25.29
> levels(tipsm$variable)
[1] "total_bill" "tip"](https://image.slidesharecdn.com/rdataframemanupilation-111112012754-phpapp01/75/R-41-2048.jpg)


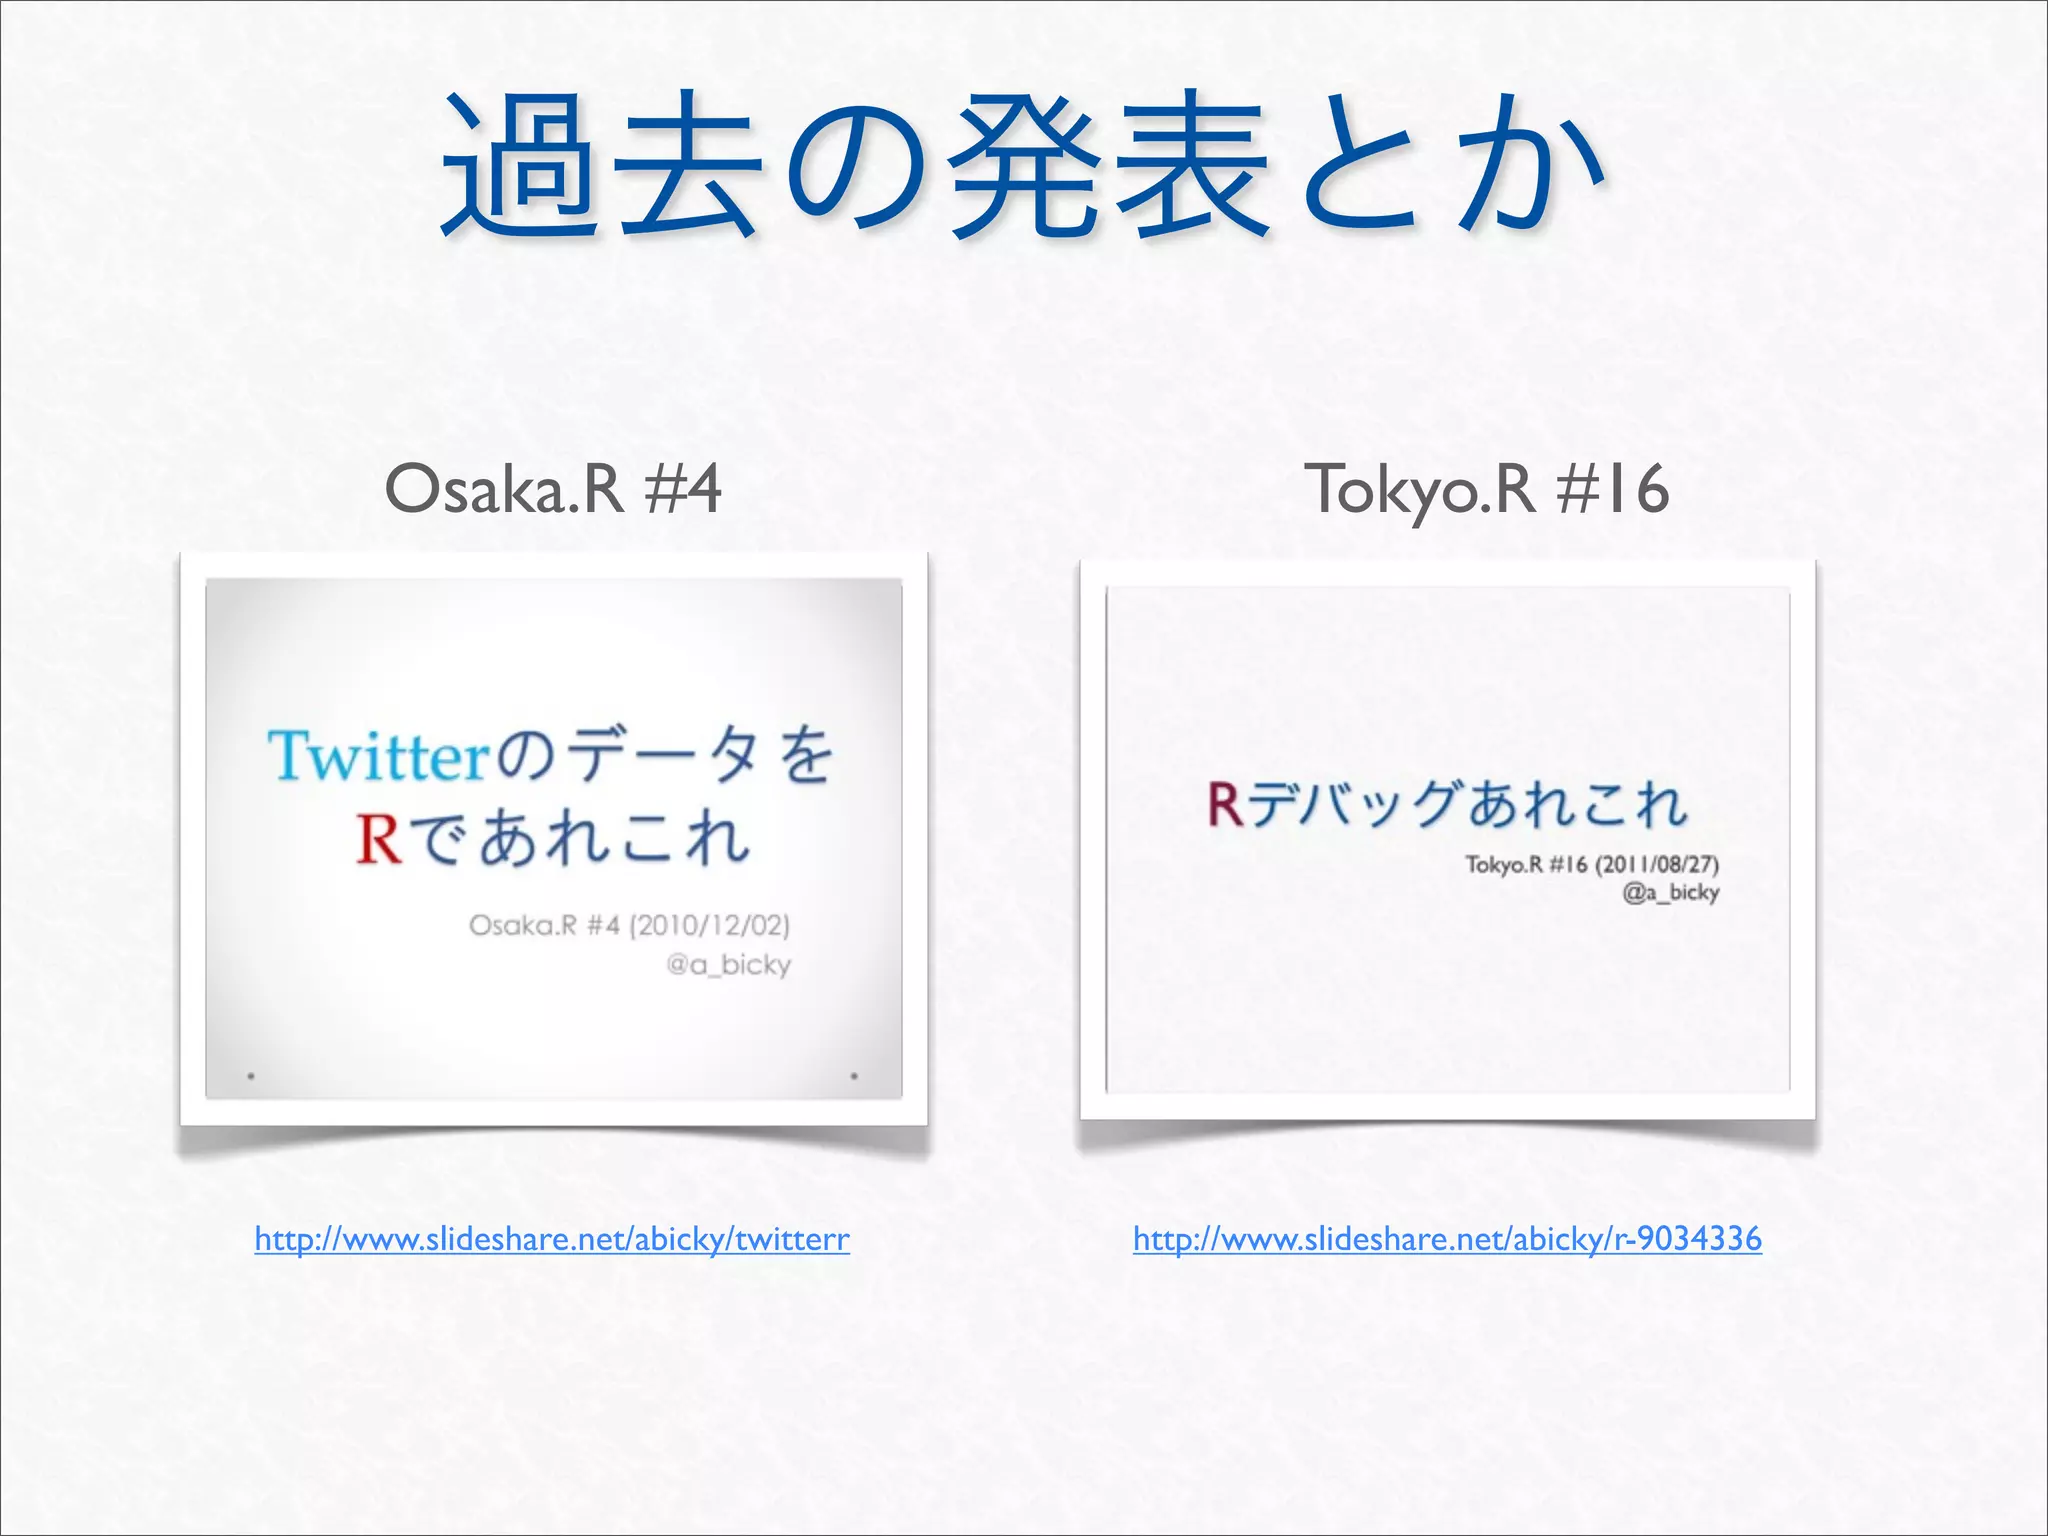
This document summarizes information about a person named Takeshi Arabiki. It includes: 1. Their Twitter handle is @a_bicky and ID is id:a_bicky. 2. A link to their blog on Hatena is provided. 3. They have written books and slides about using R and SciPy. 4. Links are provided to their slideshare presentations about using Twitter and R.


