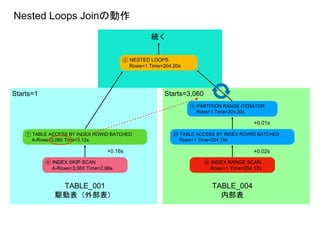
⑥ NESTED LOOPS
Rows=1Time=204.20s
TABLE_001
駆動表(外部表)
TABLE_004
内部表
Starts=1
続く
⑧ INDEX SKIP SCAN
A-Rows=3,060 Time=2.96s
⑦ TABLE ACCESS BY INDEX ROWID BATCHED
A-Rows=3,060 Time=3.12s
+0.16s
⑪ INDEX RANGE SCAN
Rows=1 Time=204.17s
+0.02s
⑩ TABLE ACCESS BY INDEX ROWID BATCHED
Rows=1 Time=204.19s
⑨ PARTITION RANGE ITERATOR
Rows=1 Time=204.20s
+0.01s
Starts=3,060
Nested Loops Joinの動作
7.
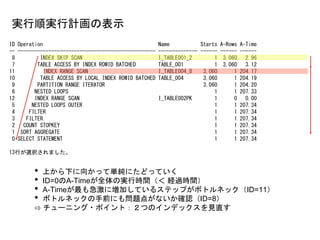
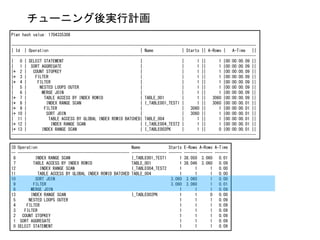
ID Operation NameStarts A-Rows A-Time
-- ------------------------------------------------- -------------- ------ ------ ------
8 INDEX SKIP SCAN I_TABLE001_2 1 3,060 2.96
7 TABLE ACCESS BY INDEX ROWID BATCHED TABLE_001 1 3,060 3.12
11 INDEX RANGE SCAN I_TABLE004_8 3,060 1 204.17
10 TABLE ACCESS BY LOCAL INDEX ROWID BATCHED TABLE_004 3,060 1 204.19
9 PARTITION RANGE ITERATOR 3,060 1 204.20
6 NESTED LOOPS 1 1 207.33
12 INDEX RANGE SCAN I_TABLE002PK 1 0 0.00
5 NESTED LOOPS OUTER 1 1 207.34
4 FILTER 1 1 207.34
3 FILTER 1 1 207.34
2 COUNT STOPKEY 1 1 207.34
1 SORT AGGREGATE 1 1 207.34
0 SELECT STATEMENT 1 1 207.34
13行が選択されました。
実行順実行計画の表示
• 上から下に向かって単純にたどっていく
• ID=0のA-Timeが全体の実行時間(< 経過時間)
• A-Timeが最も急激に増加しているステップがボトルネック(ID=11)
• ボトルネックの手前にも問題点がないか確認(ID=8)
⇨ チューニング・ポイント:2つのインデックスを見直す
8.
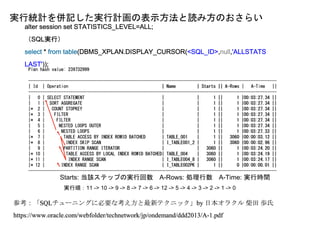
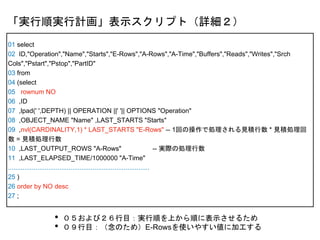
01 select
02 ID,"Operation","Name","Starts","E-Rows","A-Rows","A-Time","Buffers","Reads","Writes","SrchCols","Pstart","Pstop","PartID"
03 from
04 (select
05 rownum NO
06 ,ID
07 ,lpad(' ',DEPTH) || OPERATION ||' '|| OPTIONS "Operation"
08 ,OBJECT_NAME "Name" ,LAST_STARTS "Starts"
09 ,nvl(CARDINALITY,1) * LAST_STARTS "E-Rows" -- 1回の操作で処理される見積行数 * 見積処理回数 = 見積処理行数
10 ,LAST_OUTPUT_ROWS "A-Rows" -- 実際の処理行数
11 ,LAST_ELAPSED_TIME/1000000 "A-Time"
12 ,LAST_CR_BUFFER_GETS "Buffers",LAST_DISK_READS "Reads",LAST_DISK_WRITES "Writes"
13 ,SEARCH_COLUMNS "Srch Cols"
14 --,COST
15 ,PARTITION_START "Pstart",PARTITION_STOP "Pstop",PARTITION_ID "PartID"
16 from
17 (select a.* from
18 V$SQL_PLAN_STATISTICS_ALL a
19 where a.SQL_ID = '&1'
20 and a.TIMESTAMP = (select max(b.TIMESTAMP) from V$SQL_PLAN_STATISTICS_ALL b where b.SQL_ID = a.SQL_ID)
21 )
22 start with PARENT_ID is null
23 connect by prior ID = PARENT_ID
24 order siblings by ID desc
25 )
26 order by NO desc
27 ;
「実行順実行計画」表示スクリプト(全体)
9.
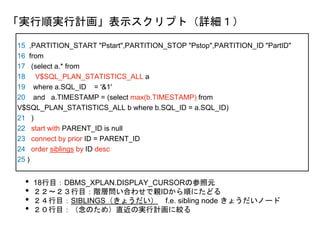
15 ,PARTITION_START "Pstart",PARTITION_STOP"Pstop",PARTITION_ID "PartID"
16 from
17 (select a.* from
18 V$SQL_PLAN_STATISTICS_ALL a
19 where a.SQL_ID = '&1'
20 and a.TIMESTAMP = (select max(b.TIMESTAMP) from
V$SQL_PLAN_STATISTICS_ALL b where b.SQL_ID = a.SQL_ID)
21 )
22 start with PARENT_ID is null
23 connect by prior ID = PARENT_ID
24 order siblings by ID desc
25 )
「実行順実行計画」表示スクリプト(詳細1)
• 18行目:DBMS_XPLAN.DISPLAY_CURSORの参照元
• 22〜23行目:階層問い合わせで親IDから順にたどる
• 24行目:SIBLINGS(きょうだい) f.e. sibling node きょうだいノード
• 20行目:(念のため)直近の実行計画に絞る


![[Oracle Code Tokyo 2017] Live Challenge!! SQLパフォーマンスの高速化の限界を目指せ!](https://cdn.slidesharecdn.com/ss_thumbnails/livechallengeoraclecodetokyo2017v4-200702090817-thumbnail.jpg?width=640&height=640&fit=bounds)