
Recommended
Recommended
More Related Content
Similar to Question 1. Two parallel flocculation basins are to be used to tre.docx
Similar to Question 1. Two parallel flocculation basins are to be used to tre.docx (16)
More from IRESH3
More from IRESH3 (20)
Recently uploaded
Recently uploaded (20)
Question 1. Two parallel flocculation basins are to be used to tre.docx
- 1. Question 1. Two parallel flocculation basins are to be used to treat water flow of 150m3/s. If the design detention time is 20minute, what is the volume of each tank? If the average velocity gradient in these two tanks is 124/s, calculate the velocity gradient is each basin if the gradient in second basin is half of the first one. Question 2. Determine the volume of the aeration tank for the following operating conditions: Influent BOD5 concentration after the primary is = 150mg/L Wastewater flow rate = 10MGD F/M ratio = 0.2/d Mixed Liquor volatile suspended solid concentration = 2200mg/L Question 3. Given below is the wastewater characteristics, determine the F/M ratio? (10 Points) Influent BOD5 concentration = 84mg/L Wastewater flow rate = 0.150m3/s Volume of the aeration tanks = 970m3 Mixed Liquor volatile suspended solid concentration = 2000mg/L Question 4. What is the terminal settling velocity of a particle with a specific gravity of 1.4 and a diameter of 0.010mm in 20oC water? Would this particle be completely removed in a settling basin with a width of 10.0m, depth of 3.0m, a length of 30.0m, and a flow rate of 7500m3/d? What is the smallest diameter particle of specific gravity 1.4 that would be removed in the sedimentation basin described above? Question 5. Will grit particle with a radius of 0.04mm and a specific gravity of 2.65 be collected in a horizontal grit chamber that is 13.5m in length if the average grit-chamber flow is 0.15m3/s, the width of the chamber is 0.56m, and the horizontal velocity is 0.25m/s? The wastewater temperature is 22oC.
- 2. Question 6. Wastewater treatment plant flow rate is 20MGD. Chlorine dosage is 10mg/L. Determine chlorine requirement (lb/day) Question 7. If a particle having a 0.0170-cm radius and density of 1.95g/cm3 is allowed to fall into quiescent water having a temperature of 4oC, what will be the terminal settling velocity? Assume the density of water = 1000kg/m3. Assume Stoke’s law applies? Question 8. If the terminal settling velocity of a particle falling in quiescent water having a temperature of 15oC is 0.0950cm/s, what is its diameter? Assume a particle density of 2.05g/cm3 and density of water equal to 1000kg/m3. µ@15oC = 1.139 mPa-s ρ @15oC = 999.103kg/m3 Question 9. Determine the diameter of a single-stage rock media filter to reduce an applied BOD5 of 125mg/L to 25mg/L. Use a flow rate of 0.14m3/s, a recirculation ratio of 12.0 and a filter depth of 1.83m. Assume the NRC equations apply and that the wastewater temperature is 20oC? Question 10. Bacterial kill rate typically follows Chick’s law. If the first-order kill rate for a certain weak disinfectant is 0.067/h. Determine the time it will take to reduce the bacterial population to half of its original concentration? Question 11. A town discharges 17,360 m3/d of treated wastewater into the Creek. The Creek has a flow rate of 0.43m3/s and the DO of the creek is 6.5 mg/L and DO of the wastewater is 1.0 mg/L. Compute the DO? Question 12. The reaction for a biologically degraded contaminant is first order. The half-life of the contaminant is 3 week. Determine the degradation rate? Question 13. A sewage lagoon that has a surface area of 10 ha and a depth of 1 m is receiving 8640 m3/d of sewage containing 100 mg/L of biodegradable contaminant. At steady state, the effluent from the lagoon must not exceed 20 mg/L of biodegradable contaminant. Assuming the lagoon is well mixed and that there are no losses or gains of water in the lagoon other
- 3. than the sewage input, what biodegradation reaction rate coefficient must be achieved for a first-order reaction Question 14. A colony of bacteria exhibit exponential growth behavior. If the number of bacteria doubles in 3 hours, how long will it take for the size of the colony to triple? Question 15. A sample of diluted wastewater (diluted 10 times) has a 5 – day BOD of 5 mg/L. If the rate constant is 0.1/d, determine the ultimate BOD of the original wastewater? Question 16. Question 17. The rate of reaction for an enzyme- catalyzed substrate in a batch reactor can be described by the following relationship: where k = maximum reaction rate; mg/ L min C= substrate concentration, mg/ L; K = constant, mg/ L Using this rate expression, derive an equation that can be used to predict the reduction of substrate concentration with time in a batch reactor. If k equals 40 mg/ L.min and K= 100 mg/ L, determine the time required to decrease the substrate concentration from 1000 to 100 mg/ L. C K kC r c + = 65 DESIGNING AN EXPERIMENT
- 4. To understand these different designs, I will start with the process of designing an experiment. Experiments are intended to explore cause-and- effect relationships. Sup- pose researchers want to determine whether a relatively inexpensive organic fertilizer is effective in increasing the crop yield of corn. Researchers can create two separate growing areas in a greenhouse and randomly assign the corn seeds to the test area with the organic fertilizer and to another area without it. Both areas receive the same soil, temperature, sunlight, and water. The scientists thus control for all the key variables so that the only difference between the two areas is the organic fertilizer. The yields are measured when the corn is harvested. If the test area with the organic fertilizer ha~ a higher yield of corn than the comparison area without the fertilizer, then the '-Cientists will conclude that the organic fertilizer made the difference. But what happens if the research is conducted in the field instead of the controlled en ironment of the greenhouse? If the two areas are close together, the fertilizer might run off into the comparison area, thus giving an imperfect measure of the impact of the fertilizer. The researchers might move the comparison area to a different part of the field to avoid run-off, but then the soil, light, temperature, and/or rain may be ,Jightly different. Even if the corn yield with the organic fertilizer is higher than the
- 5. corn yield without it, whether the fertilizer alone caused the differences in the yield , ' not absolutely clear. Clearly, working in the field does not give researchers as much control as they have m the greenhouse, making it more challenging to conclude that a cause-and-effect ~e lationship exists. Similarly, because public administration research often takes place ··in the field'' rather than a laboratory, it is difficult to control everything . . A.=FILYING THE DESIGN ELEMENTS: THE Xs AND OS fRAMEWORK Researchers design their studies using various combinations of the design elements. hi le they may prefer to use specific elements, the situation constrains their choices. s~•metime the researchers can use before-and-after measures, sometimes they can use many measures before and after, and sometimes they can use only a single measure ;.1thered after the program is implemented. Similarly, sometimes they have a com- ::-arison group and sometimes they do not. I call this very narrow concept of research Jesign the Xs and Osframework because of the particular notation used as shorthand ~,,Jr describing the design elements: .Y is the causal factor, program, or treatment (you might think of this as the indepen- dent variable).
- 6. n is the observation or the measure of the effect (you might think of this as the measure of the dependent variable). To understand the different ways these design elements can be applied and their limitations, let us walk through the design options available to determine the impact of a stress reduction program in an organization. I will present them using the non- experimental, quasi-experimentaL and experimental categories. 66 NONEXPERIMENTAL DESIGN The human resources director asks for volunteers to participate in a stress reduction program and accepts the first fifty employees who raise their hand. At the end of three months, they are given a stress test to measure whether the program was successful in reducing stress. This one-shot design is the simplest, and the notation looks like this: · X 0 (the stress reduction program) (observation or measurement: the stress test) If the researchers find that the majority (75 percent) of the participants have low stress tests after the program, can the human resources director claim that the program
- 7. is a success? Although she may make the claim, it lacks credibility because too many other factors might actually explain the observed results. Maybe the fifty participants were longtime meditation gurus. so their stress levels were already low. Without a baseline-a measure taken before the program began-it is hard to say whether the program actually changed the participants' stress levels. To fix that, the researchers might opt to use a before-and-after design, if it is pos- sible. They administer a stress test to the participants before starting the program ( 0 1 ): this is the pretest or the baseline measure. At the end of three months in the program, they readminister the stress test (0:): this is the posttest. The notation would look like this: 01 X o, (stress test) (the program) (stress test) Have the stress levels changed? Suppose the researchers find that stress levels in the posttest are lower than they were before the program started. Does that mean the program was successful? Maybe. However, rival explanations might exist to explain the observed drop in the stress tests. Perhaps the agency's stress-provoking director left the organization during the first month of the program and that really explains the lower stress levels observed in the posttest. To control for this, the researchers could choose to use a
- 8. comparison group of employees who do not participate in the program but who take the same stress test as the participants three months after the program begins. This is called a static group design, and the notation would look like this: Program participants Comparison group X 0 0 Perhaps the researchers find little difference between the groups. Did the program fail? Maybe. But it is also possible that the compari~on group learned about the stress reduction techniques from people in the program and began using the techniques on their own. Alternatively, they may have already been u.;ing various stress reduction _-:::: ~-·.::: --~ .... _ --~ - 67 ~c~ 1mques. While the temptation would be to conclude that the program did not work. the reality is that the researchers do not know. These three designs, which are called nonexperimental designs, share a weakness in being unable to control very much. Nonexperimental designs are perfectly fine to answer descriptive and normative questions. Sometimes researchers just want to take
- 9. a snapshot of a situation at one point in time. For example. what do citizens say are the most pressing problems facing the city right now? This is just a snapshot at one point in time. The researchers may compare responses of people based on income, educational level, or neighborhood using statistical analysis of data; this is often just descriptive infonnation. Other times. however. researchers will use statistical controls to demonstrate causal relationships. Therefore, sophisticated users of research results will look very carefully at the intention of the research to detem1ine whether the researchers want to simply describe a situation or demonstrate a cause-and- effect relationship. Nonexperimental designs. however. are the weakest for answering cause-and- effect questions because they cannot do much to eliminate rival explanations. That said, sometimes researchers find that no other design option is available given the particular situation. As a general rule, sophisticated users of research results should be very cautious in making firm conclusions or policy decisions when a nonexperimental design is used to answer a cause-and-effect question. QUASI-EXPERIMENTAL DESIGN Using more of the design elements will increase the strength of the design by giving the researchers more ability to rule out rival explanations. As a group, these designs are categorized as quasi-experimental because they have some
- 10. but not all the features of a true experiment. One type of quasi-experimental design is to expand the before- and-after design by taking several periodic measures instead of just a single postmeasure; generically, this is called a longitudinal design. For example, the researchers could extend the program for nine months and take stress measures every three months. While there might be an initial drop after the stress-provoking director leaves, what happens over time? This design is likely to moderate the effect of the departure of the director. The notation would look like this: oh~.·r(lft' X 0_7..month" oh month<; 09 month<; However, this design does not eliminate all other possible explanations. A major problem is that these volunteers might be unique. Perhaps they are highly motivated to reduce stress and do other stress reduction activities outside of work. Would this program work for those not so motivated? That is unknown based on this design. If the researchers combine a comparison group with a before- and-after design, they will have a nonequivalent comparison design. This is noted: Program group Comparison group X
- 11. 68 CHAPTER 5 In this design, both the participants and the comparison group (also called a control group) take a stress test before the program begins. The participants then engage in the program while the comparison group does not. At the end of three months, both groups take another stress test. The changes between the before- and-after measures of the program participants are compared to the changes in the comparison.group. This design controls for events such as the departure of the agency's stress-provok- ing director. If the stress level declines are still greater among program participants than in the comparison group, we would be more willing to give the program credit for at least some of the reduction. These groups, however, are not exactly the same (hence the name nonequivalent), so it is still possible that something about the groups themselves affects the results rather than the program. For example, suppose both groups are interested in stress reduction and actively meditate outside of the program. The research might not, therefore, show much change no matter how good the program is because both these groups were already at the lowest point in terms of the stress test. In this scenario,
- 12. the program would appear not to work. What else can the researchers do to design a stronger study? CLASSIC EXPERIMENTAL DESIGN The researchers can choose the third design element: random assignment. By adding it to the nonequivalent design, the researchers now have a classic experimental design (sometimes called a "clinical study"), which randomly assigns people to the stress program and the control group. This is noted: Random assignment Random assignment Program group Control group X Random assignment makes the groups comparable by distributing a range of dif- ferences to both groups. The health nuts, meditation gurus, workaholics, and couch potatoes are randomly assigned to the program or control group. Neither group is dominated by one type of person. Given the relative equality of the groups, there- searcher can feel confident in concluding that the program had an impact if the pro- gram participants show a substantial reduction in stress as compared to the control group. If, however, there was no difference between the groups, the researchers can
- 13. feel confident in concluding that the program had no impact. It should be noted that I am presenting a simple version of the classic experimental design here. Depending on the exact nature of the research, experimental designs can be very elaborate. For example, they can be designed so that the participants do not know if they are in the treatment or the control group (called a single-blind study), and sometimes neither the researchers nor the participants know (called a double-blind study). It is also possible to have multiple treatments (see Application 5.1 ). In studies testing medications, for example, the people in the control group might be given sugar pills to control for the "placebo effect." Researchers have found that the belief that taking a pill will make them better causes some people to get better. So DESIGNS FOR RESEARCH Application 5.1 Treating Depression An Experiment Robert Whitaker describes several clinical studies that looked at various treatments fo'r de- pression and mental illness in his book Anatomy of an Epidemic (201 0). One study compared the impact of three modalities in treating depression:
- 14. medication, medication plus exercise, or exercise alone (Blumenthal and Babyak, 2000). Participants in the study were volunteers aged fifty years and older who met DSM-IV criteria for major depressive disorder and were not taking any medications or self-medicating (alcohol. illegal drugs). One hundred and fifty-six people who met their research criteria were randomly assigned to one of the three groups for four months and were then tracked for an additional six months. While the antidepressants did well in reducing symptoms in the short term for the people in those groups, those people were also more likely to relapse (30 percent in the drug and drug with exercise groups, as compared to 8 percent in the exercise only group). At the end of the ten months, about 50 percent of the participants in the drug and drug with exercise groups reported symptoms, as compared to 30 percent of the exercise only group. Dr. James Blumenthal, one of the researchers for this study, told the Associated Press (Dreyfuss 2000), "The studies do not prove exercise relieves depression, in part because the exercisers worked out in a group, so group dynamics may have played a role." This is how science works. Even with a strong experimental design, it is still possible that other factors (rival explanations) might affect the results. More research is needed. 69
- 15. everyone receives pills and no one knows whether it is the real medication or a sugar pill. Sometimes the placebo will mimic some of the possible side effects, making it harder for people to guess accurately which pills they have received. If a substantially greater percent of the people in the treatment group get better as compared to the control group, the placebo effect has been eliminated as a rival explanation. While the classic experimental design is the strongest in ruling out other rival explanations, random assignment in public administration research may not be pos- sible due to ethicaL legal, equity, practical, or political constraints within a particular situation. Clinical trials to test the efficacy of various drugs, for example, might raise ethical issues. Is it ethical to assign some people into an experimental group that gets treatment that may increase life expectancy and assign others into a control group that gets a placebo? In this situation, rather than use a placebo researchers might either test various dosages of the potential life-saving drug or test similar medications. There may be legal constraints that prevent random assignment. It is not legal for an employer to force people to participate in an experiment, even one like the stress reduction program. It is also illegal to deny people public programs or benefits to which they are entitled by law, such as food stamps, training program for disabled
- 16. veterans, or unemployment benefits; this means that people cannot be forced to par- ticipate in a nutrition experiment, for example, under the threat of losing their food stamps. Equity may also be a constraint. Are the choices about who gets to participate fair, especially if participation provides a benefit? Sometimes random assignment is simply impractical. It is unlikely, for example, that 70 :::-:.:-::~ 5 Congress would randomly assign some states to a program and other-. to a .:omparison group that does not get the program. When laws are implemented in every county or every state at the same time, there is no way to form comparison groups. Random assignment might also pose a challenge to political deal making. For example, it is difficult to randomly assign cities to receive a program that will bring in millions of dollars from the federal government. Elected officials from other cities are likely to negotiate to have their cities included in the experiment. As a result, the cities are no longer randomly assigned (because political influence has gotten them included) and the pot of money might be divided up to the point where it is insuf- ficient to be effective in any city.
- 17. There may be situations, however, when an experimental design can be used. For example, when a program is not large enough to accommodate all those who apply, random assignment is possible (see Application 5.2 on pages 72-73 ). Since relatively few can participate. random assignment not only provides a strong design, it is also more equitable because it rules out bias and favoritism in selection. In the mid-1980s, for example, a public-private partnership funded a huge evaluation of welfare training programs (Gueron 1988). Eight states were selected, and over 35,000 people who volunteered to participate in the training program were randomly assigned to one of three groups: the full training program, a program with limited job search services, or the no-service control group. In states with a typical unemployment rate, the programs worked: those who participated in the full training program earned more than those who did not although the differences were generally small. This is a good example of how an experimental design can be used in the public sector. DESIGN VARIATIONS Every situation is different and therefore constrains the ability to use one or more of the design elements. In some situations, random assignment is possible but there is no way to get a preprogram measure. For example, suppose researchers are testing a training program for people on welfare. The researchers go through the welfare rolls
- 18. in their town and randomly assign clients to the training program or not. The outcome measure is whether they get jobs and keep them for six months. Since they are on welfare when the program begins, there is no premeasure. Some people may have had prior work experience, but random assignment equalizes the groups since people with and without prior work experience are in both groups. My point, however, is that there will be no premeasure in this experimental design. The notation using Xs and Os would look like this: Random assignment Random assignment Training program Comparison group X 0 0 Sometimes researchers stumble on a situation that is naturally a quasi-experimental design. For example, until Indiana's state legislature decided to put the entire state on daylight saving time in 2006, only fifteen of its ninety-two counties turned their clocks forward in the spring and back in the fall (Lahart 2008). This created a natural DESIGNS FOR RESEARCH 71
- 19. experiment by which the energy use in the counties could be compared. Using data from monthly meter readings for three years, researchers were able to compare energy use before and after daylight saving went into effect as well as compare the usage of residents living in counties that were using daylight saving before 2006 with those who were not. The result? The researchers concluded that daylight saving time does not save energy or money: residential energy usage increased between 1 percent and 4 percent, amounting to an additional $8.6 million a year that consumers paid. Another quasi-experimental variation is to find a group that is matched on key characteristics. Researchers might, for example. select two schools that share very similar demographic characteristics to compare a specific program offered in one school but not the other. The assumption is that if the demographics are the same, the schools are relatively comparable, so any observed difference is likely to be due to the program. USING STATISTICAL CONTROLS TO CREATE COMPARISON GROUPS Creating comparison groups by using statistical controls is another very common quasi-experimental design. In the jargon, this type of design is typically called cor- relational with statistical controls, but variations are called an ex post facto or causal
- 20. comparative design. Basically, they use analytical techniques utilizing computer software to make comparisons. Suppose researchers want to determine whether the Head Start program has a last- ing impact on the reading abilities of the children who participate in the program. Assuming the data is available in school records, the researchers design a study to gather information on all the eighth graders in an inner-city school district. This data includes whether or not they attended Head Start, various test scores, grades, and demographic information. Using statistical software. the researchers separate the students into two groups: those who attended Head Start and those who did not. The software then performs various statistics procedures to determine whether there is a noticeable difference in reading scores between the former Head Start and the non- Head Start students. Specifically how this is done will be presented in the analysis chapters. What else might affect a child's reading scores? Maybe the educational level of the mother, family income, or having attended nursery school makes a difference. If these data are included in the files, they can be used to test the possible rival explanations, and the researchers use statistical controls to examine reading scores associated with these factors. The computer software sets up comparison
- 21. groups. For example, the computer can look at reading scores for children who attended nursery school, Head Start, or those who did not attend any type of preschool. If Head Start makes a dif- ference, we would expect to see higher reading scores for that group as compared to those who did not attend any preschool groups. Ideally, the Head Start group would have scores at least as high as those who attended nursery schools. Using statistical controls is a strong quasi-experimental design to employ in the field. We often see statistical controls used in analyzing polling data. For example, a national exit poll conducted by NBC was used to analyze how young people voted in DESIGNS FOR RESEARCH it might be possible to track them. Unlike a controlled laboratory experiment, participation in Medicaid is not a constant. Some might remain on Medicaid for years, but others will cycle off as their earnings rise above the poverty level. Research in this area is very difficult. The second study, by Sommers et al. (2012), used a pre- and postcomparison quasi- experimental design with statistical controls. New York, Maine, and Arizona expanded Medic- aid eligibility in 2000. The researchers compared outcomes with those of neighboring states
- 22. that did not expand Medicaid. They looked at data five years before and after the expansion. Among other things, they wanted to determine whether Medicaid expansions were associated with changes in mortality. Medicaid expansions were associated with a significant reduction in adjusted all-cause mortality. Mortality reductions were greatest among older adults, non- whites, and residents of poorer counties. They concluded: "State Medicaid expansions to cover low-income adults were significantly associated with reduced mortality as well as improved coverage, access to care, and self-reported health." 73 the 2008 presidential election (Keeter et al. 2008). Defining young voters as eighteen to twenty-nine years old and old voters as aged thirty and over, the polltakers found that 66 percent of all young voters reported they had voted for Barack Obama. In contrast. 50 percent of the older voters reported voting for Obama. Statistical controls allow the researchers to make even finer slices. How did race affect the votes of the young and the not so young? Race is now the control variable. The NBC poll found that 54 percent of young white voters said they voted for Obama. In contrast 41 percent of older white voters said they voted for Obama. LONGITUDINAL STUDIES
- 23. Longitudinal studies are another type of quasi-experimental design that can be used to measure change after a program or event. These have more measurement points than a simple before-and-after design. There are two approaches for gathering the data for longitudinal studies. The cross-sectional approach takes a different "slice" of the population of interest at each point in time: the result is that different people are used each time the data is gathered. A good example of a cross- sectional longitudinal study is the National Institute of Drug Abuse's annual survey of high school seniors. A different random sample of high school seniors is selected every year. In 2011, 46,733 students from 400 public and private schools in the eighth, tenth, and twelfth grades participated in this year's survey. This longitudinal design allows researchers to track the self-reported use of marijuana and tobacco over time, creating a trend line (see Exhibit 5.1 ). The second approach is a panel design that gathers data from the same group of people over time. For example, the Department of Labor's Bureau of Labor Statistics conducts the National Longitudinal Survey of Youth (NLSY). It began in 1979 with a random sample of 11 ,406 people between fourteen and twenty-one years of age. Follow-up interviews were conducted annually with this same group of people through I 994. After that, biennial interviews were conducted. In addition to a standard set of
- 24. DESIGNS FOR RESEARCH 75 Predictions are also possible based on trend lines, but there are some limitations in driving forward by looking through the rearview window. Changes in the larger environment can dramatically alter the accuracy of any forecast. A big controversy emerged in 2012 when the number of people receiving food stamps spiked. Look- ing at past trends proved to be an inaccurate predictor of future demand because of increased unemployment and changes to eligibility rules. An intelTupted time series design is a good option for program evaluation when there are multiple data points before and after a specific event or a program or policy is implemented. Researchers would be looking for a change in the trend line after a program was implemented. In the notation. it looks like this: X For example, when citizens of Washington state voted in 2011 to privatize liquor sales. some believed there would be an increase in alcohol- related fatalities. Research- ers could use an inten·upted time-series design to track alcohol- related fatalities be- fore and after the law changed. However. this design does not rule out other factors. Sometimes it is possible to use an intelTupted times series
- 25. design with a comparison group. This is called a multiple time series analysis. This is a useful design when a program is implemented in one place and not another. For example, this design could be used to look at the fatality rates before and after some states rescinded the laws requiring that motorcyclists use helmets compared to the states that did not. The notation would look like this: o, 0 2 o, o+ o, o(J o7 o.~ o~ 0 10 0 1 0 2 0, 0+ O, 0 6 07 Ox 0 9 0 1, 1 X 0 11 0 12 0 11 0 1 ~ 0 15 0 16 o,, 0,2 0!1 o,~ 0" o,n Whether to use a longitudinal design (covering just a few years) or a time-series analysis (covering many years) will depend on the situation. Clearly, if researchers need quick results, they will not choose a time series analysis unless the data are already available. The key point with any data collected over time is whether the data are measured in exact] y the same way every time. Any change creates apples- to-oranges comparisons; more technically. the data are no longer reliable. While these are strong designs. it is important to keep in mind that they are limited in answering a cause-and-effect or impact question unless they are able to rule out those pesky rival explanations. Trend lines, in particular. are
- 26. not useful in explaining why things change. We know, for example, that obesity among children in America has increased over time. So far. however, researchers have been unable to come to agreement about the causal factors. INTERNAL VALIDITY Researchers talk about internal validity when operating within the Xs and Os frame- work. Internal validity is the shorthand reminder for considering whether other fac- If&; .. ···.·. R--~- ~- 76 CHAPE; : tors may have influenced the results. Social scientists have identified some comrr - threats to internal validity, including history, maturation, testing, instrumentati,:- regression to the mean, selection, and attrition. . History is a potential threat if a particular event took place while the study ::_ being conducted that might impact the results. For example, the departure of t:-: stress-provoking manager after the stress reduction program started is an example · · a history effect. Using a comparison group reduces this threat. If it is not possible : have a comparison group, it is important to find out what was
- 27. happening at that tir·: that may have affected the results. Maturation is a potential threat when it is possible for skills or abilities to incre:: c: because the participants got older. For example, improved study skills among ch: - dren might be a result of maturation rather than their participation in a study ski: program. Perhaps the ability to concentrate improves as children get older. Usins _ comparison group reduces this threat. Testing can be a potential threat in research when a test is used to measure char.;~ before and after a program. Why? It is possible that people might have learned h,: .. to take the test. Using a comparison group reduces this threat because both grou::- · would have learned how to take the test. If the program made a difference, participar: · in the program should still have higher scores. Instrumentation refers to any changes in what gets counted or how it gets countc.: This is a threat in any design that uses before-and-after measures, because any chan;: creates an apples-to-oranges comparison. For example, a school implements a zer - tolerance" for-weapons program that includes posting "no weapon" signs, education.:. events, and conflict resolution training for all students. The school uses the number : · children who brought a weapon to school before the program began as the baseli:-~ (pre-measure). The program runs for three years and then
- 28. measures the number ·:- children who brought a weapon to school during the last year of the program. If t~ ~ school changed the definition of weapon during those three years to include me:-~ items, such as Swiss army knives and metal nail files, the results would not be a go· ~ measure of whether the program worked. The threat would be reduced if there c: a similar comparison school that did not have the program but confiscated weapo:- · during that same time period and made the same definitional changes about what.::_· considered a weapon. "Regression to the mean" is a threat only if a program or policy is implemente .= because of an unusually high or low measurement. Regression to the mean is ba-.e = on the idea that things vary over time and tend to balance out. It is kind of a stati,' - cal version of ''what goes up must come down." For example, when a crackdown ,: - speeders is implemented because of an unusually high number of highway fataliue · one year, it is possible the number of highway fatalities would have gone down tr: next year without the program. One way to avoid this threat is not to intervene solely on the basis of a sing;~ extreme high or low score. However, sometimes there is public or political pressu:-: to do something about a perceived crisis, so public administrators implement apr - gram or regulation. To minimize the regression to the mean
- 29. threat, researchers wou1 ~ want to look at data over a longer period of time and/or use comparison data fro-, ; 5 n. -_e f : l DESIGNS FOR RESEARCH 77 neighboring jurisdictions to get a clearer picture of the impact of the crackdown in the context of the natural variation in traffic fatalities. Selection of sites or people can be a threat. The criteria for any selection have to be made clear along with potential impacts on the results. For example, if different sites are selected. are there some differences between them that affect the results? Are the volunteers in the stress reduction program different from other employees in some particular way that affects the results? Similarly, when only a small proportion of people asked to participate in a survey actually do. are they different from those who do not? That leads to the next question: do those differences affect the results?
- 30. Selection is also a possible threat when a program manager chooses some people to participate in the program but not others. What are the criteria for selection? Are those participants different from a typical client? More skeptically, did the program officials select the people most likely to succeed in order to make the program look successful? In fairness to program managers, however. this is a tough situation. From a manage- ment perspective, selecting people who are most likely to benefit from the program may be viewed as the best use of taxpayers· dollars. However, from a research perspective, selecting the best-the cream of the crop-will not give a good measure of program impact. because the best people might have done just as well without the program. For example, selecting welfare recipients with at least a high school education and some work experience to participate in a training program makes it hard to tell whether the training program actually made a difference. It is possible that a high percentage of these recipients would have gotten jobs without the training program. Attrition is a potential threat in any design that tracks the same people over time. It is possible that the people who dropped out of the study were different in some important way. For instance, researchers want to detem1ine the efficacy of a drug treatment program, so they track the participants over time. The
- 31. researchers state that 75 percent of the participants who answered a survey a year after completing the program were drug-free. Success? Maybe. If a hundred people started the program and only fifty completed it, attrition is a threat to validity. What happened to the fifty who did not complete the program? A 75 percent program success rate looks like the program had a positive impact. but it is based on only half the initial group; the program might not be as successful as it initially appears. WHY VALIDITY MATTERS On March 16. 1964. President Lyndon B. Johnson delivered a speech announcing his proposal for a nationwide war on poverty (Grier and Jonsson 2004 ). He told Congress and the nation: ''Because it is right, because it is wise, and because, for the first time in our history, it is possible to conquer poverty, I submit, for the consideration of the Congress and the country, the Economic Opportunity Act of 1964." The antipoverty program includes a wide range of programs, including Head Start, VISTA, food stamps, Job Corps, legal aid. and community action agencies. Exhibit 5.2 shows the poverty data for the United States. The trend data over time (think time series) shows a continued drop in the percentage of people below the
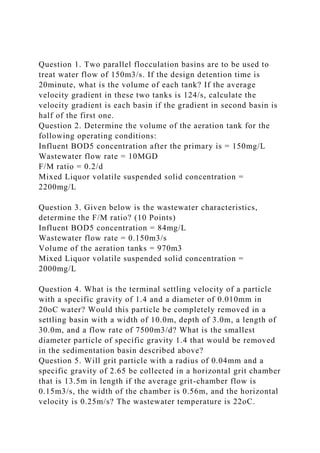
- 32. 78 CHAPTER 5 Exhibit 5.2 Percentage of People Living in Poverty, United States, 1979-2011 30% Qj :§ 25% f 0 ~20% 0 Qi ..c c 015% ~ "5 0. 0 0.10% 0 ~ IV .s::: VI 5% 0% All
- 33. 1983: 22.3% 15.2% 1993: 22.7% 15.1% 15.0% 1979 1981 1983 1985 1987 1989 1991 1993 1995 1997 1999 2001 2003 2005 2007 2009 2011 Source: Shierholz and Gould 2012. Reptinted with permission from Economic Policy Institute. Note: Shaded areas denote recessions. poverty line after 1960. In I964, the poverty rate was 19 percent and dropped to II percent by I973. Looking at Exhibit 5.2, we see the trends from 1979 to 2011. In 2011, 15 percent of Americans lived below the poverty line, and almost 22 percent of those under age IS were living below the poverty line. Do these figures mean that President Johnson's poverty program failed? Maybe yes, maybe no. The libertarian Cato Institute and the conservative Heritage Foundation agree: it is a failure. According to the Cato Institute, the government has spent trillions of dollars yet poverty remains "perilously close" to what it was in 1964 and the availability of welfare has made things worse by trapping people into a state of
- 34. dependency (Tanner 2006 ). The Heritage Foundation challenges the statistics, saying poverty is overstated and government rewards dependency (Rector and Johnson 2004). The Center for Budget and Policy Priorities makes the case that the safety net created by various poverty programs over the past 50 years "kept 41 million people, including 9 million children, out of poverty in 20 12'' (Sherman et al 20 12). The percentage of people living in poverty is less than it was in I960 and severe hunger is rare in America today because of the food stamp program and other nutrition pro- grams such as the Special Supplemental Nutrition Program for Women, Infants and ~~c- r ! 80 ~ :;- -~ Exhibit 5.3 Common Research Designs Using the Xs and Os Framework Experimental
- 35. Always uses random assignment to treatment and control groups. The classic experimental designs also collect data before and after treatment. However, variations may not collect before measures. It is the strongest design for controlling threats to internal validity but weak in external validity. While hard to do in the public sector, it is not impossible. Quasi-experimental No random assignment. Selection is a potential threat. May be reasonably strong to answer impact and cause-and-effect questions; generally strong in controlling for history and regression to the mean. May be weak on external validity. Nonequivalent groups: Comparison of group with program to group without the program. Controls for history and maturation if comparison group is a close match; selection and attrition may be threats. Natural experiments: Situations in which there are naturally occurring comparison groups and before-and-after measures. Matched groups: Matches program and comparison groups on key variables to control for selection threat. Correlational design with statistical controls (sometimes called causal-comparative or Ex post fact): Collects data from all or a sample of people, cases, units, etc., and uses statistical techniques to create comparison groups in order to compare outcomes and control for rival explanations. Longitudinal
- 36. Data collected over time:The key is that the measures are defined and data collected the same way; attrition, testing, and instrumentation are possible threats. Cross-sectional: Collects the same data at a few points in time from different people. Panel: Collects same data from the same people at various points in time. Time series: Collects the same data at many points in time. Useful for describing trends but does not explain why things change. Interrupted time series: Data before and after the program from different people or the same people. May face selection and instrumentation threats. Multiple time series: Comparison of data over time. Nonexperimental While useful in answering descriptive and normative questions, it is weak for answering impact or cause-and-effect questions. Before and after: Collects data on key measures before and after program; controls for history and maturation if comparison group is a close match; selection, regression to the mean, and attrition may be threats. • Static group comparison: Collects key day after the program and compares with control group. Selection, history, and regression to the mean may be threats. One-shot: Provides a snapshot after a program or policy is implemented or a picture of one point in time. There are no before measures and no comparison. History and selection may be threats.
- 37. DESIGNS FOR RESEARCH 81 have long known about the limits of "cookie cutter" or one-size- fits-all approaches. Communities are different, and what works in one might not work in another. So- phisticated users of research results who are concerned about external validity will ask some questions: "Does what happens in this study reflect what occurs in other places where the program is also being conducted?" "How similar or dissimilar are those communities to ours?" and "Do their success factors exist here?" As good as the Oregon Health Insurance Experiment is, it has limited external validity. What happens in Portland might not be particularly representative of the rest of Oregon and perhaps even less representative of the rest of the nation. But any study is limited by its scope and boundaries. When critiquing study results, it is reasonable to expect the researchers to identify potential threats. When possible, they should take steps to mitigate these threats. If things are beyond their ability to control, it is reasonable to expect the researchers to identify possible limitations and provide cautions about drawing conclusion from the results. CONCLUSION
- 38. The situation and type of research question determine which design elements are used. No design is perfect nor can a single design be applied to every research question because every situation is unique. Exhibit 5.3 summarizes the common research designs in the Xs and Os framework. If the researcher is asking a descriptive question or a normative question, then a nonexperimental design is sufficient. However, to demonstrate that a program hac! an impact or that a cause-and-effect relationship exists, the design has to be rigorous enough so that other possible explanations are ruled out. The strongest design for cause-and-effect questions is an experimental design. Random assignment is its unique feature, and this controls for all kinds of factors that might affect the observed results. However, quasi- experimental designs are more commonly used in public administration research because it is often not possible to randomly assign people to programs or policies. Researchers face challenges in conducting research in the public sector (see Application 5.3 ). One takeaway lesson for sophisticated consumers of research results is to look beneath the surface whenever anyone claims to have found a program impact or a program failure. If it is difficult to discern a strong research design in terms of the Xs and Os framework, then caution is warranted in accepting claims of causality as
- 39. truth. Three tough questions to ask are: 1. Is there something else other than the program that could explain these results? 2. Has something been left out of the study that might alter the results or reflect a bias? 3. Is the research design strong enough to support the conclusions? The final takeaway lesson is to remember that given all the challenges in designing strong impact studies and eliminating all the threats to internal and external validity, we often know a lot less than we think we know about cause- and-effect relationships and program impacts.