SlideShare a Scribd company logo
1 of 49
QUANTITATIVE
INVESTMENT
ANALYSIS
Second Edition
Richard A. DeFusco, CFA
Dennis W. McLeavey, CFA
Jerald E. Pinto, CFA
David E. Runkle, CFA
John Wiley & Sons, Inc.
QUANTITATIVE
INVESTMENT
ANALYSIS
Second Edition
Richard A. DeFusco, CFA
Dennis W. McLeavey, CFA
Jerald E. Pinto, CFA
David E. Runkle, CFA
John Wiley & Sons, Inc.
Copyright c⃝ 2004, 2007 by CFA Institute. All rights reserved.
Published by John Wiley & Sons, Inc., Hoboken, New Jersey.
Published simultaneously in Canada.
No part of this publication may be reproduced, stored in a
retrieval system, or transmitted in any form or by any
means, electronic, mechanical, photocopying, recording,
scanning, or otherwise, except as permitted under Section
107 or 108 of the 1976 United States Copyright Act, without
either the prior written permission of the Publisher, or
authorization through payment of the appropriate per-copy fee
to the Copyright Clearance Center, Inc., 222
Rosewood Drive, Danvers, MA 01923, (978) 750-8400, fax
(978) 646-8600, or on the Web at www.copyright.com.
Requests to the Publisher for permission should be addressed to
the Permissions Department, John Wiley & Sons,
Inc., 111 River Street, Hoboken, NJ 07030, (201) 748-6011, fax
(201) 748-6008, or online at
http://www.wiley.com/go/permissions.
Limit of Liability/Disclaimer of Warranty: While the publisher
and author have used their best efforts in preparing
this book, they make no representations or warranties with
respect to the accuracy or completeness of the contents of
this book and specifically disclaim any implied warranties of
merchantability or fitness for a particular purpose. No
warranty may be created or extended by sales representatives or
written sales materials. The advice and strategies
contained herein may not be suitable for your situation. You
should consult with a professional where appropriate.
Neither the publisher nor author shall be liable for any loss of
profit or any other commercial damages, including but
not limited to special, incidental, consequential, or other
damages.
For general information on our other products and services or
for technical support, please contact our Customer
Care Department within the United States at (800) 762-2974,
outside the United States at (317) 572-3993 or fax
(317) 572-4002.
Wiley also publishes its books in a variety of electronic
formats. Some content that appears in print may not be
available in electronic formats. For more information about
Wiley products, visit our Web site at www.wiley.com.
Library of Congress Cataloging-in-Publication Data:
Quantitative investment analysis / Richard A. DeFusco . . . [et
al.]. —
2nd ed.
p. cm. — (The CFA Institute investment series)
Includes bibliographical references.
ISBN-13 978-0-470-05220-4 (cloth)
ISBN-10 0-470-05220-1 (cloth)
1. Investment analysis — Mathematical models. I. DeFusco,
Richard
Armand.
HG4529.Q35 2006
332.601’5195 — dc22
2006052578
Printed in the United States of America.
10 9 8 7 6 5 4 3 2 1
To Margo, Rachel, and Rebekah
R.A.D.
To Jan, Christine, and Andy
D.W.M.
In memory of Irwin T. Vanderhoof, CFA
J.E.P.
To Patricia, Anne, and Sarah
D.E.R.
CONTENTS
Foreword xiii
Acknowledgments xvii
Introduction xix
CHAPTER 1
The Time Value of Money 1
1 Introduction 1
2 Interest Rates: Interpretation 1
3 The Future Value of a Single Cash Flow 3
3.1 The Frequency of Compounding 8
3.2 Continuous Compounding 10
3.3 Stated and Effective Rates 12
4 The Future Value of a Series of Cash Flows 13
4.1 Equal Cash Flows — Ordinary Annuity 13
4.2 Unequal Cash Flows 15
5 The Present Value of a Single Cash Flow 15
5.1 Finding the Present Value of a Single Cash Flow 15
5.2 The Frequency of Compounding 17
6 The Present Value of a Series of Cash Flows 19
6.1 The Present Value of a Series of Equal Cash Flows 19
6.2 The Present Value of an Infinite Series of Equal Cash Flows
— Perpetuity 23
6.3 Present Values Indexed at Times Other Than t = 0 24
6.4 The Present Value of a Series of Unequal Cash Flows 26
7 Solving for Rates, Number of Periods, or Size of Annuity
Payments 27
7.1 Solving for Interest Rates and Growth Rates 27
7.2 Solving for the Number of Periods 30
7.3 Solving for the Size of Annuity Payments 30
7.4 Review of Present and Future Value Equivalence 35
7.5 The Cash Flow Additivity Principle 36
vii
viii Contents
CHAPTER 2
Discounted Cash Flow Applications 39
1 Introduction 39
2 Net Present Value and Internal Rate of Return 39
2.1 Net Present Value and the Net Present Value Rule 40
2.2 The Internal Rate of Return and the Internal Rate of
Return Rule 42
2.3 Problems with the IRR Rule 45
3 Portfolio Return Measurement 47
3.1 Money-Weighted Rate of Return 47
3.2 Time-Weighted Rate of Return 49
4 Money Market Yields 54
CHAPTER 3
Statistical Concepts and Market Returns 61
1 Introduction 61
2 Some Fundamental Concepts 61
2.1 The Nature of Statistics 62
2.2 Populations and Samples 62
2.3 Measurement Scales 63
3 Summarizing Data Using Frequency Distributions 65
4 The Graphic Presentation of Data 72
4.1 The Histogram 73
4.2 The Frequency Polygon and the Cumulative Frequency
Distribution 74
5 Measures of Central Tendency 76
5.1 The Arithmetic Mean 77
5.2 The Median 81
5.3 The Mode 84
5.4 Other Concepts of Mean 85
6 Other Measures of Location: Quantiles 94
6.1 Quartiles, Quintiles, Deciles, and Percentiles 94
6.2 Quantiles in Investment Practice 98
7 Measures of Dispersion 100
7.1 The Range 100
7.2 The Mean Absolute Deviation 101
7.3 Population Variance and Population Standard
Deviation 103
7.4 Sample Variance and Sample Standard Deviation 106
7.5 Semivariance, Semideviation, and Related Concepts 110
7.6 Chebyshev’s Inequality 111
7.7 Coefficient of Variation 113
7.8 The Sharpe Ratio 115
8 Symmetry and Skewness in Return Distributions 118
9 Kurtosis in Return Distributions 123
10 Using Geometric and Arithmetic Means 127
Contents ix
CHAPTER 4
Probability Concepts 129
1 Introduction 129
2 Probability, Expected Value, and Variance 129
3 Portfolio Expected Return and Variance of Return 152
4 Topics in Probability 161
4.1 Bayes’ Formula 161
4.2 Principles of Counting 166
CHAPTER 5
Common Probability Distributions 171
1 Introduction 171
2 Discrete Random Variables 171
2.1 The Discrete Uniform Distribution 173
2.2 The Binomial Distribution 175
3 Continuous Random Variables 185
3.1 Continuous Uniform Distribution 186
3.2 The Normal Distribution 189
3.3 Applications of the Normal Distribution 197
3.4 The Lognormal Distribution 200
4 Monte Carlo Simulation 206
CHAPTER 6
Sampling and Estimation 215
1 Introduction 215
2 Sampling 215
2.1 Simple Random Sampling 216
2.2 Stratified Random Sampling 217
2.3 Time-Series and Cross-Sectional Data 219
3 Distribution of the Sample Mean 221
3.1 The Central Limit Theorem 222
4 Point and Interval Estimates of the Population Mean 225
4.1 Point Estimators 225
4.2 Confidence Intervals for the Population Mean 227
4.3 Selection of Sample Size 233
5 More on Sampling 235
5.1 Data-Mining Bias 236
5.2 Sample Selection Bias 238
5.3 Look-Ahead Bias 240
5.4 Time-Period Bias 240
CHAPTER 7
Hypothesis Testing 243
1 Introduction 243
2 Hypothesis Testing 244
x Contents
3 Hypothesis Tests Concerning the Mean 253
3.1 Tests Concerning a Single Mean 254
3.2 Tests Concerning Differences between Means 261
3.3 Tests Concerning Mean Differences 265
4 Hypothesis Tests Concerning Variance 269
4.1 Tests Concerning a Single Variance 269
4.2 Tests Concerning the Equality (Inequality) of Two
Variances 271
5 Other Issues: Nonparametric Inference 275
5.1 Tests Concerning Correlation: The Spearman Rank
Correlation Coefficient 276
5.2 Nonparametric Inference: Summary 279
CHAPTER 8
Correlation and Regression 281
1 Introduction 281
2 Correlation Analysis 281
2.1 Scatter Plots 281
2.2 Correlation Analysis 282
2.3 Calculating and Interpreting the Correlation Coefficient 283
2.4 Limitations of Correlation Analysis 287
2.5 Uses of Correlation Analysis 289
2.6 Testing the Significance of the Correlation Coefficient 297
3 Linear Regression 300
3.1 Linear Regression with One Independent Variable 300
3.2 Assumptions of the Linear Regression Model 303
3.3 The Standard Error of Estimate 306
3.4 The Coefficient of Determination 309
3.5 Hypothesis Testing 310
3.6 Analysis of Variance in a Regression with One Independent
Variable 318
3.7 Prediction Intervals 321
3.8 Limitations of Regression Analysis 324
CHAPTER 9
Multiple Regression and Issues in Regression Analysis 325
1 Introduction 325
2 Multiple Linear Regression 325
2.1 Assumptions of the Multiple Linear Regression Model 331
2.2 Predicting the Dependent Variable in a Multiple Regression
Model 336
2.3 Testing Whether All Population Regression Coefficients
Equal Zero 338
2.4 Adjusted R2 340
3 Using Dummy Variables in Regressions 341
4 Violations of Regression Assumptions 345
4.1 Heteroskedasticity 345
4.2 Serial Correlation 351
4.3 Multicollinearity 356
Contents xi
4.4 Heteroskedasticity, Serial Correlation, Multicollinearity:
Summarizing the Issues 359
5 Model Specification and Errors in Specification 359
5.1 Principles of Model Specification 359
5.2 Misspecified Functional Form 360
5.3 Time-Series Misspecification (Independent Variables
Correlated
with Errors) 368
5.4 Other Types of Time-Series Misspecification 372
6 Models with Qualitative Dependent Variables 372
CHAPTER 10
Time-Series Analysis 375
1 Introduction 375
2 Challenges of Working with Time Series 375
3 Trend Models 377
3.1 Linear Trend Models 377
3.2 Log-Linear Trend Models 380
3.3 Trend Models and Testing for Correlated Errors 385
4 Autoregressive (AR) Time-Series Models 386
4.1 Covariance-Stationary Series 386
4.2 Detecting Serially Correlated Errors in an Autoregressive
Model 387
4.3 Mean Reversion 391
4.4 Multiperiod Forecasts and the Chain Rule of Forecasting
391
4.5 Comparing Forecast Model Performance 394
4.6 Instability of Regression Coefficients 397
5 Random Walks and Unit Roots 399
5.1 Random Walks 400
5.2 The Unit Root Test of Nonstationarity 403
6 Moving-Average Time-Series Models 407
6.1 Smoothing Past Values with an n-Period Moving Average
407
6.2 Moving-Average Time-Series Models for Forecasting 409
7 Seasonality in Time-Series Models 412
8 Autoregressive Moving-Average Models 416
9 Autoregressive Conditional Heteroskedasticity Models 417
10 Regressions with More than One Time Series 420
11 Other Issues in Time Series 424
12 Suggested Steps in Time-Series Forecasting 425
CHAPTER 11
Portfolio Concepts 429
1 Introduction 429
2 Mean – Variance Analysis 429
2.1 The Minimum-Variance Frontier and Related Concepts 430
2.2 Extension to the Three-Asset Case 439
2.3 Determining the Minimum-Variance Frontier for Many
Assets 442
2.4 Diversification and Portfolio Size 445
xii Contents
2.5 Portfolio Choice with a Risk-Free Asset 449
2.6 The Capital Asset Pricing Model 458
2.7 Mean – Variance Portfolio Choice Rules: An Introduction
460
3 Practical Issues in Mean – Variance Analysis 464
3.1 Estimating Inputs for Mean – Variance Optimization 464
3.2 Instability in the Minimum-Variance Frontier 470
4 Multifactor Models 473
4.1 Factors and Types of Multifactor Models 474
4.2 The Structure of Macroeconomic Factor Models 475
4.3 Arbitrage Pricing Theory and the Factor Model 478
4.4 The Structure of Fundamental Factor Models 484
4.5 Multifactor Models in Current Practice 485
4.6 Applications 493
4.7 Concluding Remarks 509
Appendices 511
References 521
Glossary 527
About the CFA Program 541
About the Authors 543
Index 545
FOREWORD
HOW QUANTITATIVE INVESTMENT ANALYSIS
CAN IMPROVE PORTFOLIO DECISION MAKING
I am a Quant. By my own self-admission, I use quantitative
investment techniques in the
management of investment portfolios. However, when I tell
people that I am a Quant, they
often respond: ‘‘But Mark, aren’t you a lawyer?’’ Well, yes, but
. . .
The fact is that Quants come from all walks of life. Whether we
are called Quants,
Quant Jocks, Gear Heads, Computer Monkeys, or any of the
other monikers that are attached
to investors who like to scribble equations on a piece of paper,
we all share a common
denominator — the use of quantitative analysis to make better
investment decisions. You don’t
have to be a rocket scientist with a Ph.D. in an esoteric
mathematical field to be a Quant
(although there are, I suspect, several former rocket scientists
who have found working in the
financial markets to be both fun and profitable). Anyone can
become a Quant — even a lawyer.
But let’s take a step back. Why should any investor want to use
quantitative tools in the
management of investment portfolios? There are three reasons
why Quants are so popular.
First, the financial markets are very complicated places. There
are many interwoven
variables that can affect the price of securities in an investment
portfolio. For example, the
stock price of a public company can be affected by
macroeconomic factors such as the level
of interest rates, current account deficits, government spending,
and economic cycles. These
factors may affect the cost of capital at which a corporation
finances its new projects, or
influence the spending patterns of the company’s customers, or
provide economic impetus
through government spending programs.
In addition to macro variables, the value of a company’s stock
can be affected by factors
that are peculiar to the company itself. Factors such as cash
flow, working capital, book-
to-market value, earnings growth rates, dividend policy, and
debt-to-equity ratios affect the
individual value of each public company. These are considered
to be the fundamental factors
that have an impact on the specific company as opposed to the
broader stock market.
Then we come to the financial market variables that affect a
company’s valuation. Its
‘‘beta’’ or measure of systematic risk will impact the expected
return for the company and, in
turn, its stock price. The famous Capital Asset Pricing Model
that measures a stock’s beta is
really just a linear regression equation of the type described in
Chapter 8.
Last, there are behavioral variables that can affect security
values. Such behavior as
herding, overconfidence, overreaction to earnings
announcements, and momentum trading
can all impact the price of a company’s stock. These behavioral
variables can have a lasting
impact on a stock price (remember the technology bubble of
1998 – 2001 when tech stocks
were going to take over the world?) as well as generate a
significant amount of ‘‘noise’’ around
a security’s true value.
xiii
xiv Foreword
Considering all of these variables together at one time to
determine the true value of
a security can be an overwhelming task without some
framework in which to analyze their
impact. It is simply not possible for the human mind alone (at
least, not mine) to be able
to weigh the impact of individual company specific factors such
as price-to-earnings ratios,
macroeconomic variables such as government spending
programs, investor behavioral patterns
such as momentum trading, and other potentially influential
variables in a rigorous fashion
within the human brain.
This is where Quantitative Investment Analysis can help. Factor
modeling techniques such
as those described in Chapter 11 can be used to supplement the
intuition of the human mind
to produce a quantitative framework that digests the large
number of plausible variables that
can impact the price of a security. Further, given the many
variables that can affect a security’s
value, it is not possible to consider each variable in isolation.
The economic factors that cause
a security’s price to go up or down are interwoven in a complex
web such that the variables
must be considered together to determine their collective impact
on the price of a security.
This is where the value of Chapters 8 and 9 are most useful.
These two chapters provide
the basic knowledge for building regression equations to study
the impact of economic factors
on security prices. The regression techniques provided in
Chapters 8 and 9 can be used to filter
out which variables have a significant impact on the price of a
security, and which variables
just provide ‘‘noise.’’
In addition, Chapter 9 introduces the reader to ‘‘dummy
variables.’’ Despite their name,
you don’t have to be a dummy like me to use them. Dummy
variables are a neat way to study
different states of the world and their impact on security prices.
They are often referred to as
‘‘binary’’ variables because they divide the world into two
states for observation, for example,
financial markets up versus financial markets down;
Republicans in control of the White
House versus Democrats in control of the White House; Chicago
Cubs win (almost never)
versus Chicago Cubs lose; and so on. This last variable — the
record of the Chicago Cubs — I
can attest has no impact on security valuations, although, as a
long-standing and suffering
Cub fan, it does have an impact on my morale.
As another example, consider a recent research paper where I
studied the behavior of
private equity managers in the way they price their private
equity portfolios depending on
whether the public stock markets were doing well versus when
the public stock markets were
doing poorly. To conduct this analysis, I ran a regression
equation using dummy variables to
divide the world into two states: up public stock markets versus
down public stock markets.
By using dummy variables in this manner, I was able to observe
different behavioral patterns
of private equity managers in how they marked up or down their
private equity portfolios
depending on the performance of the public stock markets.
The second reason Quantitative Investment Analysis will add
value to the reader is that it
provides the basic tools to consider a breadth of economic
factors and securities. It is not only
the fact that there are many interwoven economic variables that
impact the value of a security,
the sheer number of securities in the market place can be
daunting. Therefore, most investors
only look at a subset of the investable securities in the market.
Consider the U.S. stock market. Generally, this market is
divided into three categories
based on company size: large-cap, mid-cap, and small-cap
stocks. This division is less so because
there might be ‘‘size’’ effects in valuation, but rather, because
of the pragmatic limitation
that asset managers simply cannot analyze stocks beyond a
certain number. So traditional
fundamental investors select different parts of the U.S. stock
market in which to conduct their
security analysis. However, the division of the stock market into
size categories effectively
establishes barriers for investment managers. There is no
reason, for example, why a portfolio
Foreword xv
manager with insight into how earnings surprises affect stock
prices cannot invest across the
whole range of stock market capitalization.
This is where Chapters 6 and 7 can be useful. The quantitative
skills of sampling,
estimation, and hypothesis testing can be used to analyze large
baskets of data. This allows
portfolio managers to invest across a broad universe of stocks,
breaking down traditional
barriers such as cap-size restrictions. When viewed in this light,
quantitative analysis does not
displace the fundamental stock picking skills of traditional asset
managers. Rather, quantitative
analysis extends the portfolio manager’s insight with respect to
company, macro, and market
variables to a broader array of investment opportunities.
This also has implications for the statistical tools and
probability concepts provided in
Chapters 3 and 4. The larger the data set to be analyzed the
greater the reliability of the
parameter estimation derived from that data set. Breadth of
economic analysis will improve not
only the statistical reliability of the quantitative analysis, but
will also increase the predictability
of the relationships between economic factors and stock price
movement. The statistical tools
provided in this book allow the portfolio manager to realize the
full potential of his or her skill
across a larger universe of securities than may have previously
been achieved.
Another example might help. Every year the California Public
Employees’ Retirement
System (CalPERS), my former employer, publishes a list of the
most poorly governed
companies in the United States. This list has now been
published for 16 years and has been
very successful. Early on in the process, the selection was
conducted on a subset of the U.S.
stock market. However, this process has evolved to consider
every U.S. stock held in CalPERS’s
portfolio regardless of stock market capitalization range. This
requires the analysis of up to
1,800 stocks every year based on both economic factors and
governance variables. The sheer
number of securities in this data sample could not be analyzed
without the application of
quantitative screening tools to expand the governance universe
for CalPERS.
Last, Quantitative Investment Analysis can provide a certain
amount of discipline to the
investment process. We are all human, and as humans, we are
subject to making mistakes. If I
were to recount all of the investment mistakes that I have made
over my career, this Foreword
would exceed the length of the chapters in this book. Just as a
brief example, one of my ‘‘better
calls’’ was Starbucks Coffee. Early on when Starbucks was just
getting started, I visited one
of their shops to see what the buzz was all about. At that time a
Latte Grande was selling for
about $1.50. I recall that I thought this was an outrageous price
and I can remember distinctly
saying: ‘‘Oh, this is a dumb idea, this will never catch on!’’ Ah
yes . . .
So back to quantitative techniques — how can they help? In this
instance, they could have
helped me remove my human biases and to think more
analytically about Starbucks’ prospects.
If I had taken the time to conduct an empirical review using the
quantitative tools provided
in this text, I would have seen the fundamental value underlying
that buck-fifty Latte.
The fact is that we are all subject to behavioral biases such as
overconfidence, momentum,
and overreaction. Not only can these be analyzed as discussed
above, they can be revealed
and discounted when we make our investment decisions.
Perhaps the single biggest behavioral
hurdle to overcome for investors is the inability to sell a
security when its value declines. All
too often we become almost emotionally attached to the
securities in our portfolio such that
we find it hard to sell a security that begins to decline in price.
Yet, this is precisely, where Quantitative Investment Analysis
can help because it is
dispassionate. Quantitative tools and modeling techniques can
take the emotion and cognitive
biases out of the portfolio decision-making process. As
portfolio managers, our goal is to
be objective, critical, and demanding. Unfortunately, sometimes
our embedded habits and
opinions can get in the way. However, quantitative models are
unemotional and they can root
xvi Foreword
out our cognitive biases in a way that we simply cannot do
ourselves by looking in the mirror
(in fact, when I look in the mirror I see someone who is six feet
and four inches tall and
incredibly good looking but then my wife Mary reminds me that
I am only six feet and one
inch tall and she had better offers).
All in all, the investor will appreciate the methods, models, and
techniques provided in
this text. This book serves as an excellent introduction to those
investors who are just beginning
to use quantitative tools in their portfolio management process
as well as an excellent reference
guide for those already converted. Quantitative investing is not
difficult to grasp — even a
lawyer can do it.
Mark J. P. Anson
CEO, Hermes Pensions Management
CEO, British Telecomm Pension Scheme
[email protected]
ACKNOWLEDGMENTS
W e would like to thank the many individuals who played
important roles in producingthis book.
Robert R. Johnson, CFA, Managing Director of the CFA and
CIPM Programs Division,
saw the need for specialized curriculum materials and initiated
this project. We appreciate his
support for the timely revision of this textbook. Senior
executives in the CFA Program Division
have generously given their advice and time in the writing of
both editions of this book.
Philip J. Young, CFA, provided continuous assistance in writing
the book’s learning outcome
statements and participated in final manuscript reviews. Jan R.
Squires, CFA, contributed an
orientation stressing motivation and testability. Mary K.
Erickson, CFA, made contributions
to the accuracy of the text. John D. Stowe, CFA, supplied
suggestions for revising several
chapters.
The Executive Advisory Board of the Candidate Curriculum
Committee provided
invaluable input: James Bronson, CFA, Chair; Peter Mackey,
CFA, Immediate Past Chair;
and members, Alan Meder, CFA, Victoria Rati, CFA, and Matt
Scanlan, CFA, as well as the
Candidate Curriculum Committee Working Body.
The manuscript reviewers for this edition were Philip Fanara,
Jr., CFA; Jane Farris,
CFA; David M. Jessop; Lisa M. Joublanc, CFA; Asjeet S.
Lamba, CFA; Mario Lavallee, CFA;
William L. Randolph, CFA; Eric N. Remole; Vijay Singal, CFA;
Zoe L. Van Schyndel, CFA;
Charlotte Weems, CFA; and Lavone F. Whitmer, CFA. We
thank them for their excellent
work.
We also appreciate the many comments received from those who
used the first edition.
Jacques R. Gagne, CFA, Gregory M. Noronha, CFA, and Sanjiv
Sabherwal provided
highly detailed proofreading of the individual chapters. We
thank each for their dedicated
and painstaking work. We are also indebted to Dr. Sabherwal
for his expert assistance in
running regressions, revising in-chapter examples, and creating
some of the end-of-chapter
problems/solutions.
Fiona D. Russell provided incisive copyediting that
substantially contributed to the book’s
accuracy and readability.
Wanda A. Lauziere of the CFA Program Division, the project
manager for the revision,
expertly guided the manuscript from planning through
production and made many other
contributions to all aspects of the revision.
Finally, we thank Ibbotson Associates of Chicago for
generously providing us with EnCorr
AnalyzerTM.
xvii
INTRODUCTION
CFA Institute is pleased to provide you with this Investment
Series covering major areas in
the field of investments. These texts are thoroughly grounded in
the highly regarded CFA
Program Candidate Body of Knowledge (CBOK®) that draws
upon hundreds of practicing
investment professionals and serves as the anchor for the three
levels of the CFA Examinations.
In the year this series is being launched, more than 120,000
aspiring investment professionals
will each devote over 250 hours of study to master this material
as well as other elements of
the Candidate Body of Knowledge in order to obtain the coveted
CFA charter. We provide
these materials for the same reason we have been chartering
investment professionals for over
40 years: to improve the competency and ethical character of
those serving the capital markets.
PARENTAGE
One of the valuable attributes of this series derives from its
parentage. In the 1940s, a handful
of societies had risen to form communities that revolved around
common interests and work
in what we now think of as the investment industry.
Understand that the idea of purchasing common stock as an
investment — as opposed to
casino speculation — was only a couple of decades old at most.
We were only 10 years past the
creation of the U.S. Securities and Exchange Commission and
laws that attempted to level the
playing field after robber baron and stock market panic
episodes.
In January 1945, in what is today CFA Institute Financial
Analysts Journal , a funda-
mentally driven professor and practitioner from Columbia
University and Graham-Newman
Corporation wrote an article making the case that people who
research and manage portfolios
should have some sort of credential to demonstrate competence
and ethical behavior. This
person was none other than Benjamin Graham, the father of
security analysis and future
mentor to a well-known modern investor, Warren Buffett.
The idea of creating a credential took a mere 16 years to drive
to execution but by 1963,
284 brave souls, all over the age of 45, took an exam and
launched the CFA credential. What
many do not fully understand was that this effort had at its root
a desire to create a profession
where its practitioners were professionals who provided
investing services to individuals in
need. In so doing, a fairer and more productive capital market
would result.
A profession — whether it be medicine, law, or other — has
certain hallmark characteristics.
These characteristics are part of what attracts serious
individuals to devote the energy of their
life’s work to the investment endeavor. First, and tightly
connected to this Series, there must
be a body of knowledge. Second, there needs to be some entry
requirements such as those
required to achieve the CFA credential. Third, there must be a
commitment to continuing
education. Fourth, a profession must serve a purpose beyond
one’s direct selfish interest. In
this case, by properly conducting one’s affairs and putting
client interests first, the investment
xix
xx Introduction
professional can work as a fair-minded cog in the wheel of the
incredibly productive global
capital markets. This encourages the citizenry to part with their
hard-earned savings to be
redeployed in fair and productive pursuit.
As C. Stewart Sheppard, founding executive director of the
Institute of Chartered Financial
Analysts said, ‘‘Society demands more from a profession and its
members than it does from a
professional craftsman in trade, arts, or business. In return for
status, prestige, and autonomy, a
profession extends a public warranty that it has established and
maintains conditions of entry,
standards of fair practice, disciplinary procedures, and
continuing education for its particular
constituency. Much is expected from members of a profession,
but over time, more is given.’’
‘‘The Standards for Educational and Psychological Testing,’’
put forth by the American
Psychological Association, the American Educational Research
Association, and the National
Council on Measurement in Education, state that the validity of
professional credentialing
examinations should be demonstrated primarily by verifying
that the content of the examina-
tion accurately represents professional practice. In addition, a
practice analysis study, which
confirms the knowledge and skills required for the competent
professional, should be the basis
for establishing content validity.
For more than 40 years, hundreds upon hundreds of
practitioners and academics have
served on CFA Institute curriculum committees sifting through
and winnowing all the many
investment concepts and ideas to create a body of knowledge
and the CFA curriculum. One of
the hallmarks of curriculum development at CFA Institute is its
extensive use of practitioners
in all phases of the process.
CFA Institute has followed a formal practice analysis process
since 1995. The effort
involves special practice analysis forums held, most recently, at
20 locations around the world.
Results of the forums were put forth to 70,000 CFA
charterholders for verification and
confirmation of the body of knowledge so derived.
What this means for the reader is that the concepts contained in
these texts were driven
by practicing professionals in the field who understand the
responsibilities and knowledge that
practitioners in the industry need to be successful. We are
pleased to put this extensive effort
to work for the benefit of the readers of the Investment Series.
BENEFITS
This series will prove useful both to the new student of capital
markets, who is seriously
contemplating entry into the extremely competitive field of
investment management, and to
the more seasoned professional who is looking for a user-
friendly way to keep one’s knowledge
current. All chapters include extensive references for those who
would like to dig deeper into
a given concept. The workbooks provide a summary of each
chapter’s key points to help
organize your thoughts, as well as sample questions and answers
to test yourself on your
progress.
For the new student, the essential concepts that any investment
professional needs to
master are presented in a time-tested fashion. This material, in
addition to university study
and reading the financial press, will help you better understand
the investment field. I believe
that the general public seriously underestimates the disciplined
processes needed for the best
investment firms and individuals to prosper. These texts lay the
basic groundwork for many
of the processes that successful firms use. Without this base
level of understanding and an
appreciation for how the capital markets work to properly price
securities, you may not find
Introduction xxi
competitive success. Furthermore, the concepts herein give a
genuine sense of the kind of work
that is to be found day to day managing portfolios, doing
research, or related endeavors.
The investment profession, despite its relatively lucrative
compensation, is not for
everyone. It takes a special kind of individual to fundamentally
understand and absorb the
teachings from this body of work and then convert that into
application in the practitioner
world. In fact, most individuals who enter the field do not
survive in the longer run. The
aspiring professional should think long and hard about whether
this is the field for him or
herself. There is no better way to make such a critical decision
than to be prepared by reading
and evaluating the gospel of the profession.
The more experienced professional understands that the nature
of the capital markets
requires a commitment to continuous learning. Markets evolve
as quickly as smart minds can
find new ways to create an exposure, to attract capital, or to
manage risk. A number of the
concepts in these pages were not present a decade or two ago
when many of us were starting
out in the business. Hedge funds, derivatives, alternative
investment concepts, and behavioral
finance are examples of new applications and concepts that have
altered the capital markets in
recent years. As markets invent and reinvent themselves, a best-
in-class foundation investment
series is of great value.
Those of us who have been at this business for a while know
that we must continuously
hone our skills and knowledge if we are to compete with the
young talent that constantly
emerges. In fact, as we talk to major employers about their
training needs, we are often
told that one of the biggest challenges they face is how to help
the experienced professional,
laboring under heavy time pressure, keep up with the state of
the art and the more recently
educated associates. This series can be part of that answer.
CONVENTIONAL WISDOM
It doesn’t take long for the astute investment professional to
realize two common characteristics
of markets. First, prices are set by conventional wisdom, or a
function of the many variables
in the market. Truth in markets is, at its essence, what the
market believes it is and how it
assesses pricing credits or debits on those beliefs. Second, as
conventional wisdom is a product
of the evolution of general theory and learning, by definition
conventional wisdom is often
wrong or at the least subject to material change.
When I first entered this industry in the mid-1970s,
conventional wisdom held that
the concepts examined in these texts were a bit too academic to
be heavily employed in the
competitive marketplace. Many of those considered to be the
best investment firms at the
time were led by men who had an eclectic style, an intuitive
sense of markets, and a great
track record. In the rough-and-tumble world of the practitioner,
some of these concepts were
considered to be of no use. Could conventional wisdom have
been more wrong? If so, I’m not
sure when.
During the years of my tenure in the profession, the practitioner
investment management
firms that evolved successfully were full of determined,
intelligent, intellectually curious
investment professionals who endeavored to apply these
concepts in a serious and disciplined
manner. Today, the best firms are run by those who carefully
form investment hypotheses
and test them rigorously in the marketplace, whether it be in a
quant strategy, in comparative
shopping for stocks within an industry, or in many hedge fund
strategies. Their goal is to
create investment processes that can be replicated with some
statistical reliability. I believe
xxii Introduction
those who embraced the so-called academic side of the learning
equation have been much
more successful as real-world investment managers.
THE TEXTS
Approximately 35 percent of the Candidate Body of Knowledge
is represented in the initial
four texts of the series. Additional texts on corporate finance
and international financial
statement analysis are in development, and more topics may be
forthcoming.
One of the most prominent texts over the years in the
investment management industry
has been Maginn and Tuttle’s Managing Investment Portfolios:
A Dynamic Process. The third
edition updates key concepts from the 1990 second edition.
Some of the more experienced
members of our community, like myself, own the prior two
editions and will add this
to our library. Not only does this tome take the concepts from
the other readings and
put them in a portfolio context, it also updates the concepts of
alternative investments,
performance presentation standards, portfolio execution and,
very importantly, managing
individual investor portfolios. To direct attention, long focused
on institutional portfolios,
toward the individual will make this edition an important
improvement over the past.
Quantitative Investment Analysis focuses on some key tools that
are needed for today’s
professional investor. In addition to classic time value of
money, discounted cash flow
applications, and probability material, there are two aspects that
can be of value over
traditional thinking.
First are the chapters dealing with correlation and regression
that ultimately figure into
the formation of hypotheses for purposes of testing. This gets to
a critical skill that many
professionals are challenged by: the ability to sift out the wheat
from the chaff. For most
investment researchers and managers, their analysis is not
solely the result of newly created
data and tests that they perform. Rather, they synthesize and
analyze primary research done
by others. Without a rigorous manner by which to understand
quality research, not only can
you not understand good research, you really have no basis by
which to evaluate less rigorous
research. What is often put forth in the applied world as good
quantitative research lacks rigor
and validity.
Second, the last chapter on portfolio concepts moves the reader
beyond the traditional
capital asset pricing model (CAPM) type of tools and into the
more practical world of
multifactor models and to arbitrage pricing theory. Many have
felt that there has been a
CAPM bias to the work put forth in the past, and this chapter
helps move beyond that point.
Equity Asset Valuation is a particularly cogent and important
read for anyone involved
in estimating the value of securities and understanding security
pricing. A well-informed
professional would know that the common forms of equity
valuation — dividend discount
modeling, free cash flow modeling, price/earnings models, and
residual income models (often
known by trade names) — can all be reconciled to one another
under certain assumptions.
With a deep understanding of the underlying assumptions, the
professional investor can better
understand what other investors assume when calculating their
valuation estimates. In my
prior life as the head of an equity investment team, this
knowledge would give us an edge over
other investors.
Fixed Income Analysis has been at the frontier of new concepts
in recent years, greatly
expanding horizons over the past. This text is probably the one
with the most new material for
the seasoned professional who is not a fixed-income specialist.
The application of option and
derivative technology to the once staid province of fixed income
has helped contribute to an
Introduction xxiii
explosion of thought in this area. And not only does that
challenge the professional to stay up
to speed with credit derivatives, swaptions, collateralized
mortgage securities, mortgage backs,
and others, but it also puts a strain on the world’s central banks
to provide oversight and the
risk of a correlated event. Armed with a thorough grasp of the
new exposures, the professional
investor is much better able to anticipate and understand the
challenges our central bankers
and markets face.
I hope you find this new series helpful in your efforts to grow
your investment knowledge,
whether you are a relatively new entrant or a grizzled veteran
ethically bound to keep up
to date in the ever-changing market environment. CFA Institute,
as a long-term committed
participant of the investment profession and a not-for-profit
association, is pleased to give you
this opportunity.
Jeff Diermeier, CFA
President and Chief Executive Officer
CFA Institute
September 2006
QUANTITATIVE
INVESTMENT
ANALYSIS
CHAPTER 1
THE TIME VALUE
OF MONEY
1. INTRODUCTION
As individuals, we often face decisions that involve saving
money for a future use, or borrowing
money for current consumption. We then need to determine the
amount we need to invest, if
we are saving, or the cost of borrowing, if we are shopping for a
loan. As investment analysts,
much of our work also involves evaluating transactions with
present and future cash flows.
When we place a value on any security, for example, we are
attempting to determine the
worth of a stream of future cash flows. To carry out all the
above tasks accurately, we must
understand the mathematics of time value of money problems.
Money has time value in that
individuals value a given amount of money more highly the
earlier it is received. Therefore,
a smaller amount of money now may be equivalent in value to a
larger amount received at
a future date. The time value of money as a topic in investment
mathematics deals with
equivalence relationships between cash flows with different
dates. Mastery of time value of
money concepts and techniques is essential for investment
analysts.
The chapter is organized as follows: Section 2 introduces some
terminology used through-
out the chapter and supplies some economic intuition for the
variables we will discuss.
Section 3 tackles the problem of determining the worth at a
future point in time of an amount
invested today. Section 4 addresses the future worth of a series
of cash flows. These two
sections provide the tools for calculating the equivalent value at
a future date of a single cash
flow or series of cash flows. Sections 5 and 6 discuss the
equivalent value today of a single
future cash flow and a series of future cash flows, respectively.
In Section 7, we explore how to
determine other quantities of interest in time value of money
problems.
2. INTEREST RATES: INTERPRETATION
In this chapter, we will continually refer to interest rates. In
some cases, we assume a particular
value for the interest rate; in other cases, the interest rate will
be the unknown quantity we
seek to determine. Before turning to the mechanics of time
value of money problems, we must
illustrate the underlying economic concepts. In this section, we
briefly explain the meaning
and interpretation of interest rates.
Time value of money concerns equivalence relationships
between cash flows occurring
on different dates. The idea of equivalence relationships is
relatively simple. Consider the
following exchange: You pay $10,000 today and in return
receive $9,500 today. Would you
1
2 Quantitative Investment Analysis
accept this arrangement? Not likely. But what if you received
the $9,500 today and paid
the $10,000 one year from now? Can these amounts be
considered equivalent? Possibly,
because a payment of $10,000 a year from now would probably
be worth less to you than a
payment of $10,000 today. It would be fair, therefore, to
discount the $10,000 received in
one year; that is, to cut its value based on how much time
passes before the money is paid.
An interest rate, denoted r, is a rate of return that reflects the
relationship between differently
dated cash flows. If $9,500 today and $10,000 in one year are
equivalent in value, then
$10,000 − $9,500 = $500 is the required compensation for
receiving $10,000 in one year
rather than now. The interest rate — the required compensation
stated as a rate of return — is
$500/$9,500 = 0.0526 or 5.26 percent.
Interest rates can be thought of in three ways. First, they can be
considered required rates
of return — that is, the minimum rate of return an investor must
receive in order to accept the
investment. Second, interest rates can be considered discount
rates. In the example above, 5.26
percent is that rate at which we discounted the $10,000 future
amount to find its value today.
Thus, we use the terms ‘‘interest rate’’ and ‘‘discount rate’’
almost interchangeably. Third,
interest rates can be considered opportunity costs. An
opportunity cost is the value that
investors forgo by choosing a particular course of action. In the
example, if the party who sup-
plied $9,500 had instead decided to spend it today, he would
have forgone earning 5.26 percent
on the money. So we can view 5.26 percent as the opportunity
cost of current consumption.
Economics tells us that interest rates are set in the marketplace
by the forces of supply
and demand, where investors are suppliers of funds and
borrowers are demanders of funds.
Taking the perspective of investors in analyzing market-
determined interest rates, we can view
an interest rate r as being composed of a real risk-free interest
rate plus a set of four premiums
that are required returns or compensation for bearing distinct
types of risk:
r = Real risk-free interest rate + Inflation premium + Default
risk premium
+ Liquidity premium + Maturity premium
• The real risk-free interest rate is the single-period interest rate
for a completely risk-free
security if no inflation were expected. In economic theory, the
real risk-free rate reflects the
time preferences of individuals for current versus future real
consumption.
• The inflation premium compensates investors for expected
inflation and reflects the average
inflation rate expected over the maturity of the debt. Inflation
reduces the purchasing power
of a unit of currency — the amount of goods and services one
can buy with it. The sum of the
real risk-free interest rate and the inflation premium is the
nominal risk-free interest rate.1
Many countries have governmental short-term debt whose
interest rate can be considered
to represent the nominal risk-free interest rate in that country.
The interest rate on a 90-day
U.S. Treasury bill (T-bill), for example, represents the nominal
risk-free interest rate over
that time horizon.2 U.S. T-bills can be bought and sold in large
quantities with minimal
transaction costs and are backed by the full faith and credit of
the U.S. government.
1Technically, 1 plus the nominal rate equals the product of 1
plus the real rate and 1 plus the inflation
rate. As a quick approximation, however, the nominal rate is
equal to the real rate plus an inflation
premium. In this discussion we focus on approximate additive
relationships to highlight the underlying
concepts.
2Other developed countries issue securities similar to U.S.
Treasury bills. The French government issues
BTFs or negotiable fixed-rate discount Treasury bills (Bons du
Trésor à taux fixe et à intérêts précomptés)
with maturities of 3, 6, and 12 months. The Japanese
government issues a short-term Treasury bill with
maturities of 6 and 12 months. The German government issues
at discount both Treasury financing
Chapter 1 The Time Value of Money 3
• The default risk premium compensates investors for the
possibility that the borrower will
fail to make a promised payment at the contracted time and in
the contracted amount.
• The liquidity premium compensates investors for the risk of
loss relative to an investment’s
fair value if the investment needs to be converted to cash
quickly. U.S. T-bills, for example,
do not bear a liquidity premium because large amounts can be
bought and sold without
affecting their market price. Many bonds of small issuers, by
contrast, trade infrequently
after they are issued; the interest rate on such bonds includes a
liquidity premium reflecting
the relatively high costs (including the impact on price) of
selling a position.
• The maturity premium compensates investors for the increased
sensitivity of the market
value of debt to a change in market interest rates as maturity is
extended, in general (holding
all else equal). The difference between the interest rate on
longer-maturity, liquid Treasury
debt and that on short-term Treasury debt reflects a positive
maturity premium for the
longer-term debt (and possibly different inflation premiums as
well).
Using this insight into the economic meaning of interest rates,
we now turn to a discussion of
solving time value of money problems, starting with the future
value of a single cash flow.
3. THE FUTURE VALUE OF A
SINGLE CASH FLOW
In this section, we introduce time value associated with a single
cash flow or lump-sum
investment. We describe the relationship between an initial
investment or present value (PV),
which earns a rate of return (the interest rate per period)
denoted as r, and its future value
(FV), which will be received N years or periods from today.
The following example illustrates this concept. Suppose you
invest $100 (PV = $100) in
an interest-bearing bank account paying 5 percent annually. At
the end of the first year, you
will have the $100 plus the interest earned, 0.05× $100 = $5, for
a total of $105. To formalize
this one-period example, we define the following terms:
PV = present value of the investment
FVN = future value of the investment N periods from today
r = rate of interest per period
For N = 1, the expression for the future value of amount PV is
FV1 = PV(1 + r) (1-1)
For this example, we calculate the future value one year from
today as FV1 = $100(1.05) =
$105.
Now suppose you decide to invest the initial $100 for two years
with interest earned and
credited to your account annually (annual compounding). At the
end of the first year (the
paper (Finanzierungsschätze des Bundes or, for short, Schätze)
and Treasury discount paper (Bubills) with
maturities up to 24 months. In the United Kingdom, the British
government issues gilt-edged Treasury
bills with maturities ranging from 1 to 364 days. The Canadian
government bond market is closely
related to the U.S. market; Canadian Treasury bills have
maturities of 3, 6, and 12 months.
4 Quantitative Investment Analysis
beginning of the second year), your account will have $105,
which you will leave in the bank
for another year. Thus, with a beginning amount of $105 (PV =
$105), the amount at the
end of the second year will be $105(1.05) = $110.25. Note that
the $5.25 interest earned
during the second year is 5 percent of the amount invested at
the beginning of Year 2.
Another way to understand this example is to note that the
amount invested at the
beginning of Year 2 is composed of the original $100 that you
invested plus the $5 interest
earned during the first year. During the second year, the
original principal again earns interest,
as does the interest that was earned during Year 1. You can see
how the original investment
grows:
Original investment $100.00
Interest for the first year ($100 × 0.05) 5.00
Interest for the second year based on original investment ($100
× 0.05) 5.00
Interest for the second year based on interest earned in the first
year
(0.05× $5.00 interest on interest) 0.25
Total $110.25
The $5 interest that you earned each period on the $100 original
investment is known as
simple interest (the interest rate times the principal). Principal
is the amount of funds
originally invested. During the two-year period, you earn $10 of
simple interest. The extra
$0.25 that you have at the end of Year 2 is the interest you
earned on the Year 1 interest of $5
that you reinvested.
The interest earned on interest provides the first glimpse of the
phenomenon known
as compounding. Although the interest earned on the initial
investment is important, for a
given interest rate it is fixed in size from period to period. The
compounded interest earned
on reinvested interest is a far more powerful force because, for
a given interest rate, it grows
in size each period. The importance of compounding increases
with the magnitude of the
interest rate. For example, $100 invested today would be worth
about $13,150 after 100 years
if compounded annually at 5 percent, but worth more than $20
million if compounded
annually over the same time period at a rate of 13 percent.
To verify the $20 million figure, we need a general formula to
handle compounding for
any number of periods. The following general formula relates
the present value of an initial
investment to its future value after N periods:
FVN = PV(1 + r)N (1-2)
where r is the stated interest rate per period and N is the number
of compounding periods.
In the bank example, FV2 = $100(1 + 0.05)2 = $110.25. In the
13 percent investment
example, FV100 = $100(1.13)100 = $20,316,287.42.
The most important point to remember about using the future
value equation is that the
stated interest rate, r, and the number of compounding periods,
N , must be compatible. Both
variables must be defined in the same time units. For example,
if N is stated in months, then
r should be the one-month interest rate, unannualized.
A time line helps us to keep track of the compatibility of time
units and the interest rate
per time period. In the time line, we use the time index t to
represent a point in time a stated
number of periods from today. Thus the present value is the
amount available for investment
today, indexed as t = 0. We can now refer to a time N periods
from today as t = N . The
time line in Figure 1-1 shows this relationship.
Chapter 1 The Time Value of Money 5
0 1 2 3 ... N − 1 N
PV FVN = PV(1 + r)
N
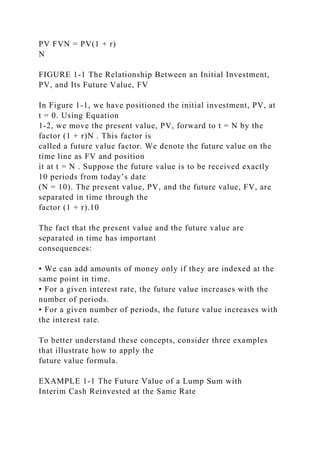
FIGURE 1-1 The Relationship Between an Initial Investment,
PV, and Its Future Value, FV
In Figure 1-1, we have positioned the initial investment, PV, at
t = 0. Using Equation
1-2, we move the present value, PV, forward to t = N by the
factor (1 + r)N . This factor is
called a future value factor. We denote the future value on the
time line as FV and position
it at t = N . Suppose the future value is to be received exactly
10 periods from today’s date
(N = 10). The present value, PV, and the future value, FV, are
separated in time through the
factor (1 + r).10
The fact that the present value and the future value are
separated in time has important
consequences:
• We can add amounts of money only if they are indexed at the
same point in time.
• For a given interest rate, the future value increases with the
number of periods.
• For a given number of periods, the future value increases with
the interest rate.
To better understand these concepts, consider three examples
that illustrate how to apply the
future value formula.
EXAMPLE 1-1 The Future Value of a Lump Sum with
Interim Cash Reinvested at the Same Rate
You are the lucky winner of your state’s lottery of $5 million
after taxes. You invest your
winnings in a five-year certificate of deposit (CD) at a local
financial institution. The
CD promises to pay 7 percent per year compounded annually.
This institution also lets
you reinvest the interest at that rate for the duration of the CD.
How much will you
have at the end of five years if your money remains invested at
7 percent for five years
with no withdrawals?
Solution
: To solve this problem, compute the future value of the $5
million investment
using the following values in Equation 1-2:
PV = $5,000,000
r = 7% = 0.07
N = 5
FVN = PV(1 + r)N
= $5,000,000(1.07)5
6 Quantitative Investment Analysis
= $5, 000, 000(1.402552)
= $7, 012, 758.65
At the end of five years, you will have $7,012,758.65 if your
money remains invested at
7 percent with no withdrawals.
In this and most examples in this chapter, note that the factors
are reported at six decimal places
but the calculations may actually reflect greater precision. For
example, the reported 1.402552
has been rounded up from 1.40255173 (the calculation is
actually carried out with more than
eight decimal places of precision by the calculator or
spreadsheet). Our final result reflects the
higher number of decimal places carried by the calculator or
spreadsheet.3
EXAMPLE 1-2 The Future Value of a Lump Sum
with No Interim Cash
An institution offers you the following terms for a contract: For
an investment of
¥2,500,000, the institution promises to pay you a lump sum six
years from now at an
8 percent annual interest rate. What future amount can you
expect?

More Related Content

Similar to QUANTITATIVEINVESTMENTANALYSISSecond Edition.docx

adaptive-approximation-based-control_compress.pdf
adaptive-approximation-based-control_compress.pdfadaptive-approximation-based-control_compress.pdf
adaptive-approximation-based-control_compress.pdfssuser5a68bb
 
Chapter11 projectriskanalysis
Chapter11 projectriskanalysisChapter11 projectriskanalysis
Chapter11 projectriskanalysisAKSHAYA0000
 
Drozdenko fm 22602 602 pm page v copyright © 2002
Drozdenko fm  22602  602 pm  page v copyright © 2002Drozdenko fm  22602  602 pm  page v copyright © 2002
Drozdenko fm 22602 602 pm page v copyright © 2002joney4
 
Risky business: Guide to Risk Management
Risky business: Guide to Risk ManagementRisky business: Guide to Risk Management
Risky business: Guide to Risk ManagementMichael Le
 
Greene_econometric_5ta edición.pdf
Greene_econometric_5ta edición.pdfGreene_econometric_5ta edición.pdf
Greene_econometric_5ta edición.pdfLuisa Mee 666
 
Vskills certified business analytics professional
Vskills certified business analytics professionalVskills certified business analytics professional
Vskills certified business analytics professionalVskills
 
Global body-investment-knowledge
Global body-investment-knowledgeGlobal body-investment-knowledge
Global body-investment-knowledgeLaureana E. Cortez
 
Dr Con Menictas and Brian Fine present 'Exclusive Research How to Successfull...
Dr Con Menictas and Brian Fine present 'Exclusive Research How to Successfull...Dr Con Menictas and Brian Fine present 'Exclusive Research How to Successfull...
Dr Con Menictas and Brian Fine present 'Exclusive Research How to Successfull...Brittany Ferdinands
 
Dan Stefanica - A Primer for the Mathematics of Financial Engineering-FE Pres...
Dan Stefanica - A Primer for the Mathematics of Financial Engineering-FE Pres...Dan Stefanica - A Primer for the Mathematics of Financial Engineering-FE Pres...
Dan Stefanica - A Primer for the Mathematics of Financial Engineering-FE Pres...AyanRocks
 
Discounted Cash Flow Methodology for Banks and Credit Unions
Discounted Cash Flow Methodology for Banks and Credit UnionsDiscounted Cash Flow Methodology for Banks and Credit Unions
Discounted Cash Flow Methodology for Banks and Credit UnionsLibby Bierman
 
Maintaining Credit Quality in Banks and Credit Unions
Maintaining Credit Quality in Banks and Credit UnionsMaintaining Credit Quality in Banks and Credit Unions
Maintaining Credit Quality in Banks and Credit UnionsLibby Bierman
 
A decade of CDO pricing
A decade of CDO pricingA decade of CDO pricing
A decade of CDO pricingfinancedude
 
Asa wisconsin chapter april 2015 meeting presentation: residual values for ma...
Asa wisconsin chapter april 2015 meeting presentation: residual values for ma...Asa wisconsin chapter april 2015 meeting presentation: residual values for ma...
Asa wisconsin chapter april 2015 meeting presentation: residual values for ma...Theresa Zeidler-Shonat, ASA
 
Targeting Risky Credit
Targeting Risky CreditTargeting Risky Credit
Targeting Risky CreditAARollason
 
DMBAR - Data Mining and Business Analytics with R - Johannes Ledolter.pdf
DMBAR - Data Mining and Business Analytics with R - Johannes Ledolter.pdfDMBAR - Data Mining and Business Analytics with R - Johannes Ledolter.pdf
DMBAR - Data Mining and Business Analytics with R - Johannes Ledolter.pdfSanthosh Prabhu
 
Forward-Looking ALLL: Computing Qualitative Adjustments
Forward-Looking ALLL: Computing Qualitative AdjustmentsForward-Looking ALLL: Computing Qualitative Adjustments
Forward-Looking ALLL: Computing Qualitative AdjustmentsLibby Bierman
 

Similar to QUANTITATIVEINVESTMENTANALYSISSecond Edition.docx (20)

adaptive-approximation-based-control_compress.pdf
adaptive-approximation-based-control_compress.pdfadaptive-approximation-based-control_compress.pdf
adaptive-approximation-based-control_compress.pdf
 
PhD_Thesis_Dimos_Andronoudis
PhD_Thesis_Dimos_AndronoudisPhD_Thesis_Dimos_Andronoudis
PhD_Thesis_Dimos_Andronoudis
 
Aaa Framework
Aaa FrameworkAaa Framework
Aaa Framework
 
Chapter11 projectriskanalysis
Chapter11 projectriskanalysisChapter11 projectriskanalysis
Chapter11 projectriskanalysis
 
Drozdenko fm 22602 602 pm page v copyright © 2002
Drozdenko fm  22602  602 pm  page v copyright © 2002Drozdenko fm  22602  602 pm  page v copyright © 2002
Drozdenko fm 22602 602 pm page v copyright © 2002
 
Risky business: Guide to Risk Management
Risky business: Guide to Risk ManagementRisky business: Guide to Risk Management
Risky business: Guide to Risk Management
 
Greene_econometric_5ta edición.pdf
Greene_econometric_5ta edición.pdfGreene_econometric_5ta edición.pdf
Greene_econometric_5ta edición.pdf
 
stevensThesis
stevensThesisstevensThesis
stevensThesis
 
Vskills certified business analytics professional
Vskills certified business analytics professionalVskills certified business analytics professional
Vskills certified business analytics professional
 
Global body-investment-knowledge
Global body-investment-knowledgeGlobal body-investment-knowledge
Global body-investment-knowledge
 
Dr Con Menictas and Brian Fine present 'Exclusive Research How to Successfull...
Dr Con Menictas and Brian Fine present 'Exclusive Research How to Successfull...Dr Con Menictas and Brian Fine present 'Exclusive Research How to Successfull...
Dr Con Menictas and Brian Fine present 'Exclusive Research How to Successfull...
 
Dan Stefanica - A Primer for the Mathematics of Financial Engineering-FE Pres...
Dan Stefanica - A Primer for the Mathematics of Financial Engineering-FE Pres...Dan Stefanica - A Primer for the Mathematics of Financial Engineering-FE Pres...
Dan Stefanica - A Primer for the Mathematics of Financial Engineering-FE Pres...
 
Discounted Cash Flow Methodology for Banks and Credit Unions
Discounted Cash Flow Methodology for Banks and Credit UnionsDiscounted Cash Flow Methodology for Banks and Credit Unions
Discounted Cash Flow Methodology for Banks and Credit Unions
 
Maintaining Credit Quality in Banks and Credit Unions
Maintaining Credit Quality in Banks and Credit UnionsMaintaining Credit Quality in Banks and Credit Unions
Maintaining Credit Quality in Banks and Credit Unions
 
A decade of CDO pricing
A decade of CDO pricingA decade of CDO pricing
A decade of CDO pricing
 
Asa wisconsin chapter april 2015 meeting presentation: residual values for ma...
Asa wisconsin chapter april 2015 meeting presentation: residual values for ma...Asa wisconsin chapter april 2015 meeting presentation: residual values for ma...
Asa wisconsin chapter april 2015 meeting presentation: residual values for ma...
 
Training Module
Training ModuleTraining Module
Training Module
 
Targeting Risky Credit
Targeting Risky CreditTargeting Risky Credit
Targeting Risky Credit
 
DMBAR - Data Mining and Business Analytics with R - Johannes Ledolter.pdf
DMBAR - Data Mining and Business Analytics with R - Johannes Ledolter.pdfDMBAR - Data Mining and Business Analytics with R - Johannes Ledolter.pdf
DMBAR - Data Mining and Business Analytics with R - Johannes Ledolter.pdf
 
Forward-Looking ALLL: Computing Qualitative Adjustments
Forward-Looking ALLL: Computing Qualitative AdjustmentsForward-Looking ALLL: Computing Qualitative Adjustments
Forward-Looking ALLL: Computing Qualitative Adjustments
 

More from makdul

According to Davenport (2014) social media and health care are c.docx
According to Davenport (2014) social media and health care are c.docxAccording to Davenport (2014) social media and health care are c.docx
According to Davenport (2014) social media and health care are c.docxmakdul
 
According to (Fatehi, Gordon & Florida, N.D.) theoretical orient.docx
According to (Fatehi, Gordon & Florida, N.D.) theoretical orient.docxAccording to (Fatehi, Gordon & Florida, N.D.) theoretical orient.docx
According to (Fatehi, Gordon & Florida, N.D.) theoretical orient.docxmakdul
 
According to Libertarianism, there is no right to any social service.docx
According to Libertarianism, there is no right to any social service.docxAccording to Libertarianism, there is no right to any social service.docx
According to Libertarianism, there is no right to any social service.docxmakdul
 
According to Kirk (2016), most of your time will be spent working wi.docx
According to Kirk (2016), most of your time will be spent working wi.docxAccording to Kirk (2016), most of your time will be spent working wi.docx
According to Kirk (2016), most of your time will be spent working wi.docxmakdul
 
According to cultural deviance theorists like Cohen, deviant sub.docx
According to cultural deviance theorists like Cohen, deviant sub.docxAccording to cultural deviance theorists like Cohen, deviant sub.docx
According to cultural deviance theorists like Cohen, deviant sub.docxmakdul
 
According to Gray et al, (2017) critical appraisal is the proce.docx
According to Gray et al, (2017) critical appraisal is the proce.docxAccording to Gray et al, (2017) critical appraisal is the proce.docx
According to Gray et al, (2017) critical appraisal is the proce.docxmakdul
 
According to article Insecure Policing Under Racial Capitalism by.docx
According to article Insecure Policing Under Racial Capitalism by.docxAccording to article Insecure Policing Under Racial Capitalism by.docx
According to article Insecure Policing Under Racial Capitalism by.docxmakdul
 
Abstract In this experiment, examining the equivalence poi.docx
Abstract  In this experiment, examining the equivalence poi.docxAbstract  In this experiment, examining the equivalence poi.docx
Abstract In this experiment, examining the equivalence poi.docxmakdul
 
ACC 403- ASSIGNMENT 2 RUBRIC!!!Points 280Assignment 2 Audi.docx
ACC 403- ASSIGNMENT 2 RUBRIC!!!Points 280Assignment 2 Audi.docxACC 403- ASSIGNMENT 2 RUBRIC!!!Points 280Assignment 2 Audi.docx
ACC 403- ASSIGNMENT 2 RUBRIC!!!Points 280Assignment 2 Audi.docxmakdul
 
ACC 601 Managerial Accounting Group Case 3 (160 points) .docx
ACC 601 Managerial Accounting Group Case 3 (160 points) .docxACC 601 Managerial Accounting Group Case 3 (160 points) .docx
ACC 601 Managerial Accounting Group Case 3 (160 points) .docxmakdul
 
Academic Integrity A Letter to My Students[1] Bill T.docx
Academic Integrity A Letter to My Students[1]  Bill T.docxAcademic Integrity A Letter to My Students[1]  Bill T.docx
Academic Integrity A Letter to My Students[1] Bill T.docxmakdul
 
Access the Center for Disease Control and Prevention’s (CDC’s) Nu.docx
Access the Center for Disease Control and Prevention’s (CDC’s) Nu.docxAccess the Center for Disease Control and Prevention’s (CDC’s) Nu.docx
Access the Center for Disease Control and Prevention’s (CDC’s) Nu.docxmakdul
 
According to DSM 5 This patient had very many symptoms that sugg.docx
According to DSM 5 This patient had very many symptoms that sugg.docxAccording to DSM 5 This patient had very many symptoms that sugg.docx
According to DSM 5 This patient had very many symptoms that sugg.docxmakdul
 
Acceptable concerts include professional orchestras, soloists, jazz,.docx
Acceptable concerts include professional orchestras, soloists, jazz,.docxAcceptable concerts include professional orchestras, soloists, jazz,.docx
Acceptable concerts include professional orchestras, soloists, jazz,.docxmakdul
 
ACA was passed in 2010, under the presidency of Barack Obama. Pr.docx
ACA was passed in 2010, under the presidency of Barack Obama. Pr.docxACA was passed in 2010, under the presidency of Barack Obama. Pr.docx
ACA was passed in 2010, under the presidency of Barack Obama. Pr.docxmakdul
 
Access the FASB website. Once you login, click the FASB Accounting S.docx
Access the FASB website. Once you login, click the FASB Accounting S.docxAccess the FASB website. Once you login, click the FASB Accounting S.docx
Access the FASB website. Once you login, click the FASB Accounting S.docxmakdul
 
Academic Paper  Overview  This performance task was intended to asse.docx
Academic Paper  Overview  This performance task was intended to asse.docxAcademic Paper  Overview  This performance task was intended to asse.docx
Academic Paper  Overview  This performance task was intended to asse.docxmakdul
 
Academic Research Team Project PaperCOVID-19 Open Research Datas.docx
Academic Research Team Project PaperCOVID-19 Open Research Datas.docxAcademic Research Team Project PaperCOVID-19 Open Research Datas.docx
Academic Research Team Project PaperCOVID-19 Open Research Datas.docxmakdul
 
AbstractVoice over Internet Protocol (VoIP) is an advanced t.docx
AbstractVoice over Internet Protocol (VoIP) is an advanced t.docxAbstractVoice over Internet Protocol (VoIP) is an advanced t.docx
AbstractVoice over Internet Protocol (VoIP) is an advanced t.docxmakdul
 
Abstract                                 Structure of Abstra.docx
Abstract                                 Structure of Abstra.docxAbstract                                 Structure of Abstra.docx
Abstract                                 Structure of Abstra.docxmakdul
 

More from makdul (20)

According to Davenport (2014) social media and health care are c.docx
According to Davenport (2014) social media and health care are c.docxAccording to Davenport (2014) social media and health care are c.docx
According to Davenport (2014) social media and health care are c.docx
 
According to (Fatehi, Gordon & Florida, N.D.) theoretical orient.docx
According to (Fatehi, Gordon & Florida, N.D.) theoretical orient.docxAccording to (Fatehi, Gordon & Florida, N.D.) theoretical orient.docx
According to (Fatehi, Gordon & Florida, N.D.) theoretical orient.docx
 
According to Libertarianism, there is no right to any social service.docx
According to Libertarianism, there is no right to any social service.docxAccording to Libertarianism, there is no right to any social service.docx
According to Libertarianism, there is no right to any social service.docx
 
According to Kirk (2016), most of your time will be spent working wi.docx
According to Kirk (2016), most of your time will be spent working wi.docxAccording to Kirk (2016), most of your time will be spent working wi.docx
According to Kirk (2016), most of your time will be spent working wi.docx
 
According to cultural deviance theorists like Cohen, deviant sub.docx
According to cultural deviance theorists like Cohen, deviant sub.docxAccording to cultural deviance theorists like Cohen, deviant sub.docx
According to cultural deviance theorists like Cohen, deviant sub.docx
 
According to Gray et al, (2017) critical appraisal is the proce.docx
According to Gray et al, (2017) critical appraisal is the proce.docxAccording to Gray et al, (2017) critical appraisal is the proce.docx
According to Gray et al, (2017) critical appraisal is the proce.docx
 
According to article Insecure Policing Under Racial Capitalism by.docx
According to article Insecure Policing Under Racial Capitalism by.docxAccording to article Insecure Policing Under Racial Capitalism by.docx
According to article Insecure Policing Under Racial Capitalism by.docx
 
Abstract In this experiment, examining the equivalence poi.docx
Abstract  In this experiment, examining the equivalence poi.docxAbstract  In this experiment, examining the equivalence poi.docx
Abstract In this experiment, examining the equivalence poi.docx
 
ACC 403- ASSIGNMENT 2 RUBRIC!!!Points 280Assignment 2 Audi.docx
ACC 403- ASSIGNMENT 2 RUBRIC!!!Points 280Assignment 2 Audi.docxACC 403- ASSIGNMENT 2 RUBRIC!!!Points 280Assignment 2 Audi.docx
ACC 403- ASSIGNMENT 2 RUBRIC!!!Points 280Assignment 2 Audi.docx
 
ACC 601 Managerial Accounting Group Case 3 (160 points) .docx
ACC 601 Managerial Accounting Group Case 3 (160 points) .docxACC 601 Managerial Accounting Group Case 3 (160 points) .docx
ACC 601 Managerial Accounting Group Case 3 (160 points) .docx
 
Academic Integrity A Letter to My Students[1] Bill T.docx
Academic Integrity A Letter to My Students[1]  Bill T.docxAcademic Integrity A Letter to My Students[1]  Bill T.docx
Academic Integrity A Letter to My Students[1] Bill T.docx
 
Access the Center for Disease Control and Prevention’s (CDC’s) Nu.docx
Access the Center for Disease Control and Prevention’s (CDC’s) Nu.docxAccess the Center for Disease Control and Prevention’s (CDC’s) Nu.docx
Access the Center for Disease Control and Prevention’s (CDC’s) Nu.docx
 
According to DSM 5 This patient had very many symptoms that sugg.docx
According to DSM 5 This patient had very many symptoms that sugg.docxAccording to DSM 5 This patient had very many symptoms that sugg.docx
According to DSM 5 This patient had very many symptoms that sugg.docx
 
Acceptable concerts include professional orchestras, soloists, jazz,.docx
Acceptable concerts include professional orchestras, soloists, jazz,.docxAcceptable concerts include professional orchestras, soloists, jazz,.docx
Acceptable concerts include professional orchestras, soloists, jazz,.docx
 
ACA was passed in 2010, under the presidency of Barack Obama. Pr.docx
ACA was passed in 2010, under the presidency of Barack Obama. Pr.docxACA was passed in 2010, under the presidency of Barack Obama. Pr.docx
ACA was passed in 2010, under the presidency of Barack Obama. Pr.docx
 
Access the FASB website. Once you login, click the FASB Accounting S.docx
Access the FASB website. Once you login, click the FASB Accounting S.docxAccess the FASB website. Once you login, click the FASB Accounting S.docx
Access the FASB website. Once you login, click the FASB Accounting S.docx
 
Academic Paper  Overview  This performance task was intended to asse.docx
Academic Paper  Overview  This performance task was intended to asse.docxAcademic Paper  Overview  This performance task was intended to asse.docx
Academic Paper  Overview  This performance task was intended to asse.docx
 
Academic Research Team Project PaperCOVID-19 Open Research Datas.docx
Academic Research Team Project PaperCOVID-19 Open Research Datas.docxAcademic Research Team Project PaperCOVID-19 Open Research Datas.docx
Academic Research Team Project PaperCOVID-19 Open Research Datas.docx
 
AbstractVoice over Internet Protocol (VoIP) is an advanced t.docx
AbstractVoice over Internet Protocol (VoIP) is an advanced t.docxAbstractVoice over Internet Protocol (VoIP) is an advanced t.docx
AbstractVoice over Internet Protocol (VoIP) is an advanced t.docx
 
Abstract                                 Structure of Abstra.docx
Abstract                                 Structure of Abstra.docxAbstract                                 Structure of Abstra.docx
Abstract                                 Structure of Abstra.docx
 

Recently uploaded

Explore beautiful and ugly buildings. Mathematics helps us create beautiful d...
Explore beautiful and ugly buildings. Mathematics helps us create beautiful d...Explore beautiful and ugly buildings. Mathematics helps us create beautiful d...
Explore beautiful and ugly buildings. Mathematics helps us create beautiful d...christianmathematics
 
Introduction to Nonprofit Accounting: The Basics
Introduction to Nonprofit Accounting: The BasicsIntroduction to Nonprofit Accounting: The Basics
Introduction to Nonprofit Accounting: The BasicsTechSoup
 
General AI for Medical Educators April 2024
General AI for Medical Educators April 2024General AI for Medical Educators April 2024
General AI for Medical Educators April 2024Janet Corral
 
APM Welcome, APM North West Network Conference, Synergies Across Sectors
APM Welcome, APM North West Network Conference, Synergies Across SectorsAPM Welcome, APM North West Network Conference, Synergies Across Sectors
APM Welcome, APM North West Network Conference, Synergies Across SectorsAssociation for Project Management
 
BAG TECHNIQUE Bag technique-a tool making use of public health bag through wh...
BAG TECHNIQUE Bag technique-a tool making use of public health bag through wh...BAG TECHNIQUE Bag technique-a tool making use of public health bag through wh...
BAG TECHNIQUE Bag technique-a tool making use of public health bag through wh...Sapna Thakur
 
Web & Social Media Analytics Previous Year Question Paper.pdf
Web & Social Media Analytics Previous Year Question Paper.pdfWeb & Social Media Analytics Previous Year Question Paper.pdf
Web & Social Media Analytics Previous Year Question Paper.pdfJayanti Pande
 
1029-Danh muc Sach Giao Khoa khoi 6.pdf
1029-Danh muc Sach Giao Khoa khoi  6.pdf1029-Danh muc Sach Giao Khoa khoi  6.pdf
1029-Danh muc Sach Giao Khoa khoi 6.pdfQucHHunhnh
 
Key note speaker Neum_Admir Softic_ENG.pdf
Key note speaker Neum_Admir Softic_ENG.pdfKey note speaker Neum_Admir Softic_ENG.pdf
Key note speaker Neum_Admir Softic_ENG.pdfAdmir Softic
 
Holdier Curriculum Vitae (April 2024).pdf
Holdier Curriculum Vitae (April 2024).pdfHoldier Curriculum Vitae (April 2024).pdf
Holdier Curriculum Vitae (April 2024).pdfagholdier
 
Advanced Views - Calendar View in Odoo 17
Advanced Views - Calendar View in Odoo 17Advanced Views - Calendar View in Odoo 17
Advanced Views - Calendar View in Odoo 17Celine George
 
Measures of Central Tendency: Mean, Median and Mode
Measures of Central Tendency: Mean, Median and ModeMeasures of Central Tendency: Mean, Median and Mode
Measures of Central Tendency: Mean, Median and ModeThiyagu K
 
Interactive Powerpoint_How to Master effective communication
Interactive Powerpoint_How to Master effective communicationInteractive Powerpoint_How to Master effective communication
Interactive Powerpoint_How to Master effective communicationnomboosow
 
social pharmacy d-pharm 1st year by Pragati K. Mahajan
social pharmacy d-pharm 1st year by Pragati K. Mahajansocial pharmacy d-pharm 1st year by Pragati K. Mahajan
social pharmacy d-pharm 1st year by Pragati K. Mahajanpragatimahajan3
 
Z Score,T Score, Percential Rank and Box Plot Graph
Z Score,T Score, Percential Rank and Box Plot GraphZ Score,T Score, Percential Rank and Box Plot Graph
Z Score,T Score, Percential Rank and Box Plot GraphThiyagu K
 
Measures of Dispersion and Variability: Range, QD, AD and SD
Measures of Dispersion and Variability: Range, QD, AD and SDMeasures of Dispersion and Variability: Range, QD, AD and SD
Measures of Dispersion and Variability: Range, QD, AD and SDThiyagu K
 
Paris 2024 Olympic Geographies - an activity
Paris 2024 Olympic Geographies - an activityParis 2024 Olympic Geographies - an activity
Paris 2024 Olympic Geographies - an activityGeoBlogs
 
Q4-W6-Restating Informational Text Grade 3
Q4-W6-Restating Informational Text Grade 3Q4-W6-Restating Informational Text Grade 3
Q4-W6-Restating Informational Text Grade 3JemimahLaneBuaron
 
BASLIQ CURRENT LOOKBOOK LOOKBOOK(1) (1).pdf
BASLIQ CURRENT LOOKBOOK  LOOKBOOK(1) (1).pdfBASLIQ CURRENT LOOKBOOK  LOOKBOOK(1) (1).pdf
BASLIQ CURRENT LOOKBOOK LOOKBOOK(1) (1).pdfSoniaTolstoy
 
Call Girls in Dwarka Mor Delhi Contact Us 9654467111
Call Girls in Dwarka Mor Delhi Contact Us 9654467111Call Girls in Dwarka Mor Delhi Contact Us 9654467111
Call Girls in Dwarka Mor Delhi Contact Us 9654467111Sapana Sha
 

Recently uploaded (20)

Explore beautiful and ugly buildings. Mathematics helps us create beautiful d...
Explore beautiful and ugly buildings. Mathematics helps us create beautiful d...Explore beautiful and ugly buildings. Mathematics helps us create beautiful d...
Explore beautiful and ugly buildings. Mathematics helps us create beautiful d...
 
Introduction to Nonprofit Accounting: The Basics
Introduction to Nonprofit Accounting: The BasicsIntroduction to Nonprofit Accounting: The Basics
Introduction to Nonprofit Accounting: The Basics
 
General AI for Medical Educators April 2024
General AI for Medical Educators April 2024General AI for Medical Educators April 2024
General AI for Medical Educators April 2024
 
APM Welcome, APM North West Network Conference, Synergies Across Sectors
APM Welcome, APM North West Network Conference, Synergies Across SectorsAPM Welcome, APM North West Network Conference, Synergies Across Sectors
APM Welcome, APM North West Network Conference, Synergies Across Sectors
 
BAG TECHNIQUE Bag technique-a tool making use of public health bag through wh...
BAG TECHNIQUE Bag technique-a tool making use of public health bag through wh...BAG TECHNIQUE Bag technique-a tool making use of public health bag through wh...
BAG TECHNIQUE Bag technique-a tool making use of public health bag through wh...
 
Web & Social Media Analytics Previous Year Question Paper.pdf
Web & Social Media Analytics Previous Year Question Paper.pdfWeb & Social Media Analytics Previous Year Question Paper.pdf
Web & Social Media Analytics Previous Year Question Paper.pdf
 
1029-Danh muc Sach Giao Khoa khoi 6.pdf
1029-Danh muc Sach Giao Khoa khoi  6.pdf1029-Danh muc Sach Giao Khoa khoi  6.pdf
1029-Danh muc Sach Giao Khoa khoi 6.pdf
 
Key note speaker Neum_Admir Softic_ENG.pdf
Key note speaker Neum_Admir Softic_ENG.pdfKey note speaker Neum_Admir Softic_ENG.pdf
Key note speaker Neum_Admir Softic_ENG.pdf
 
Holdier Curriculum Vitae (April 2024).pdf
Holdier Curriculum Vitae (April 2024).pdfHoldier Curriculum Vitae (April 2024).pdf
Holdier Curriculum Vitae (April 2024).pdf
 
Advanced Views - Calendar View in Odoo 17
Advanced Views - Calendar View in Odoo 17Advanced Views - Calendar View in Odoo 17
Advanced Views - Calendar View in Odoo 17
 
Measures of Central Tendency: Mean, Median and Mode
Measures of Central Tendency: Mean, Median and ModeMeasures of Central Tendency: Mean, Median and Mode
Measures of Central Tendency: Mean, Median and Mode
 
Interactive Powerpoint_How to Master effective communication
Interactive Powerpoint_How to Master effective communicationInteractive Powerpoint_How to Master effective communication
Interactive Powerpoint_How to Master effective communication
 
social pharmacy d-pharm 1st year by Pragati K. Mahajan
social pharmacy d-pharm 1st year by Pragati K. Mahajansocial pharmacy d-pharm 1st year by Pragati K. Mahajan
social pharmacy d-pharm 1st year by Pragati K. Mahajan
 
Z Score,T Score, Percential Rank and Box Plot Graph
Z Score,T Score, Percential Rank and Box Plot GraphZ Score,T Score, Percential Rank and Box Plot Graph
Z Score,T Score, Percential Rank and Box Plot Graph
 
Measures of Dispersion and Variability: Range, QD, AD and SD
Measures of Dispersion and Variability: Range, QD, AD and SDMeasures of Dispersion and Variability: Range, QD, AD and SD
Measures of Dispersion and Variability: Range, QD, AD and SD
 
Paris 2024 Olympic Geographies - an activity
Paris 2024 Olympic Geographies - an activityParis 2024 Olympic Geographies - an activity
Paris 2024 Olympic Geographies - an activity
 
Código Creativo y Arte de Software | Unidad 1
Código Creativo y Arte de Software | Unidad 1Código Creativo y Arte de Software | Unidad 1
Código Creativo y Arte de Software | Unidad 1
 
Q4-W6-Restating Informational Text Grade 3
Q4-W6-Restating Informational Text Grade 3Q4-W6-Restating Informational Text Grade 3
Q4-W6-Restating Informational Text Grade 3
 
BASLIQ CURRENT LOOKBOOK LOOKBOOK(1) (1).pdf
BASLIQ CURRENT LOOKBOOK  LOOKBOOK(1) (1).pdfBASLIQ CURRENT LOOKBOOK  LOOKBOOK(1) (1).pdf
BASLIQ CURRENT LOOKBOOK LOOKBOOK(1) (1).pdf
 
Call Girls in Dwarka Mor Delhi Contact Us 9654467111
Call Girls in Dwarka Mor Delhi Contact Us 9654467111Call Girls in Dwarka Mor Delhi Contact Us 9654467111
Call Girls in Dwarka Mor Delhi Contact Us 9654467111
 

QUANTITATIVEINVESTMENTANALYSISSecond Edition.docx

  • 1. QUANTITATIVE INVESTMENT ANALYSIS Second Edition Richard A. DeFusco, CFA Dennis W. McLeavey, CFA Jerald E. Pinto, CFA David E. Runkle, CFA John Wiley & Sons, Inc. QUANTITATIVE INVESTMENT ANALYSIS Second Edition Richard A. DeFusco, CFA Dennis W. McLeavey, CFA
  • 2. Jerald E. Pinto, CFA David E. Runkle, CFA John Wiley & Sons, Inc. Copyright c⃝ 2004, 2007 by CFA Institute. All rights reserved. Published by John Wiley & Sons, Inc., Hoboken, New Jersey. Published simultaneously in Canada. No part of this publication may be reproduced, stored in a retrieval system, or transmitted in any form or by any means, electronic, mechanical, photocopying, recording, scanning, or otherwise, except as permitted under Section 107 or 108 of the 1976 United States Copyright Act, without either the prior written permission of the Publisher, or authorization through payment of the appropriate per-copy fee to the Copyright Clearance Center, Inc., 222 Rosewood Drive, Danvers, MA 01923, (978) 750-8400, fax (978) 646-8600, or on the Web at www.copyright.com. Requests to the Publisher for permission should be addressed to the Permissions Department, John Wiley & Sons, Inc., 111 River Street, Hoboken, NJ 07030, (201) 748-6011, fax (201) 748-6008, or online at http://www.wiley.com/go/permissions. Limit of Liability/Disclaimer of Warranty: While the publisher and author have used their best efforts in preparing this book, they make no representations or warranties with respect to the accuracy or completeness of the contents of this book and specifically disclaim any implied warranties of merchantability or fitness for a particular purpose. No warranty may be created or extended by sales representatives or
  • 3. written sales materials. The advice and strategies contained herein may not be suitable for your situation. You should consult with a professional where appropriate. Neither the publisher nor author shall be liable for any loss of profit or any other commercial damages, including but not limited to special, incidental, consequential, or other damages. For general information on our other products and services or for technical support, please contact our Customer Care Department within the United States at (800) 762-2974, outside the United States at (317) 572-3993 or fax (317) 572-4002. Wiley also publishes its books in a variety of electronic formats. Some content that appears in print may not be available in electronic formats. For more information about Wiley products, visit our Web site at www.wiley.com. Library of Congress Cataloging-in-Publication Data: Quantitative investment analysis / Richard A. DeFusco . . . [et al.]. — 2nd ed. p. cm. — (The CFA Institute investment series) Includes bibliographical references. ISBN-13 978-0-470-05220-4 (cloth) ISBN-10 0-470-05220-1 (cloth) 1. Investment analysis — Mathematical models. I. DeFusco, Richard Armand. HG4529.Q35 2006 332.601’5195 — dc22
  • 4. 2006052578 Printed in the United States of America. 10 9 8 7 6 5 4 3 2 1 To Margo, Rachel, and Rebekah R.A.D. To Jan, Christine, and Andy D.W.M. In memory of Irwin T. Vanderhoof, CFA J.E.P. To Patricia, Anne, and Sarah D.E.R. CONTENTS Foreword xiii Acknowledgments xvii Introduction xix CHAPTER 1 The Time Value of Money 1 1 Introduction 1 2 Interest Rates: Interpretation 1 3 The Future Value of a Single Cash Flow 3
  • 5. 3.1 The Frequency of Compounding 8 3.2 Continuous Compounding 10 3.3 Stated and Effective Rates 12 4 The Future Value of a Series of Cash Flows 13 4.1 Equal Cash Flows — Ordinary Annuity 13 4.2 Unequal Cash Flows 15 5 The Present Value of a Single Cash Flow 15 5.1 Finding the Present Value of a Single Cash Flow 15 5.2 The Frequency of Compounding 17 6 The Present Value of a Series of Cash Flows 19 6.1 The Present Value of a Series of Equal Cash Flows 19 6.2 The Present Value of an Infinite Series of Equal Cash Flows — Perpetuity 23 6.3 Present Values Indexed at Times Other Than t = 0 24 6.4 The Present Value of a Series of Unequal Cash Flows 26 7 Solving for Rates, Number of Periods, or Size of Annuity Payments 27 7.1 Solving for Interest Rates and Growth Rates 27 7.2 Solving for the Number of Periods 30 7.3 Solving for the Size of Annuity Payments 30 7.4 Review of Present and Future Value Equivalence 35 7.5 The Cash Flow Additivity Principle 36 vii viii Contents CHAPTER 2 Discounted Cash Flow Applications 39
  • 6. 1 Introduction 39 2 Net Present Value and Internal Rate of Return 39 2.1 Net Present Value and the Net Present Value Rule 40 2.2 The Internal Rate of Return and the Internal Rate of Return Rule 42 2.3 Problems with the IRR Rule 45 3 Portfolio Return Measurement 47 3.1 Money-Weighted Rate of Return 47 3.2 Time-Weighted Rate of Return 49 4 Money Market Yields 54 CHAPTER 3 Statistical Concepts and Market Returns 61 1 Introduction 61 2 Some Fundamental Concepts 61 2.1 The Nature of Statistics 62 2.2 Populations and Samples 62 2.3 Measurement Scales 63 3 Summarizing Data Using Frequency Distributions 65 4 The Graphic Presentation of Data 72 4.1 The Histogram 73 4.2 The Frequency Polygon and the Cumulative Frequency Distribution 74 5 Measures of Central Tendency 76 5.1 The Arithmetic Mean 77
  • 7. 5.2 The Median 81 5.3 The Mode 84 5.4 Other Concepts of Mean 85 6 Other Measures of Location: Quantiles 94 6.1 Quartiles, Quintiles, Deciles, and Percentiles 94 6.2 Quantiles in Investment Practice 98 7 Measures of Dispersion 100 7.1 The Range 100 7.2 The Mean Absolute Deviation 101 7.3 Population Variance and Population Standard Deviation 103 7.4 Sample Variance and Sample Standard Deviation 106 7.5 Semivariance, Semideviation, and Related Concepts 110 7.6 Chebyshev’s Inequality 111 7.7 Coefficient of Variation 113 7.8 The Sharpe Ratio 115 8 Symmetry and Skewness in Return Distributions 118 9 Kurtosis in Return Distributions 123 10 Using Geometric and Arithmetic Means 127 Contents ix CHAPTER 4 Probability Concepts 129 1 Introduction 129 2 Probability, Expected Value, and Variance 129 3 Portfolio Expected Return and Variance of Return 152 4 Topics in Probability 161
  • 8. 4.1 Bayes’ Formula 161 4.2 Principles of Counting 166 CHAPTER 5 Common Probability Distributions 171 1 Introduction 171 2 Discrete Random Variables 171 2.1 The Discrete Uniform Distribution 173 2.2 The Binomial Distribution 175 3 Continuous Random Variables 185 3.1 Continuous Uniform Distribution 186 3.2 The Normal Distribution 189 3.3 Applications of the Normal Distribution 197 3.4 The Lognormal Distribution 200 4 Monte Carlo Simulation 206 CHAPTER 6 Sampling and Estimation 215 1 Introduction 215 2 Sampling 215 2.1 Simple Random Sampling 216 2.2 Stratified Random Sampling 217 2.3 Time-Series and Cross-Sectional Data 219 3 Distribution of the Sample Mean 221 3.1 The Central Limit Theorem 222 4 Point and Interval Estimates of the Population Mean 225 4.1 Point Estimators 225 4.2 Confidence Intervals for the Population Mean 227
  • 9. 4.3 Selection of Sample Size 233 5 More on Sampling 235 5.1 Data-Mining Bias 236 5.2 Sample Selection Bias 238 5.3 Look-Ahead Bias 240 5.4 Time-Period Bias 240 CHAPTER 7 Hypothesis Testing 243 1 Introduction 243 2 Hypothesis Testing 244 x Contents 3 Hypothesis Tests Concerning the Mean 253 3.1 Tests Concerning a Single Mean 254 3.2 Tests Concerning Differences between Means 261 3.3 Tests Concerning Mean Differences 265 4 Hypothesis Tests Concerning Variance 269 4.1 Tests Concerning a Single Variance 269 4.2 Tests Concerning the Equality (Inequality) of Two Variances 271 5 Other Issues: Nonparametric Inference 275 5.1 Tests Concerning Correlation: The Spearman Rank Correlation Coefficient 276 5.2 Nonparametric Inference: Summary 279 CHAPTER 8 Correlation and Regression 281
  • 10. 1 Introduction 281 2 Correlation Analysis 281 2.1 Scatter Plots 281 2.2 Correlation Analysis 282 2.3 Calculating and Interpreting the Correlation Coefficient 283 2.4 Limitations of Correlation Analysis 287 2.5 Uses of Correlation Analysis 289 2.6 Testing the Significance of the Correlation Coefficient 297 3 Linear Regression 300 3.1 Linear Regression with One Independent Variable 300 3.2 Assumptions of the Linear Regression Model 303 3.3 The Standard Error of Estimate 306 3.4 The Coefficient of Determination 309 3.5 Hypothesis Testing 310 3.6 Analysis of Variance in a Regression with One Independent Variable 318 3.7 Prediction Intervals 321 3.8 Limitations of Regression Analysis 324 CHAPTER 9 Multiple Regression and Issues in Regression Analysis 325 1 Introduction 325 2 Multiple Linear Regression 325 2.1 Assumptions of the Multiple Linear Regression Model 331 2.2 Predicting the Dependent Variable in a Multiple Regression Model 336 2.3 Testing Whether All Population Regression Coefficients Equal Zero 338 2.4 Adjusted R2 340 3 Using Dummy Variables in Regressions 341
  • 11. 4 Violations of Regression Assumptions 345 4.1 Heteroskedasticity 345 4.2 Serial Correlation 351 4.3 Multicollinearity 356 Contents xi 4.4 Heteroskedasticity, Serial Correlation, Multicollinearity: Summarizing the Issues 359 5 Model Specification and Errors in Specification 359 5.1 Principles of Model Specification 359 5.2 Misspecified Functional Form 360 5.3 Time-Series Misspecification (Independent Variables Correlated with Errors) 368 5.4 Other Types of Time-Series Misspecification 372 6 Models with Qualitative Dependent Variables 372 CHAPTER 10 Time-Series Analysis 375 1 Introduction 375 2 Challenges of Working with Time Series 375 3 Trend Models 377 3.1 Linear Trend Models 377 3.2 Log-Linear Trend Models 380 3.3 Trend Models and Testing for Correlated Errors 385 4 Autoregressive (AR) Time-Series Models 386
  • 12. 4.1 Covariance-Stationary Series 386 4.2 Detecting Serially Correlated Errors in an Autoregressive Model 387 4.3 Mean Reversion 391 4.4 Multiperiod Forecasts and the Chain Rule of Forecasting 391 4.5 Comparing Forecast Model Performance 394 4.6 Instability of Regression Coefficients 397 5 Random Walks and Unit Roots 399 5.1 Random Walks 400 5.2 The Unit Root Test of Nonstationarity 403 6 Moving-Average Time-Series Models 407 6.1 Smoothing Past Values with an n-Period Moving Average 407 6.2 Moving-Average Time-Series Models for Forecasting 409 7 Seasonality in Time-Series Models 412 8 Autoregressive Moving-Average Models 416 9 Autoregressive Conditional Heteroskedasticity Models 417 10 Regressions with More than One Time Series 420 11 Other Issues in Time Series 424 12 Suggested Steps in Time-Series Forecasting 425 CHAPTER 11 Portfolio Concepts 429 1 Introduction 429 2 Mean – Variance Analysis 429 2.1 The Minimum-Variance Frontier and Related Concepts 430 2.2 Extension to the Three-Asset Case 439 2.3 Determining the Minimum-Variance Frontier for Many Assets 442 2.4 Diversification and Portfolio Size 445
  • 13. xii Contents 2.5 Portfolio Choice with a Risk-Free Asset 449 2.6 The Capital Asset Pricing Model 458 2.7 Mean – Variance Portfolio Choice Rules: An Introduction 460 3 Practical Issues in Mean – Variance Analysis 464 3.1 Estimating Inputs for Mean – Variance Optimization 464 3.2 Instability in the Minimum-Variance Frontier 470 4 Multifactor Models 473 4.1 Factors and Types of Multifactor Models 474 4.2 The Structure of Macroeconomic Factor Models 475 4.3 Arbitrage Pricing Theory and the Factor Model 478 4.4 The Structure of Fundamental Factor Models 484 4.5 Multifactor Models in Current Practice 485 4.6 Applications 493 4.7 Concluding Remarks 509 Appendices 511 References 521 Glossary 527 About the CFA Program 541 About the Authors 543 Index 545
  • 14. FOREWORD HOW QUANTITATIVE INVESTMENT ANALYSIS CAN IMPROVE PORTFOLIO DECISION MAKING I am a Quant. By my own self-admission, I use quantitative investment techniques in the management of investment portfolios. However, when I tell people that I am a Quant, they often respond: ‘‘But Mark, aren’t you a lawyer?’’ Well, yes, but . . . The fact is that Quants come from all walks of life. Whether we are called Quants, Quant Jocks, Gear Heads, Computer Monkeys, or any of the other monikers that are attached to investors who like to scribble equations on a piece of paper, we all share a common denominator — the use of quantitative analysis to make better investment decisions. You don’t have to be a rocket scientist with a Ph.D. in an esoteric mathematical field to be a Quant (although there are, I suspect, several former rocket scientists who have found working in the financial markets to be both fun and profitable). Anyone can become a Quant — even a lawyer. But let’s take a step back. Why should any investor want to use quantitative tools in the management of investment portfolios? There are three reasons why Quants are so popular. First, the financial markets are very complicated places. There are many interwoven variables that can affect the price of securities in an investment
  • 15. portfolio. For example, the stock price of a public company can be affected by macroeconomic factors such as the level of interest rates, current account deficits, government spending, and economic cycles. These factors may affect the cost of capital at which a corporation finances its new projects, or influence the spending patterns of the company’s customers, or provide economic impetus through government spending programs. In addition to macro variables, the value of a company’s stock can be affected by factors that are peculiar to the company itself. Factors such as cash flow, working capital, book- to-market value, earnings growth rates, dividend policy, and debt-to-equity ratios affect the individual value of each public company. These are considered to be the fundamental factors that have an impact on the specific company as opposed to the broader stock market. Then we come to the financial market variables that affect a company’s valuation. Its ‘‘beta’’ or measure of systematic risk will impact the expected return for the company and, in turn, its stock price. The famous Capital Asset Pricing Model that measures a stock’s beta is really just a linear regression equation of the type described in Chapter 8. Last, there are behavioral variables that can affect security values. Such behavior as herding, overconfidence, overreaction to earnings announcements, and momentum trading can all impact the price of a company’s stock. These behavioral
  • 16. variables can have a lasting impact on a stock price (remember the technology bubble of 1998 – 2001 when tech stocks were going to take over the world?) as well as generate a significant amount of ‘‘noise’’ around a security’s true value. xiii xiv Foreword Considering all of these variables together at one time to determine the true value of a security can be an overwhelming task without some framework in which to analyze their impact. It is simply not possible for the human mind alone (at least, not mine) to be able to weigh the impact of individual company specific factors such as price-to-earnings ratios, macroeconomic variables such as government spending programs, investor behavioral patterns such as momentum trading, and other potentially influential variables in a rigorous fashion within the human brain. This is where Quantitative Investment Analysis can help. Factor modeling techniques such as those described in Chapter 11 can be used to supplement the intuition of the human mind to produce a quantitative framework that digests the large number of plausible variables that can impact the price of a security. Further, given the many variables that can affect a security’s value, it is not possible to consider each variable in isolation.
  • 17. The economic factors that cause a security’s price to go up or down are interwoven in a complex web such that the variables must be considered together to determine their collective impact on the price of a security. This is where the value of Chapters 8 and 9 are most useful. These two chapters provide the basic knowledge for building regression equations to study the impact of economic factors on security prices. The regression techniques provided in Chapters 8 and 9 can be used to filter out which variables have a significant impact on the price of a security, and which variables just provide ‘‘noise.’’ In addition, Chapter 9 introduces the reader to ‘‘dummy variables.’’ Despite their name, you don’t have to be a dummy like me to use them. Dummy variables are a neat way to study different states of the world and their impact on security prices. They are often referred to as ‘‘binary’’ variables because they divide the world into two states for observation, for example, financial markets up versus financial markets down; Republicans in control of the White House versus Democrats in control of the White House; Chicago Cubs win (almost never) versus Chicago Cubs lose; and so on. This last variable — the record of the Chicago Cubs — I can attest has no impact on security valuations, although, as a long-standing and suffering Cub fan, it does have an impact on my morale. As another example, consider a recent research paper where I studied the behavior of
  • 18. private equity managers in the way they price their private equity portfolios depending on whether the public stock markets were doing well versus when the public stock markets were doing poorly. To conduct this analysis, I ran a regression equation using dummy variables to divide the world into two states: up public stock markets versus down public stock markets. By using dummy variables in this manner, I was able to observe different behavioral patterns of private equity managers in how they marked up or down their private equity portfolios depending on the performance of the public stock markets. The second reason Quantitative Investment Analysis will add value to the reader is that it provides the basic tools to consider a breadth of economic factors and securities. It is not only the fact that there are many interwoven economic variables that impact the value of a security, the sheer number of securities in the market place can be daunting. Therefore, most investors only look at a subset of the investable securities in the market. Consider the U.S. stock market. Generally, this market is divided into three categories based on company size: large-cap, mid-cap, and small-cap stocks. This division is less so because there might be ‘‘size’’ effects in valuation, but rather, because of the pragmatic limitation that asset managers simply cannot analyze stocks beyond a certain number. So traditional fundamental investors select different parts of the U.S. stock market in which to conduct their security analysis. However, the division of the stock market into size categories effectively
  • 19. establishes barriers for investment managers. There is no reason, for example, why a portfolio Foreword xv manager with insight into how earnings surprises affect stock prices cannot invest across the whole range of stock market capitalization. This is where Chapters 6 and 7 can be useful. The quantitative skills of sampling, estimation, and hypothesis testing can be used to analyze large baskets of data. This allows portfolio managers to invest across a broad universe of stocks, breaking down traditional barriers such as cap-size restrictions. When viewed in this light, quantitative analysis does not displace the fundamental stock picking skills of traditional asset managers. Rather, quantitative analysis extends the portfolio manager’s insight with respect to company, macro, and market variables to a broader array of investment opportunities. This also has implications for the statistical tools and probability concepts provided in Chapters 3 and 4. The larger the data set to be analyzed the greater the reliability of the parameter estimation derived from that data set. Breadth of economic analysis will improve not only the statistical reliability of the quantitative analysis, but will also increase the predictability of the relationships between economic factors and stock price movement. The statistical tools provided in this book allow the portfolio manager to realize the
  • 20. full potential of his or her skill across a larger universe of securities than may have previously been achieved. Another example might help. Every year the California Public Employees’ Retirement System (CalPERS), my former employer, publishes a list of the most poorly governed companies in the United States. This list has now been published for 16 years and has been very successful. Early on in the process, the selection was conducted on a subset of the U.S. stock market. However, this process has evolved to consider every U.S. stock held in CalPERS’s portfolio regardless of stock market capitalization range. This requires the analysis of up to 1,800 stocks every year based on both economic factors and governance variables. The sheer number of securities in this data sample could not be analyzed without the application of quantitative screening tools to expand the governance universe for CalPERS. Last, Quantitative Investment Analysis can provide a certain amount of discipline to the investment process. We are all human, and as humans, we are subject to making mistakes. If I were to recount all of the investment mistakes that I have made over my career, this Foreword would exceed the length of the chapters in this book. Just as a brief example, one of my ‘‘better calls’’ was Starbucks Coffee. Early on when Starbucks was just getting started, I visited one of their shops to see what the buzz was all about. At that time a Latte Grande was selling for about $1.50. I recall that I thought this was an outrageous price
  • 21. and I can remember distinctly saying: ‘‘Oh, this is a dumb idea, this will never catch on!’’ Ah yes . . . So back to quantitative techniques — how can they help? In this instance, they could have helped me remove my human biases and to think more analytically about Starbucks’ prospects. If I had taken the time to conduct an empirical review using the quantitative tools provided in this text, I would have seen the fundamental value underlying that buck-fifty Latte. The fact is that we are all subject to behavioral biases such as overconfidence, momentum, and overreaction. Not only can these be analyzed as discussed above, they can be revealed and discounted when we make our investment decisions. Perhaps the single biggest behavioral hurdle to overcome for investors is the inability to sell a security when its value declines. All too often we become almost emotionally attached to the securities in our portfolio such that we find it hard to sell a security that begins to decline in price. Yet, this is precisely, where Quantitative Investment Analysis can help because it is dispassionate. Quantitative tools and modeling techniques can take the emotion and cognitive biases out of the portfolio decision-making process. As portfolio managers, our goal is to be objective, critical, and demanding. Unfortunately, sometimes our embedded habits and opinions can get in the way. However, quantitative models are unemotional and they can root
  • 22. xvi Foreword out our cognitive biases in a way that we simply cannot do ourselves by looking in the mirror (in fact, when I look in the mirror I see someone who is six feet and four inches tall and incredibly good looking but then my wife Mary reminds me that I am only six feet and one inch tall and she had better offers). All in all, the investor will appreciate the methods, models, and techniques provided in this text. This book serves as an excellent introduction to those investors who are just beginning to use quantitative tools in their portfolio management process as well as an excellent reference guide for those already converted. Quantitative investing is not difficult to grasp — even a lawyer can do it. Mark J. P. Anson CEO, Hermes Pensions Management CEO, British Telecomm Pension Scheme [email protected] ACKNOWLEDGMENTS W e would like to thank the many individuals who played important roles in producingthis book. Robert R. Johnson, CFA, Managing Director of the CFA and CIPM Programs Division,
  • 23. saw the need for specialized curriculum materials and initiated this project. We appreciate his support for the timely revision of this textbook. Senior executives in the CFA Program Division have generously given their advice and time in the writing of both editions of this book. Philip J. Young, CFA, provided continuous assistance in writing the book’s learning outcome statements and participated in final manuscript reviews. Jan R. Squires, CFA, contributed an orientation stressing motivation and testability. Mary K. Erickson, CFA, made contributions to the accuracy of the text. John D. Stowe, CFA, supplied suggestions for revising several chapters. The Executive Advisory Board of the Candidate Curriculum Committee provided invaluable input: James Bronson, CFA, Chair; Peter Mackey, CFA, Immediate Past Chair; and members, Alan Meder, CFA, Victoria Rati, CFA, and Matt Scanlan, CFA, as well as the Candidate Curriculum Committee Working Body. The manuscript reviewers for this edition were Philip Fanara, Jr., CFA; Jane Farris, CFA; David M. Jessop; Lisa M. Joublanc, CFA; Asjeet S. Lamba, CFA; Mario Lavallee, CFA; William L. Randolph, CFA; Eric N. Remole; Vijay Singal, CFA; Zoe L. Van Schyndel, CFA; Charlotte Weems, CFA; and Lavone F. Whitmer, CFA. We thank them for their excellent work. We also appreciate the many comments received from those who used the first edition.
  • 24. Jacques R. Gagne, CFA, Gregory M. Noronha, CFA, and Sanjiv Sabherwal provided highly detailed proofreading of the individual chapters. We thank each for their dedicated and painstaking work. We are also indebted to Dr. Sabherwal for his expert assistance in running regressions, revising in-chapter examples, and creating some of the end-of-chapter problems/solutions. Fiona D. Russell provided incisive copyediting that substantially contributed to the book’s accuracy and readability. Wanda A. Lauziere of the CFA Program Division, the project manager for the revision, expertly guided the manuscript from planning through production and made many other contributions to all aspects of the revision. Finally, we thank Ibbotson Associates of Chicago for generously providing us with EnCorr AnalyzerTM. xvii INTRODUCTION CFA Institute is pleased to provide you with this Investment Series covering major areas in the field of investments. These texts are thoroughly grounded in
  • 25. the highly regarded CFA Program Candidate Body of Knowledge (CBOK®) that draws upon hundreds of practicing investment professionals and serves as the anchor for the three levels of the CFA Examinations. In the year this series is being launched, more than 120,000 aspiring investment professionals will each devote over 250 hours of study to master this material as well as other elements of the Candidate Body of Knowledge in order to obtain the coveted CFA charter. We provide these materials for the same reason we have been chartering investment professionals for over 40 years: to improve the competency and ethical character of those serving the capital markets. PARENTAGE One of the valuable attributes of this series derives from its parentage. In the 1940s, a handful of societies had risen to form communities that revolved around common interests and work in what we now think of as the investment industry. Understand that the idea of purchasing common stock as an investment — as opposed to casino speculation — was only a couple of decades old at most. We were only 10 years past the creation of the U.S. Securities and Exchange Commission and laws that attempted to level the playing field after robber baron and stock market panic episodes. In January 1945, in what is today CFA Institute Financial Analysts Journal , a funda- mentally driven professor and practitioner from Columbia
  • 26. University and Graham-Newman Corporation wrote an article making the case that people who research and manage portfolios should have some sort of credential to demonstrate competence and ethical behavior. This person was none other than Benjamin Graham, the father of security analysis and future mentor to a well-known modern investor, Warren Buffett. The idea of creating a credential took a mere 16 years to drive to execution but by 1963, 284 brave souls, all over the age of 45, took an exam and launched the CFA credential. What many do not fully understand was that this effort had at its root a desire to create a profession where its practitioners were professionals who provided investing services to individuals in need. In so doing, a fairer and more productive capital market would result. A profession — whether it be medicine, law, or other — has certain hallmark characteristics. These characteristics are part of what attracts serious individuals to devote the energy of their life’s work to the investment endeavor. First, and tightly connected to this Series, there must be a body of knowledge. Second, there needs to be some entry requirements such as those required to achieve the CFA credential. Third, there must be a commitment to continuing education. Fourth, a profession must serve a purpose beyond one’s direct selfish interest. In this case, by properly conducting one’s affairs and putting client interests first, the investment xix
  • 27. xx Introduction professional can work as a fair-minded cog in the wheel of the incredibly productive global capital markets. This encourages the citizenry to part with their hard-earned savings to be redeployed in fair and productive pursuit. As C. Stewart Sheppard, founding executive director of the Institute of Chartered Financial Analysts said, ‘‘Society demands more from a profession and its members than it does from a professional craftsman in trade, arts, or business. In return for status, prestige, and autonomy, a profession extends a public warranty that it has established and maintains conditions of entry, standards of fair practice, disciplinary procedures, and continuing education for its particular constituency. Much is expected from members of a profession, but over time, more is given.’’ ‘‘The Standards for Educational and Psychological Testing,’’ put forth by the American Psychological Association, the American Educational Research Association, and the National Council on Measurement in Education, state that the validity of professional credentialing examinations should be demonstrated primarily by verifying that the content of the examina- tion accurately represents professional practice. In addition, a practice analysis study, which confirms the knowledge and skills required for the competent professional, should be the basis
  • 28. for establishing content validity. For more than 40 years, hundreds upon hundreds of practitioners and academics have served on CFA Institute curriculum committees sifting through and winnowing all the many investment concepts and ideas to create a body of knowledge and the CFA curriculum. One of the hallmarks of curriculum development at CFA Institute is its extensive use of practitioners in all phases of the process. CFA Institute has followed a formal practice analysis process since 1995. The effort involves special practice analysis forums held, most recently, at 20 locations around the world. Results of the forums were put forth to 70,000 CFA charterholders for verification and confirmation of the body of knowledge so derived. What this means for the reader is that the concepts contained in these texts were driven by practicing professionals in the field who understand the responsibilities and knowledge that practitioners in the industry need to be successful. We are pleased to put this extensive effort to work for the benefit of the readers of the Investment Series. BENEFITS This series will prove useful both to the new student of capital markets, who is seriously contemplating entry into the extremely competitive field of investment management, and to the more seasoned professional who is looking for a user- friendly way to keep one’s knowledge
  • 29. current. All chapters include extensive references for those who would like to dig deeper into a given concept. The workbooks provide a summary of each chapter’s key points to help organize your thoughts, as well as sample questions and answers to test yourself on your progress. For the new student, the essential concepts that any investment professional needs to master are presented in a time-tested fashion. This material, in addition to university study and reading the financial press, will help you better understand the investment field. I believe that the general public seriously underestimates the disciplined processes needed for the best investment firms and individuals to prosper. These texts lay the basic groundwork for many of the processes that successful firms use. Without this base level of understanding and an appreciation for how the capital markets work to properly price securities, you may not find Introduction xxi competitive success. Furthermore, the concepts herein give a genuine sense of the kind of work that is to be found day to day managing portfolios, doing research, or related endeavors. The investment profession, despite its relatively lucrative compensation, is not for everyone. It takes a special kind of individual to fundamentally understand and absorb the
  • 30. teachings from this body of work and then convert that into application in the practitioner world. In fact, most individuals who enter the field do not survive in the longer run. The aspiring professional should think long and hard about whether this is the field for him or herself. There is no better way to make such a critical decision than to be prepared by reading and evaluating the gospel of the profession. The more experienced professional understands that the nature of the capital markets requires a commitment to continuous learning. Markets evolve as quickly as smart minds can find new ways to create an exposure, to attract capital, or to manage risk. A number of the concepts in these pages were not present a decade or two ago when many of us were starting out in the business. Hedge funds, derivatives, alternative investment concepts, and behavioral finance are examples of new applications and concepts that have altered the capital markets in recent years. As markets invent and reinvent themselves, a best- in-class foundation investment series is of great value. Those of us who have been at this business for a while know that we must continuously hone our skills and knowledge if we are to compete with the young talent that constantly emerges. In fact, as we talk to major employers about their training needs, we are often told that one of the biggest challenges they face is how to help the experienced professional, laboring under heavy time pressure, keep up with the state of the art and the more recently
  • 31. educated associates. This series can be part of that answer. CONVENTIONAL WISDOM It doesn’t take long for the astute investment professional to realize two common characteristics of markets. First, prices are set by conventional wisdom, or a function of the many variables in the market. Truth in markets is, at its essence, what the market believes it is and how it assesses pricing credits or debits on those beliefs. Second, as conventional wisdom is a product of the evolution of general theory and learning, by definition conventional wisdom is often wrong or at the least subject to material change. When I first entered this industry in the mid-1970s, conventional wisdom held that the concepts examined in these texts were a bit too academic to be heavily employed in the competitive marketplace. Many of those considered to be the best investment firms at the time were led by men who had an eclectic style, an intuitive sense of markets, and a great track record. In the rough-and-tumble world of the practitioner, some of these concepts were considered to be of no use. Could conventional wisdom have been more wrong? If so, I’m not sure when. During the years of my tenure in the profession, the practitioner investment management firms that evolved successfully were full of determined, intelligent, intellectually curious investment professionals who endeavored to apply these concepts in a serious and disciplined
  • 32. manner. Today, the best firms are run by those who carefully form investment hypotheses and test them rigorously in the marketplace, whether it be in a quant strategy, in comparative shopping for stocks within an industry, or in many hedge fund strategies. Their goal is to create investment processes that can be replicated with some statistical reliability. I believe xxii Introduction those who embraced the so-called academic side of the learning equation have been much more successful as real-world investment managers. THE TEXTS Approximately 35 percent of the Candidate Body of Knowledge is represented in the initial four texts of the series. Additional texts on corporate finance and international financial statement analysis are in development, and more topics may be forthcoming. One of the most prominent texts over the years in the investment management industry has been Maginn and Tuttle’s Managing Investment Portfolios: A Dynamic Process. The third edition updates key concepts from the 1990 second edition. Some of the more experienced members of our community, like myself, own the prior two editions and will add this to our library. Not only does this tome take the concepts from the other readings and
  • 33. put them in a portfolio context, it also updates the concepts of alternative investments, performance presentation standards, portfolio execution and, very importantly, managing individual investor portfolios. To direct attention, long focused on institutional portfolios, toward the individual will make this edition an important improvement over the past. Quantitative Investment Analysis focuses on some key tools that are needed for today’s professional investor. In addition to classic time value of money, discounted cash flow applications, and probability material, there are two aspects that can be of value over traditional thinking. First are the chapters dealing with correlation and regression that ultimately figure into the formation of hypotheses for purposes of testing. This gets to a critical skill that many professionals are challenged by: the ability to sift out the wheat from the chaff. For most investment researchers and managers, their analysis is not solely the result of newly created data and tests that they perform. Rather, they synthesize and analyze primary research done by others. Without a rigorous manner by which to understand quality research, not only can you not understand good research, you really have no basis by which to evaluate less rigorous research. What is often put forth in the applied world as good quantitative research lacks rigor and validity. Second, the last chapter on portfolio concepts moves the reader
  • 34. beyond the traditional capital asset pricing model (CAPM) type of tools and into the more practical world of multifactor models and to arbitrage pricing theory. Many have felt that there has been a CAPM bias to the work put forth in the past, and this chapter helps move beyond that point. Equity Asset Valuation is a particularly cogent and important read for anyone involved in estimating the value of securities and understanding security pricing. A well-informed professional would know that the common forms of equity valuation — dividend discount modeling, free cash flow modeling, price/earnings models, and residual income models (often known by trade names) — can all be reconciled to one another under certain assumptions. With a deep understanding of the underlying assumptions, the professional investor can better understand what other investors assume when calculating their valuation estimates. In my prior life as the head of an equity investment team, this knowledge would give us an edge over other investors. Fixed Income Analysis has been at the frontier of new concepts in recent years, greatly expanding horizons over the past. This text is probably the one with the most new material for the seasoned professional who is not a fixed-income specialist. The application of option and derivative technology to the once staid province of fixed income has helped contribute to an
  • 35. Introduction xxiii explosion of thought in this area. And not only does that challenge the professional to stay up to speed with credit derivatives, swaptions, collateralized mortgage securities, mortgage backs, and others, but it also puts a strain on the world’s central banks to provide oversight and the risk of a correlated event. Armed with a thorough grasp of the new exposures, the professional investor is much better able to anticipate and understand the challenges our central bankers and markets face. I hope you find this new series helpful in your efforts to grow your investment knowledge, whether you are a relatively new entrant or a grizzled veteran ethically bound to keep up to date in the ever-changing market environment. CFA Institute, as a long-term committed participant of the investment profession and a not-for-profit association, is pleased to give you this opportunity. Jeff Diermeier, CFA President and Chief Executive Officer CFA Institute September 2006 QUANTITATIVE INVESTMENT
  • 36. ANALYSIS CHAPTER 1 THE TIME VALUE OF MONEY 1. INTRODUCTION As individuals, we often face decisions that involve saving money for a future use, or borrowing money for current consumption. We then need to determine the amount we need to invest, if we are saving, or the cost of borrowing, if we are shopping for a loan. As investment analysts, much of our work also involves evaluating transactions with present and future cash flows. When we place a value on any security, for example, we are attempting to determine the worth of a stream of future cash flows. To carry out all the above tasks accurately, we must understand the mathematics of time value of money problems. Money has time value in that individuals value a given amount of money more highly the earlier it is received. Therefore, a smaller amount of money now may be equivalent in value to a larger amount received at a future date. The time value of money as a topic in investment mathematics deals with equivalence relationships between cash flows with different dates. Mastery of time value of
  • 37. money concepts and techniques is essential for investment analysts. The chapter is organized as follows: Section 2 introduces some terminology used through- out the chapter and supplies some economic intuition for the variables we will discuss. Section 3 tackles the problem of determining the worth at a future point in time of an amount invested today. Section 4 addresses the future worth of a series of cash flows. These two sections provide the tools for calculating the equivalent value at a future date of a single cash flow or series of cash flows. Sections 5 and 6 discuss the equivalent value today of a single future cash flow and a series of future cash flows, respectively. In Section 7, we explore how to determine other quantities of interest in time value of money problems. 2. INTEREST RATES: INTERPRETATION In this chapter, we will continually refer to interest rates. In some cases, we assume a particular value for the interest rate; in other cases, the interest rate will be the unknown quantity we seek to determine. Before turning to the mechanics of time value of money problems, we must illustrate the underlying economic concepts. In this section, we briefly explain the meaning and interpretation of interest rates. Time value of money concerns equivalence relationships between cash flows occurring on different dates. The idea of equivalence relationships is relatively simple. Consider the
  • 38. following exchange: You pay $10,000 today and in return receive $9,500 today. Would you 1 2 Quantitative Investment Analysis accept this arrangement? Not likely. But what if you received the $9,500 today and paid the $10,000 one year from now? Can these amounts be considered equivalent? Possibly, because a payment of $10,000 a year from now would probably be worth less to you than a payment of $10,000 today. It would be fair, therefore, to discount the $10,000 received in one year; that is, to cut its value based on how much time passes before the money is paid. An interest rate, denoted r, is a rate of return that reflects the relationship between differently dated cash flows. If $9,500 today and $10,000 in one year are equivalent in value, then $10,000 − $9,500 = $500 is the required compensation for receiving $10,000 in one year rather than now. The interest rate — the required compensation stated as a rate of return — is $500/$9,500 = 0.0526 or 5.26 percent. Interest rates can be thought of in three ways. First, they can be considered required rates of return — that is, the minimum rate of return an investor must receive in order to accept the investment. Second, interest rates can be considered discount rates. In the example above, 5.26 percent is that rate at which we discounted the $10,000 future
  • 39. amount to find its value today. Thus, we use the terms ‘‘interest rate’’ and ‘‘discount rate’’ almost interchangeably. Third, interest rates can be considered opportunity costs. An opportunity cost is the value that investors forgo by choosing a particular course of action. In the example, if the party who sup- plied $9,500 had instead decided to spend it today, he would have forgone earning 5.26 percent on the money. So we can view 5.26 percent as the opportunity cost of current consumption. Economics tells us that interest rates are set in the marketplace by the forces of supply and demand, where investors are suppliers of funds and borrowers are demanders of funds. Taking the perspective of investors in analyzing market- determined interest rates, we can view an interest rate r as being composed of a real risk-free interest rate plus a set of four premiums that are required returns or compensation for bearing distinct types of risk: r = Real risk-free interest rate + Inflation premium + Default risk premium + Liquidity premium + Maturity premium • The real risk-free interest rate is the single-period interest rate for a completely risk-free security if no inflation were expected. In economic theory, the real risk-free rate reflects the time preferences of individuals for current versus future real consumption. • The inflation premium compensates investors for expected inflation and reflects the average
  • 40. inflation rate expected over the maturity of the debt. Inflation reduces the purchasing power of a unit of currency — the amount of goods and services one can buy with it. The sum of the real risk-free interest rate and the inflation premium is the nominal risk-free interest rate.1 Many countries have governmental short-term debt whose interest rate can be considered to represent the nominal risk-free interest rate in that country. The interest rate on a 90-day U.S. Treasury bill (T-bill), for example, represents the nominal risk-free interest rate over that time horizon.2 U.S. T-bills can be bought and sold in large quantities with minimal transaction costs and are backed by the full faith and credit of the U.S. government. 1Technically, 1 plus the nominal rate equals the product of 1 plus the real rate and 1 plus the inflation rate. As a quick approximation, however, the nominal rate is equal to the real rate plus an inflation premium. In this discussion we focus on approximate additive relationships to highlight the underlying concepts. 2Other developed countries issue securities similar to U.S. Treasury bills. The French government issues BTFs or negotiable fixed-rate discount Treasury bills (Bons du Trésor à taux fixe et à intérêts précomptés) with maturities of 3, 6, and 12 months. The Japanese government issues a short-term Treasury bill with maturities of 6 and 12 months. The German government issues at discount both Treasury financing
  • 41. Chapter 1 The Time Value of Money 3 • The default risk premium compensates investors for the possibility that the borrower will fail to make a promised payment at the contracted time and in the contracted amount. • The liquidity premium compensates investors for the risk of loss relative to an investment’s fair value if the investment needs to be converted to cash quickly. U.S. T-bills, for example, do not bear a liquidity premium because large amounts can be bought and sold without affecting their market price. Many bonds of small issuers, by contrast, trade infrequently after they are issued; the interest rate on such bonds includes a liquidity premium reflecting the relatively high costs (including the impact on price) of selling a position. • The maturity premium compensates investors for the increased sensitivity of the market value of debt to a change in market interest rates as maturity is extended, in general (holding all else equal). The difference between the interest rate on longer-maturity, liquid Treasury debt and that on short-term Treasury debt reflects a positive maturity premium for the longer-term debt (and possibly different inflation premiums as well). Using this insight into the economic meaning of interest rates, we now turn to a discussion of solving time value of money problems, starting with the future value of a single cash flow.
  • 42. 3. THE FUTURE VALUE OF A SINGLE CASH FLOW In this section, we introduce time value associated with a single cash flow or lump-sum investment. We describe the relationship between an initial investment or present value (PV), which earns a rate of return (the interest rate per period) denoted as r, and its future value (FV), which will be received N years or periods from today. The following example illustrates this concept. Suppose you invest $100 (PV = $100) in an interest-bearing bank account paying 5 percent annually. At the end of the first year, you will have the $100 plus the interest earned, 0.05× $100 = $5, for a total of $105. To formalize this one-period example, we define the following terms: PV = present value of the investment FVN = future value of the investment N periods from today r = rate of interest per period For N = 1, the expression for the future value of amount PV is FV1 = PV(1 + r) (1-1) For this example, we calculate the future value one year from today as FV1 = $100(1.05) = $105. Now suppose you decide to invest the initial $100 for two years with interest earned and credited to your account annually (annual compounding). At the
  • 43. end of the first year (the paper (Finanzierungsschätze des Bundes or, for short, Schätze) and Treasury discount paper (Bubills) with maturities up to 24 months. In the United Kingdom, the British government issues gilt-edged Treasury bills with maturities ranging from 1 to 364 days. The Canadian government bond market is closely related to the U.S. market; Canadian Treasury bills have maturities of 3, 6, and 12 months. 4 Quantitative Investment Analysis beginning of the second year), your account will have $105, which you will leave in the bank for another year. Thus, with a beginning amount of $105 (PV = $105), the amount at the end of the second year will be $105(1.05) = $110.25. Note that the $5.25 interest earned during the second year is 5 percent of the amount invested at the beginning of Year 2. Another way to understand this example is to note that the amount invested at the beginning of Year 2 is composed of the original $100 that you invested plus the $5 interest earned during the first year. During the second year, the original principal again earns interest, as does the interest that was earned during Year 1. You can see how the original investment grows: Original investment $100.00 Interest for the first year ($100 × 0.05) 5.00
  • 44. Interest for the second year based on original investment ($100 × 0.05) 5.00 Interest for the second year based on interest earned in the first year (0.05× $5.00 interest on interest) 0.25 Total $110.25 The $5 interest that you earned each period on the $100 original investment is known as simple interest (the interest rate times the principal). Principal is the amount of funds originally invested. During the two-year period, you earn $10 of simple interest. The extra $0.25 that you have at the end of Year 2 is the interest you earned on the Year 1 interest of $5 that you reinvested. The interest earned on interest provides the first glimpse of the phenomenon known as compounding. Although the interest earned on the initial investment is important, for a given interest rate it is fixed in size from period to period. The compounded interest earned on reinvested interest is a far more powerful force because, for a given interest rate, it grows in size each period. The importance of compounding increases with the magnitude of the interest rate. For example, $100 invested today would be worth about $13,150 after 100 years if compounded annually at 5 percent, but worth more than $20 million if compounded annually over the same time period at a rate of 13 percent. To verify the $20 million figure, we need a general formula to handle compounding for
  • 45. any number of periods. The following general formula relates the present value of an initial investment to its future value after N periods: FVN = PV(1 + r)N (1-2) where r is the stated interest rate per period and N is the number of compounding periods. In the bank example, FV2 = $100(1 + 0.05)2 = $110.25. In the 13 percent investment example, FV100 = $100(1.13)100 = $20,316,287.42. The most important point to remember about using the future value equation is that the stated interest rate, r, and the number of compounding periods, N , must be compatible. Both variables must be defined in the same time units. For example, if N is stated in months, then r should be the one-month interest rate, unannualized. A time line helps us to keep track of the compatibility of time units and the interest rate per time period. In the time line, we use the time index t to represent a point in time a stated number of periods from today. Thus the present value is the amount available for investment today, indexed as t = 0. We can now refer to a time N periods from today as t = N . The time line in Figure 1-1 shows this relationship. Chapter 1 The Time Value of Money 5 0 1 2 3 ... N − 1 N
  • 46. PV FVN = PV(1 + r) N FIGURE 1-1 The Relationship Between an Initial Investment, PV, and Its Future Value, FV In Figure 1-1, we have positioned the initial investment, PV, at t = 0. Using Equation 1-2, we move the present value, PV, forward to t = N by the factor (1 + r)N . This factor is called a future value factor. We denote the future value on the time line as FV and position it at t = N . Suppose the future value is to be received exactly 10 periods from today’s date (N = 10). The present value, PV, and the future value, FV, are separated in time through the factor (1 + r).10 The fact that the present value and the future value are separated in time has important consequences: • We can add amounts of money only if they are indexed at the same point in time. • For a given interest rate, the future value increases with the number of periods. • For a given number of periods, the future value increases with the interest rate. To better understand these concepts, consider three examples that illustrate how to apply the future value formula. EXAMPLE 1-1 The Future Value of a Lump Sum with Interim Cash Reinvested at the Same Rate
  • 47. You are the lucky winner of your state’s lottery of $5 million after taxes. You invest your winnings in a five-year certificate of deposit (CD) at a local financial institution. The CD promises to pay 7 percent per year compounded annually. This institution also lets you reinvest the interest at that rate for the duration of the CD. How much will you have at the end of five years if your money remains invested at 7 percent for five years with no withdrawals? Solution : To solve this problem, compute the future value of the $5 million investment using the following values in Equation 1-2: PV = $5,000,000 r = 7% = 0.07 N = 5 FVN = PV(1 + r)N
  • 48. = $5,000,000(1.07)5 6 Quantitative Investment Analysis = $5, 000, 000(1.402552) = $7, 012, 758.65 At the end of five years, you will have $7,012,758.65 if your money remains invested at 7 percent with no withdrawals. In this and most examples in this chapter, note that the factors are reported at six decimal places but the calculations may actually reflect greater precision. For example, the reported 1.402552 has been rounded up from 1.40255173 (the calculation is actually carried out with more than eight decimal places of precision by the calculator or spreadsheet). Our final result reflects the higher number of decimal places carried by the calculator or spreadsheet.3
  • 49. EXAMPLE 1-2 The Future Value of a Lump Sum with No Interim Cash An institution offers you the following terms for a contract: For an investment of ¥2,500,000, the institution promises to pay you a lump sum six years from now at an 8 percent annual interest rate. What future amount can you expect?