SlideShare a Scribd company logo
Industrial Engineering Letters www.iiste.org 
ISSN 2224-6096 (Paper) ISSN 2225-0581 (online) 
Vol.4, No.8, 2014 
Quality Life Insurance Service of Jiban Bima Corporation (JBC) 
of Bangladesh: An Empirical Study 
Mohammad A. Ashraf 
Assistant Professor and Head, Department of Economics, United International University (UIU), 80/8A 
Dhanmandi, Dhaka 1209, Bangladesh, Ext. 307 
Email: mashraf@eco.uiu.ac.bd 
Abstract 
The purpose of this paper is to assess customers’ general expectation and perception of insurers in terms of 
services offered at the insurance service counter (ISC). Besides, this paper also examines the relationship 
between the demographic factors and SERVQUAL mean score. The study utilized the survey approach. The 
result shows huge gap for tangible, reliability and responsiveness and shows highest gap between customers’ 
perception and expectation. This result demonstrates tangible as the most critical determinant of SERVQUAL 
measure for service quality. The other dimensions (assurance and empathy) also appear important but tangible 
dominates. Thus, results of this study underscore the need for insurance providers to gear customer services and 
quality improvement efforts towards components of tangible. The study intends to promote a better theoretical 
understanding and recognition of the complexities to service quality and its measurement. The challenge for 
insurance sector in Bangladesh remains the same that is to bring innovative solutions to client while making 
them realize the value of those services provided. When clients realize that quality is something that cannot be 
compromised, an organization has to survive in the competitive market managing high value service. 
Keywords: Service quality, Life Insurance, Customers’ expectation and perception, Customer satisfaction 
INTRODUCTION 
In today’s world of competition, managers are keen to put efforts on maximizing shareholder value as their top 
priority, evidence suggest that shareholders actually do better when firms put the customer first (Martin, 2010). 
Indeed, service quality and customer satisfaction are inarguably the two core concepts that are at the hub of the 
marketing theory and practices. If competition occurs mainly through endogenous quality, we should observe 
that even large markets remain concentrated, while insurance companies provide higher quality in larger markets 
(Dick, 2007). Nowadays, the key to sustainable competitive advantage lies in delivering high quality service that 
will in turn result in satisfied customers. The prominence of these two ideas is further manifested by numerous 
theoretical and empirical studies on the topic that have accelerated over the past few years. It is, therefore, 
important to study the service quality and customer satisfaction which is regarded as the ultimate goals of any 
service producers such as insurance industry (Smith and Chang, 2009; Sureshchandar, Rajendran & 
Anantharaman, 2002; Rice, 2001). 
'Does quality pay' (Greising, 1994)? It is one of the key contemporary issues, which have attracted attention from 
practitioners, policy makers and researchers working in multidisciplinary areas in management. Substantial 
analysis has been devoted to understand the role of quality in the overall performance of a service business right 
from the strategic level down to the implementation details (Mukharjee, Nath & Pal, 2003). Although the 
relationship between service quality and profit has been considered to be neither simple nor straightforward 
(Zahorik & Rust, 1992), a significant body of service-literature has tried to establish the linkage between quality 
and different firm performance parameters (Kaplan & Norton, 1996; Ittner & Larcker, 1998). For example, 
improved service quality and customer satisfaction have been shown to lead to higher productivity (Gupta & 
Zeithaml, 2006; Reicheld & Sasser, 1990), increased loyalty (Smith and Chang, 2009; Morgan & Rego, 2006; 
Gans, 2002; Reichheld, 1996), lower transaction cost (Jacobides, 2008; Bolton, 1998), price-premium (Baicker 
& Chandra, 2008; Anderson, 1996), favorable word-of-mouth (Laczniak, DeCarlo & Ramaswami, 2001; 
Anderson, Fornell & Lehmann, 1994), market share (Fornell, et al., 1996), repurchase intention (Fried, 2005; 
Louro, Pieters & Zeelenberg, 2005; Kordupleski, Rust & Zahorik, 1993), customer retention (Tsoukatos & 
Rand, 2006; Lombardi, 2005), combining product and services (Shankar, Berry & Dotzel, 2009), improved firm 
reputation (Fergusaon, Deephouse & Fergusaon, 2000; Greising, 1994) and maximized profit (Smith and Chang, 
2009). It is, thus, popularly believed that better service leads to improved performance for a service firm. 
Practically, service quality is a very important part for an insurance company (Ahmad and Sungip, 2008). But 
mere observation says that local companies are not very much conscious about it. Government companies are 
less apt on this issue of service quality. Here that’s why the research is being conducted on Government 
Company. According to a study it was found that in this industry the private insurance companies (local plus 
foreign) are dominating (68%) compared to government owned (32%) one in the choice of clients due to the 
62
Industrial Engineering Letters www.iiste.org 
ISSN 2224-6096 (Paper) ISSN 2225-0581 (online) 
Vol.4, No.8, 2014 
small coverage (few branches) and less attractive policy packages offered by the government owned insurance 
companies. (Chowdhury, Rahman and Afza, 2007). 
Again life insurance is more popular in this country. Still people recognize life insurance as the only policy of 
the insurance companies since the positive response of the respondents towards other insurance policies are quite 
smaller compared to life insurance. (Chowdhury et al., 2007). A deeper sight into government life insurance 
company has become an important sector to study now. 
This study is, therefore, undertaken to assess the level of performance of a public life insurance company of 
Jibon (i.e. life) Bima (i.e. insurance) Corporation (JBC) in Bangladesh with respect to service dimension and to 
relate it with customer satisfaction. The methodology used is illustrated with a sample of consumers from the 
Metropolitan City of Dhaka. Such studies will help the JBC and other companies to improve their quality of 
service to the customers, which will enhance their profitability and market share as well. 
LIFE INSURANCE INDUSTRY IN BANGLADESH: AN OVERVIEW 
Insurance is at least as old as Phoenicians (Jewell, 1974). This superb history of classical insurance has also set 
up its footprint long time ago in the business arena of Bengal’s soil which is now named as Bangladesh. 
Factually and interestingly, insurance is, thus, not a new business in this country of South Asia. Centuries back, 
during British rule in India, some insurance companies started transacting business (Mishra, 200…; Gayathri, 
Vinaya & Lakshmisha, 2006), both life and general, in Bengal. However, insurance business gained momentum 
in East Pakistan during 1947-1971, when 49 insurance companies transacted both life and general insurance 
schemes (BBS, 1974). These companies were of various origins British, Australian, Indian, West Pakistani and 
local. After the emergence of the People’s Republic of Bangladesh in 1971, the government, in order to make 
available the fruit of liberation to the general mass, nationalized the insurance industry along with the banks in 
1972 by Presidential Order No. 95 (Debnath, 2003). Following the Order, all companies and organization 
transacting all types of insurance business in Bangladesh came under this nationalized regulation and five 
insurance corporations were initially established by the Government. These were --- (i) Jatiya Bima Corporation 
(National Insurance Corporation), (ii) Teesta Bima Corporation (Teesta Insurance Corporation), (iii) Karnaphuli 
Bima Corporation (Karnaphuli Insurance Corporation), (iv) Rupsa Jiban Bima Corporation (Rupsa Life 
Insurance Corporation) and (v) Surma Jiban Bima Corporation (Surma Life Insurance Corporation). 
The basic idea behind the formation of five corporations was to encourage competition even under a nationalized 
system. Nevertheless, the burden of administrative expenses incurred in maintaining two corporations in each 
front of life and general and an apex institution at the top outweighed the advantages of limited competition. 
Consequently, on 14 May 1973, a restructuring was made under the Insurance Corporations Act 1973. Following 
the Act, in place of five corporations the government formed two insurance companies which were (i) Sadharan 
Bima Corporation (SBC) for general business, and Jiban Bima Corporation (JBC) for life business (Debnath, 
2003). 
Until 1985, JBC was the only institution to handle life insurance business in Bangladesh. Through the Insurance 
(Amendment) Ordinance 1984 and Insurance Corporations (Amendment) Ordinance 1984, the government 
allowed the private sector to establish insurance companies. Up to December 2007, a total of 62 insurance 
companies have been operating in Bangladesh, of which 18 provide life insurance and 44 are in the general 
insurance field which made the life insurance business competitive. The life insurance companies are consisted 
of sixteen (16) national companies and one international company, namely American Life Insurance Company 
(ALICO). Yet, it had little impact on the business performance of the Jiban Bima Corporation (Chowdhury et al., 
2007) 
The corporation (JBC) offers 15 different types of life insurance schemes. These are whole life assurance, 
endowment assurance, child protection policy, children endowment, anticipated endowment assurance, pension 
scheme policy, single payment policy, mortgage protection policy, group term insurance policy, group 
endowment policy, group variable endowment policy, group pension policy, grameen bima policy (rural 
insurance policy), joint life endowment policy, and progressive premium policy. 
A BRIEF LITERATURE REVIEW: SERVICE QUALITY 
In spite of the growing importance of service quality ((Hallberg & Sipos-Zackrisson, 2010), it remains an 
abstract and elusive (Mangin, Dubé & Donderi, 2005) construct that is difficult to define and measure 
(Gummesson, 2008; Chong, Lee & Tan, 1999, Qualls & Rosa, 1995). According to Gummesson (2008), quality 
is a complex concept and regarding in service there is a humanistic quality approach, at the one extreme stressing 
63
Industrial Engineering Letters www.iiste.org 
ISSN 2224-6096 (Paper) ISSN 2225-0581 (online) 
Vol.4, No.8, 2014 
customers, personnel, leadership and culture, whereas at the other end lies a technical approach concerning 
operations management, statistics and methods of measurement. Gummesson divided quality into services, 
tangibles and software, but he stresses the importance of a total service offering. Lehtinen and Lehtinen (1991) 
discussed about physical quality, interactive quality and corporate quality, and, on the other hand, about process 
and output quality. 
Pepur & Pivčević (2009) investigate the concept and the measurement of quality of tourism services. It presents 
results of research conducted with the purpose of determining the guests’ perception of the quality of hotel 
services in the City of Split. The map ‘importance-performance’ is used for two purposes. It reveals which of the 
five elementary dimensions of quality are important for hotel guests and secondly, demonstrate the usefulness 
and relative simplicity of this model for measurement of services quality in the tourism sector. The results not 
only reveal how the hotel guests perceive the quality of services provided but also which dimensions of quality 
they find more or less important. 
Cronemyr & Witell (2010) investigate service improvements in a manufacturing context. The results of the study 
reveal that when moving from a fire-fighting culture to a proactive culture, a company needs to change from a 
product to a process perspective. The benefit of changing from a product to a process perspective is the change 
in focus from reduction of internal costs to value creation through service delivery. This paper shows how 
feedback from dissatisfied customers can be used as a driving factor in process improvements. Based on this 
knowledge, a company can select the most important Six Sigma projects to improve their service processes. The 
change from a product to a process perspective shows that traditionally the severity of almost 50 percent of all 
faults is underestimated. 
Kaluarachchi (2010) endeavors to identify the effect of organizational culture (OC) on the total quality 
management (TQM) practices of a Sri Lankan public sector hospital, which practices Japanese 5-S based TQM 
and has won several national quality awards. The study identified high senior management commitment, high 
staff commitment, high stakeholder focus, high integration of continuous improvement, high quality culture, 
high measurement and feedback, and high learning organization characteristics as TQM practices of the hospital. 
The study found that the supportive culture of the hospital has positively impacted on its TQM practices. 
Sahney, Banwet & Karunes (2010) present the results of an empirical study conducted on the administrative 
staff, so as to obtain the internal customer's perspective on quality. Based on the literature review followed by a 
pilot study and an earlier study based on the quality function deployment technique, certain elements critical to 
quality management in education are identified. Thereafter, the interpretive structural modeling (ISM) technique 
is applied. The study finds that the ISM technique helps prioritize the strategic issues in quality assessment 
qualitatively, so as to propose a hierarchical structure through prioritizing, sequencing, and categorizing of ideas. 
The elements are classified as drivers, enablers and dependents, and the hierarchically structured. 
Lambert (2010) shows that customer relationship management (CRM) is being viewed as a strategic, process-oriented, 
cross-functional, value-creating for buyer and seller, and a means of achieving superior financial 
performance. However, there is a need for a more holistic view of cross-functional as it relates to CRM 
Service quality is not the slippery, mystical, or amorphous concept it is often thought to be. Chowdhury et al. 
(2007) identify that customers will give an institution high mark for its service when it meets or exceeds their 
service desires. The five dimensions of service performance (tangibles, reliability, responsiveness, assurance and 
empathy) give direction to the service quality journey. Although these dimensions will be differently important 
to various market segments, on an overall basis, they all are important. As a group, they frame the essence of the 
service quality mandate to be excellent in service, seek to be excellent in tangibles, reliability, responsiveness, 
assurance and empathy. 
Service quality is generally defined as customer perceived quality which stresses the individual’s assessment of 
the value of the total service offering (Gummesson, 2008). Practically, Gronroos (2009) described promised 
service quality as the difference between expected service quality and experienced service quality. This has a 
link to the gap model (Parasuraman et al., 1985) and other service quality models (e.g. Bitner 1995). On the 
other hand, Berry (1995) divided service quality into two types: regular services, and handling of exceptions or 
problems to ensure that appropriate procedures are taken to deal with inevitable failures. 
As regards to service quality, the individual’s experience of a service forms the basis of an assessment of its 
quality. It is great to listen to customers and study their reactions. When purchasing services, customers’ 
64
Industrial Engineering Letters www.iiste.org 
ISSN 2224-6096 (Paper) ISSN 2225-0581 (online) 
Vol.4, No.8, 2014 
attention is often limited to a small number of tangible inputs (Zeithaml, Parasuraman & Berry, 1988).). Physical 
environment include buildings, offices and interior design affects customer beliefs, attitudes and satisfaction 
Zeithaml and Bitner, 2000), and provides an opportunity to tell the ‘right’ story about a given service (Berry, 
1995). Matters such as how contact personnel addresses, articulates, writes, designs and presents proposals are 
likewise not without meaning (Levitt, 1981, 1986). Making the intangible into tangible is important, because 
customers do not usually know what they are getting until they do not get it (Levitt, 1986). 
As tangible input, the service personnel represent the service, the organization and the marketers in the 
customers’ eyes (Zeithmal and Bitner, 1996). The quality management of personnel includes such things as 
motivating, managing information, training, career planning and recruiting and retaining of right people 
(Normann, 1991; Zeithaml and Britner, 1996). It is true that service business is personnel intensive, meaning that 
quality supplied to the customer is essentially a result of the way personnel perform (Normann, 1991). Schneider 
(1990) showed that both employees and customers will experience more positive outcomes when the 
organization operates with a customer service orientation and management supports it. This may be linked to the 
external service value within the service-profit chain by Heskett et al. (1994), which described employee 
satisfaction as the underlying factor in the formation of customer perceived quality. The other important tangible 
element is service culture, and by participating in the production process, customers influence and even create 
perceived service culture (Lethtinen, 1985). High levels of intangibility call for image building and maintenance 
to attain reliance based on reputation and subjective impressions of the service (Cowell, 1998). In the long run, 
image depends mainly on what the company actually provides, but in the short run, image can be used as a tool 
for the creation of new reality (Normann, 1991). 
In deploring the inadequacy of measurement procedures used in the marketing discipline Jacoby (1978) has 
mentioned that many of measures are developed at the whim of a researcher with a thought given to whether or 
not it is meaningfully related to an explicit conceptual statement of the phenomena or variables in question. In 
most instances, concepts have not been identified, apart from the instrument or procedures used to measure them. 
Other scholars have emphasized the need for scale development to be preceded by, and rooted in, a sound 
conceptual specification of the construct being scaled as well. The conceptual foundation for the SERVQUAL 
scale was derived from the works of handful of researchers who have examined the meaning of service quality 
(Gonroos, 1984; Letinen and Letinen, 1985). The SERVQUAL scale also derived from a comprehensive 
quantitative research study that defined service quality and illuminated the dimensions, along which consumers 
perceive and evaluate service quality (Parasuraman et al., 1985). 
The construct of quality as conceptualized in the service literature and as measured by SERVQUAL, the scale 
that is the focus of this study, involves perceived quality. Perceived quality is the customer’s judgment about an 
entity’s overall excellence or superiority (Zeithaml, 1984). It differs from objective quality (as by Garvin 1988); 
it is a form of attitude related but not equivalent to satisfaction and results from a comparison of expectations 
with perceptions of performance. Parasuraman, Zeithaml and Berry (1996) defined service quality from the 
customer’s view rather than based on internal performance measures. From this perspective, service quality is 
the customer’s perception of the superiority of the service. 
Satisfaction is defined as a customer’s perception of a single service experience, whereas quality is the 
accumulation of the satisfaction for many customers over many service experiences. A quality service provider 
is one that is able to consistently provide a satisfying service experience over a long period of time 
(Sureshchandar et al. 2002). 
CONCEPTUAL FRAMEWORK 
The construct of quality as conceptualized in the services literature and as measured by SERVQUAL, the scale 
that is the focus of this article, involves perceived quality. Perceived quality is the consumer’s judgment about an 
entity’s overall excellence or superiority (Zeithaml 1987; Zeithaml, Parasuraman, and Berry, 1990; Parasuraman, 
Zeithaml and Berry, 1988; Parasuraman, Zeithaml & Berry, 1990). It differs from objective quality (as defined 
by, for example, Garvin 1983); it is a form of attitude, related but not equivalent to satisfaction, and results from 
a comparison of expectations with perceptions of performance. 
In the SERVQUAL instrument, 16 statements measure the performance across these five dimensions, using a 
seven point Likert Scale measuring both customer expectations and perceptions (Gabbie and O'neill, 1996). It is 
important to note that without adequate information on both the quality of services expected and perceptions of 
services received then feedback from customer surveys can be highly misleading from both a policy and an 
65
Industrial Engineering Letters www.iiste.org 
ISSN 2224-6096 (Paper) ISSN 2225-0581 (online) 
Vol.4, No.8, 2014 
operational perspective. In the following, the application of SERVQUAL approach is more specified with an 
example in a catering company. 
Model of Service Quality Gaps 
There are seven major gaps in the service quality concept, which are shown in Figure 1. The model is an 
extension of Parasuraman et al. (1985). According to the following explanation (Luk & Layton, 2002), the three 
important gaps, which are more associated with the external customers, are Gap1, Gap5 and Gap6; since they 
have a direct relationship with customers. 
Gap1: Customers’ expectations versus management perceptions: as a result of the lack of a 
marketing research orientation, inadequate upward communication and too many layers of 
management. 
Gap2: Management perceptions versus service specifications: as a result of inadequate commitment 
to service quality, a perception of unfeasibility, inadequate task standardization and an absence of goal 
setting. 
Gap3: Service specifications versus service delivery: as a result of role ambiguity and conflict, poor 
employee-job fit and poor technology-job fit, inappropriate supervisory control systems, lack of 
perceived control and lack of teamwork. 
Gap4: Service delivery versus external communication: as a result of inadequate horizontal 
communications and propensity to over-promise. 
Gap5: The JBC discrepancy between customer expectations and their perceptions of the service 
delivered: as a result of the influences exerted from the customer side and the shortfalls (gaps) on the 
part of the service provider. In this case, customer expectations are influenced by the extent of personal 
needs, word of mouth recommendation and past service experiences. 
Gap6: The JBC discrepancy between customer expectations and employees’ perceptions: as a 
result of the differences in the understanding of customer expectations by front-line service providers. 
Gap7: The JBC discrepancy between employee’s perceptions and management perceptions: as a 
result of the differences in the understanding of customer expectations between managers and service 
providers. 
The gap model is one of the best received and most heuristically valuable contributions to the services literature 
(Sahney, Banwet & Karunes, 2004). The model identifies seven key JBC discrepancies or gaps relating to 
managerial perceptions of service quality, and tasks associated with service delivery to customers. The first six 
gaps (Gap 1, Gap 2, Gap 3, Gap 4, Gap 6 and Gap 7) are identified as functions of the way in which service is 
delivered, whereas Gap 5 pertains to the customer and as such is considered to be the true measure of service 
quality. The Gap on which the SERVQUAL methodology has influence is Gap 5. 
Exploratory research of Parasuraman, Zeithaml, & Berry (1985) revealed that the criteria used by consumers in 
assessing service quality fit 10 potentially overlapping dimensions. These dimensions were tangibles, reliability, 
responsiveness, communication, credibility, security, competence, courtesy, understanding/knowing the 
customer, and access. These 10 dimensions and their descriptions served as the basic structure of the service-quality 
domain from which items were derived for the SERVQUAL scale. 
66
Industrial Engineering Letters www.iiste.org 
ISSN 2224-6096 (Paper) ISSN 2225-0581 (online) 
Vol.4, No.8, 2014 
Figure 1. Model of service quality gaps 
Source: Adapted from Parasuraman et al. (1985); Luk and Layton (2002) 
METHODOLOGY 
As the purpose of this research project is to determine the significance of five service quality dimensions from 
the customer viewpoints. Service dimensions such as tangibles, reliability, responsiveness, assurance and 
empathy are independent variables and service quality is dependent variable. This research is to identify the gap 
between perceptions and expectations of external customers on service dimensions. 
In the process of collecting data, a questionnaire was developed to ensure that all the information required for 
analysis be obtained. The questionnaire was extensively explained for each of the customers who were 
contacted. A total of 107 customers on the counter inside the Regional Branchs of Jiban Bima Corporation was 
approached to fill up the questionnaire, but only 52 customers attended the survey which excluded 14 
questionnaire for erroneous responses. Hence, the sample size of 38 was finally selected for analyzing the 
findings. Judgment sampling procedure was followed for gathering data for this pilot study 
67
Industrial Engineering Letters www.iiste.org 
ISSN 2224-6096 (Paper) ISSN 2225-0581 (online) 
Vol.4, No.8, 2014 
For analyzing data the statistical software of SPSS 12.0 was used. In addition, it provides a lot of useful 
statistical tools for evaluating data in testing the study hypothesis. Two major statistical analysis tools used in 
this study can be easily calculated which are reliability analysis and descriptive analysis. Frequencies and 
descriptive statistic (mean and percentage) were used to explore information about the distributions of variables. 
To find the service quality gap, mean of each of the variables dimensions between perception and expectation 
were compared and analyzed. 
Table 1: Result of reliability analysis for five variables 
Dimensions No. of Attributes Chronbach's Alpha 
68 
Expectations Perceptions 
Tangibles 3 .699 
.680 
Reliability 4 .530 
.715 
Responsiveness 3 .464 
.382 
Assurance 3 .582 
.770 
Empathy 3 .605 
.719 
Source: Field Survey 
In determining the reliability of the instruments, the Cronbach’s Alpha was used to measure reliability of the 
underlying variables of. tangible, reliability, responsiveness, assurance and empathy. The Cronbach’s Alpha 
estimates indicate how highly the items in the questionnaire are interrelated in order to determine reliability of 
the instrument (Hayes, 1998). When the Alpha is more than 0.50 indicated as highly reliable (Nunnally, 1978). 
In this study, 32 items were tested on its reliability. Table 1 shows the component and total reliabilities of 
SERVQUAL scores. The findings show that the reliability coefficients for all dimensions are around 0.70 
excluding some few exceptions. 
DATA ANALYSIS AND RESULTS INTERPRETATIONS 
Profile of Respondents 
The profiles of the respondents are shown in the Table 2. The profiles focus on the demographic and economic 
status of the respondents. From the table, it shows that out of 38 respondents, 78.9% of the respondents are male 
and only 21.1% are female. The highest education level attained by most of the respondents was Higher 
Secondary School (HSC) level (39.5%), followed by degree/ honors’ (26.3%) and SSC or below (21.1%). It 
shows that majority of respondents were educated with medium to low qualifications. In term of household 
income, more than half of the respondents earned less than BDT 10,000. 
Table 2: Profile of Respondents 
Characteristics Frequency Percentage 
Gender 
Male 30 78.9 
Female 8 21.1 
Level of 
Education 
SSC or below 8 21.1 
HSC 15 39.5 
Degree/ Honors’ 10 26.3 
Masters/PhD 5 13.2 
Income in 
BDT 
Below 5000 5 13.2 
5000-10000 21 55.3 
10001-20000 9 23.7 
20001-30000 2 5.3 
30001 and above 1 2.6 
Source: Field Survey 
The Perception and Expectation Gap on Tangibles 
Table 3 illustrates the mean score of attributes in tangible dimension in term of perception and expectation. In 
term of expectation, attribute 3 or ‘employees appear neat’ scores lowest gap and attribute 1 and 2, ‘physical 
facilities’ and ‘equipments’ show higher gaps. The attribute 3 scores highest on perception and all the attributes 
have more or less equal score on expectation. So attributes 1 and 2 requires more attention and shows more 
scopes for development.
Industrial Engineering Letters www.iiste.org 
ISSN 2224-6096 (Paper) ISSN 2225-0581 (online) 
Vol.4, No.8, 2014 
Table 3: Means of Perception and Expectation on Tangibles. 
Attributes 
69 
Customers’ 
Perception 
Customers’ 
Expectation 
Gap 
1. Up-to-date equipment 2.63 5.61 -2.98 
2. Visually appealing physical facilities 2.45 5.39 -2.94 
3. Employees well dressed and appear neat 4.34 5.95 -1.61 
Total for Tangibles 3.14 5.65 -2.51 
Source: Field Survey 
The Perception and Expectation Gap on Reliability 
As shown in table 4, the highest score on expectation is for attribute 5 or ‘dependability’ and the lowest is for 
attribute 6 or ‘timeliness’ which refer to ability to fulfil promises in a timely manner. So it may infer from here 
that people in Bangladesh do not mind waiting longer for services. In terms of perception, again attribute 5 
scores highest and attribute 6 lowest. Again interestingly the gap is lowest for ‘dependability’, which can be 
considered most crucial attribute according to expectation. Here the highest strength for JBC can be observed. 
The risk free nature of the government can be one of the biggest reasons behind it. But more interestingly 
‘timeliness’ shows the highest gap. So, though people expect less timeliness, they find lesser timeliness here. 
Table 4: Means of Perception and Expectation on Reliability 
Attributes 
Customers’ 
Perception 
Customers’ 
Expectation 
Gap 
4. Sympathy and reassurance on problems 5.00 6.74 -1.74 
5. Dependability 6.39 6.87 -0.48 
6. Timeliness 4.63 6.55 -1.92 
7. Keeping of records accurately 4.87 6.63 -1.76 
Total for Reliability 5.22 6.70 -1.48 
Source: Field Survey 
The Perception and Expectation Gap on Responsiveness 
As illustrated in Table 5, attribute 8 or ‘Promptness of service’ scored highest on both expectation and 
perception and again shows the lowest gap. So, one can conclude that JBC is apt in the most essential attribute 
for its responsiveness. The huge gap on attribute 10 between perception and expectation denotes that though JBC 
employees are said to be prompt, but it’s true only when they are not busy. During busy hours employees can be 
said reluctant to give extra effort for getting customer satisfaction. 
Table 5: Means of Perception and Expectation on Responsiveness. 
Attributes Customers’ Perception Customers’ Expectation Gap 
8. Promptness of service 4.82 6.08 -1.26 
9. Willingness to help customers 3.82 5.42 -1.6 
10. Responding to customer requests 
promptly during busyness. 
3.55 5.37 -1.82 
Total for Responsiveness 4.06 5.62 -1.56 
Source: Field Survey 
The Perception and Expectation Gap on Assurance 
Table 6 illustrates the mean scores of five attributes selected under assurance dimension in term of perception 
and expectation. Here smaller gaps exist between perception and expectation. The highest gap is on attribute 11 
which is ‘trustworthiness of employees’. Trustworthiness has been considered important because the transactions 
deal with money. The customers need employees who are honest and skilled to handle their transactions. 
Table 6: Means of Perception and Expectation on Assurance. 
Attributes Customers’ Perception 
Customers’ 
Expectation 
Gap 
11. Trustworthiness of employees 5.34 6.66 -1.32 
12. Feeling safe on transactions 5.74 6.71 -0.97 
13. Politeness of employees 5.00 5.87 -0.87 
Total for Assurance 5.36 6.41 -1.05 
Source: Field Survey
Industrial Engineering Letters www.iiste.org 
ISSN 2224-6096 (Paper) ISSN 2225-0581 (online) 
Vol.4, No.8, 2014 
The Perception and Expectation Gap on Empathy 
Table 7 shows the most exceptional scenario, customers’ perception exceeds their expectation in attribute 16 or 
‘Operating hours convenient to all the customers’. This is not impractical as they do not expect very much from 
this attribute but JBC has satisfied them to a greater scale. In attribute 15 or ‘Knowing the needs of the 
customers’ there exists highest expectation and at the same time highest gap. So the customers are thinking that 
the company does not understand exactly what their requirement is. 
Table 7: Means of Perception and Expectation on Empathy. 
Attributes 
70 
Customers’ 
Perception 
Customers’ 
Expectation 
Gap 
14. Individual attention toward customers 3.68 3.71 -0.03 
15. Knowing the needs of the customers 3.97 5.13 -1.16 
16. Operating hours convenient to all the customers 4.76 3.74 +1.02 
Total for Empathy 4.14 4.20 -0.06 
Source: Field Survey 
The service quality gap for empathy dimension indicates small gap between customers’ perception and 
expectation, remember that expectation was also the lowest. It means that empathy perceived by the customers 
are about to meet customers’ expectation. Interestingly tangibles show the highest gap (-2.51) which means that 
the service quality emerged from physical appearance is poorest of all the dimensions. 
Table 6: Means of Perception and Expectation on Five Dimensions. 
Dimensions Customers’ Perception Customers’ Expectation Gap 
Tangibles 3.14 5.65 -2.51 
Reliability 5.22 6.70 -1.48 
Responsiveness 4.06 5.62 -1.56 
Assurance 5.36 6.41 -1.05 
Empathy 4.14 4.20 -0.06 
Source: Field Survey 
The result obviously shows mentionable gap for reliability and responsiveness too. This research illustrates 
tangibles, reliability and responsiveness as the most critical determinant of SERVQUAL measure for service 
quality. The other dimensions (assurance and empathy) appear important but those are dominating. Thus, results 
of this study underscore the need for insurance providers to gear customer service and quality improvement 
efforts towards components of tangibles, reliability and responsiveness. 
Conclusions and Recommendations 
A focused overview of the service quality of JBC can be understood from this study. The research results suggest 
a need to better understand how the customers’ perception and expectation for service quality differ and how 
these affect customer satisfaction (refer to table 6). The satisfaction is derived from the comparison of 
customers’ perception and expectation as mentioned earlier in literature reviews. According to Parasuraman et al 
(1990), satisfaction equals to perception minus expectation. When the perception were poor on service and the 
expectation on the service quality were high, customers were deemed to be dissatisfied with quality of service 
given or provided by the JBC. 
Reliability scores highest on expectation (6.70) and responsiveness scores highest in perception (5.36). It means 
that customers consider reliability most essential whereas the actual service quality performs responsiveness 
onward. The tangibles scores lowest on perception (3.14) whereas empathy scores lowest on expectation (4.20). 
It is clear that customers’ perceived quality for tangibles of JBC is low, and empathy can be considered as least 
expected service performance by the very customers of JBC. 
There is a statistical link between employee behavior and customer satisfaction. These facts are beginning to 
resonate with insurance companies, who are investing in customer relationship management and self-technologies 
designed to build customer loyalty and customer centricity. Whether the ‘customer’ is defined as 
the selling agent, the group benefits manager or the policyholder, the customer service is quickly becoming the 
critical channel for proactive marketing, sales and customer retention as well a service. 
Today’s fiercely competitive environment means that players in the insurance industry are looking for revenue 
momentum, improved profitability and increased customer retention. All three of those goals depend greatly on 
the customer experience: the customer service counter representatives as part of the customer service centre’s 
daily operations. Customers expect to be able to reach their insurance company at any time, by phone, online or
Industrial Engineering Letters www.iiste.org 
ISSN 2224-6096 (Paper) ISSN 2225-0581 (online) 
Vol.4, No.8, 2014 
face-to-face. Customers expect complete, consistent, accurate answers to their entire question, whether they are 
inquiring about the status of claim or the cost of new insurance. 
The insurance industry is beginning to realize the importance of building an excellent customer experience. 
Service improvement is supporting a strong trend in which many insurance companies are adopting a customer 
focus versus a product focus. As a result, insurers are investing heavily in customer relation management (CRM) 
and customer interaction software. Superior service quality on basic customer-service transactions provides a 
competitive edge for insurers. It is necessary, therefore, to insure that employees are well prepared, 
knowledgeable and have superior skills to meet customer expectations. 
The need for striving for service quality lies in its ability to result in economic success. In the modern, highly 
competitive business world, the key to winning new clients, retaining current customers, and sustainable 
competitive advantage lies in delivering high quality service that will, in turn, lead to satisfied customers. 
Customer satisfaction is considered a prerequisite of customer retention and loyalty, and obviously helps in 
realizing economic goals like profitability, market share, return on investment (ROI), etc. Insurers that failed in 
satisfying customers will have a more difficult time convincing customers to come back. Companies that 
distinguish themselves by creating customer satisfaction will reap the rewards of repeat business while those that 
don’t will have to spend time and money luring new customers. However, building a customer-focused 
organization takes time, money and commitment from the highest ranks of both business-side and technology 
executives. Since the globalization of financial institutions is encouraged by the government and the increasing 
international competitive markets especially in the insurance market, consumers in this region have a wide range 
of choices in order to make decision. 
Top management in the insurance sector should realize that the industry is moving towards a dramatic era. In this 
ever-changing competitive market, insurance companies have to use their efforts expand their market in facing 
their competitors. The insurance companies, who can take their employees from their current skills level to 
where they need to be fast to deliver a consistent and quality customer experience, will enjoy a significant 
competitive advantage and will be in a position to break away from their competition. It is not sufficient for JBC 
employee to casually learn and gain knowledge. To survive and win, they must do it purposefully, do it fast and 
do it continuously. They have to read the customers and paint the most pleasant picture for them. 
REFERENCES 
Anderson, E. W. (1996). Customer Satisfaction and Price Tolerance. Marketing Letter 7 (3): 265 -274. 
Anderson, E. W., Fornell, C. & Lehmann, D. R. (1994). Customer Satisfaction, Market Share, and Profitability: 
Findings from Sweden. Journal of Marketing, 58 (3): 53-66. 
Baicker, K. & Chandra, A. (2008). The Labor Market Effects of Rising Health Insurance Premiums. Journal of 
71 
Labor, 24(3): 609 – 634. 
Berry, L. L. (1995). Relationship marketing of services – growing interest, emerging perspectives. Journal of the 
Academy of Marketing Science, 23(4): 236-45. 
Bitner, M. J. (1995). Building service relationships: it’s all about promises. Journal of the Academy of Marketing 
Science 23(4): 246-51. 
Bolton, R. N. (1998). A Dynamic Model of the Duration of the Customers' Relationship with a Continuous 
Service Provider: The Role of Satisfaction. Marketing Science, 17(1): 45-65. 
Chong, C., Lee J. & Tan, L. P. (1999). Applying Systems Thinking to a Strategic Simulation of Service Quality. 
Research Paper, National University of Singapore, Singapore. 
Chowdhury, T. A., Rahman, M. I. & Afza, S. R. (2007). Perceptions of the Consumers towards Insurance 
Companies in Bangladesh --- A Study Based on the SERVQUAL Model. BRAC University Journal, 4(2): 
55 -66. 
Cronemyr, P. & Witell, L. (2010). Changing from a Product to a Process Perspective for Service Improvements 
in a Manufacturing Company. TQM Journal, 22(1): 26. 
Curry, A. (1999), "Innovation in public service management", Managing Service Quality, 9(3): 180-190. 
Dick, A. A. (2007). Market Size, Service Quality and Competition in Banking. Journal of Money, Credit and 
Banking, 39(1): 49-81. 
Fergusaon, T. D., Deephouse, D. L. & Fergusaon, W. L. (2000). Do Strategic Groups Differ in Reputation? 
Strategic Management Journal, 21(12): 1195 – 1214. 
Fornell, C. et al. (1996). The American Customer Satisfaction Index: Nature, Purpose and Findings. Journal of 
Marketing, 60: 7-18. 
Fried, J. M. (2005). Informed Trading and False Signaling with Open Market Repurchases. California Law 
Review, 93(5): 1323-1386.
Industrial Engineering Letters www.iiste.org 
ISSN 2224-6096 (Paper) ISSN 2225-0581 (online) 
Vol.4, No.8, 2014 
Gabbie, O. & O'Neill, M. A. (1996). SERVQUAL and the Northern Ireland Hotel Sector: A Comparative 
Analysis – Part 1, Managing Service Quality, 6(6): 25-32. 
Gans, N. (2002). Customer Loyalty and Supplier Quality Competition. Management Science, 48(2): 207 – 221. 
Gayathri, H., Vinaya, M. C. & Lakshmisha, K. (2006). A Pilot Study on the Service Quality of Insurance 
Companies. Journal of Services Research, 5(2): 123 – 138. 
Greising, D. (1994). Quality-How to Make It Pay, Business Week, August 8: 54-59. 
Gummesson, E. (2008). Quality, Service –Dominant Logic and Many-to-Many Marketing. The TQM Journal, 
72 
20(2): 143 – 153. 
Garvin, D. A. (1983). Quality on the Line. Harvard Business Review, 61 (September-October), 
65-73. 
Gupta, S. & Zeithaml, V. A. (2006). Customer Metrics and Their Impact on Financial Performance. Marketing 
Science, 25(6): 718 -739. 
Hayes, B. E. (1998). Measuring Customer Satisfaction. Milwaukee: ASQ Quality Press. 
Ittner, C. D. & Larcker, D. F. (1998). Are Nonfinancial Measures Leading Indicators of Financial Performance? 
An Analysis of Customer Satisfaction. Journal of Accounting Research 36(1): 1-33. 
Jacobides, M. G. (2008). How Capability Differences, Transaction Costs and Learning Curves Interact to Shape 
Vertical Scope. Organization Science, 19(25): 306 – 326. 
Kaplan, R. S. & Norton, D. P. (1996). The Balanced Scorecard. Boston: Harvard University Press. 
Kaluarachchi, K.A.S.P. (2010). Organizational Culture and Total Quality Management Practices: A Sri Lankan 
Case. The TQM Journal, 22 (1): 41-55. 
Kordupleski, R. E., Rust, R. T. & Zahorik, A. J. (1993). Why Improving Quality Doesn't Improve Quality (Or 
Whatever Happened to Marketing?). California Management Review 35 (3): 82-95. 
Lehtinen, U. & Lehtinen, J. R. (1991). Two Approaches to Service Quality Dimensions. The Service Industries 
Journal, 11(3): 287-303. 
Levitt, T. (1981), “Marketing intangible products and product intangibles”, Harvard Business Review, 59(May- 
June): 94-102. 
Levitt, T. (1986). The Marketing Imagination. New York: The Free Press. 
Lombardi, L. J. (2005). The Importance of Client Retention. LIMRA’s MarketFacts Quarterly, 24 (2): 31-32. 
Louro, J., Pieters, R. & Zeelenberg, M. (2005). Negative Returns on Positive Emotions: The Influence of Pride 
and Self-Regulatory Goals on Repurchase Decisions. The Journal of Consumer Research, 31(4): 833 – 
840. 
Luk, S.T.K. & Layton, R. (2002), "Perception Gaps in customer expectations: Managers versus 
service providers and customers", The Service Industries Journal , Vol.22, No.2, April, pp. 109-128. 
Mangin, P. J., Dubé, M. & Donderi, D. C. (2005). Fundamental Questions on Print Quality. A Research Paper 
done jointly by CIPP, Université du Québec à Trois-Rivières, Quebec and Department of Psychology, 
McGill University, Montreal, Quebec, Canada. 
Martin, R. (2010). The Age of Customer Capitalism. Harvard Business Review, 88(1): 58 – 65. 
Morgan, N. A. & Rego, L. L. (2006). The Value of Different Customer Satisfaction and Loyalty Metrics in 
Producing Business Performance, Marketing Science, 25(5): 426 -439. 
Mukherjee, A., Nath, P. & Pal, N. (2003). Resource, Service Quality and Performance Triad: A Framework for 
Measuring Efficiency of Banking Services. Journal of the Operational Research Society, 54 (7): 723-735. 
Nunnally, J. L. (1978). Psychometric Theory. New York: McGraw-Hill. 
Parasuraman, A, Zeithaml, V. A & Berry, L. L. (1988). SERVQUAL : A Multiple Item Scale for Measuring 
Consumer Perceptions of Service Quality, Journal of Retailing, Spring, pp. 12-40. 
Parasuraman, A, Zeithaml, V. A, & Berry, L. L. (1990) Delivering Quality Service: Balancing Consumer 
Perceptions and Expectations. New York: The Free Press. 
Parasuraman, A., Zeithaml, V. A. and Berry, L. L. (1985). A Conceptual Model of Service Quality and its 
Implications for Further Research. Journal of Marketing, 49(4), 41-50 
Pepur, M. & Pivčević, S. (2009). The concept and measurement of service quality in the hotel sector: the case of 
Split, Croatia. International Journal of Leisure and Tourism Marketing, 1(1): 44 -57 
Qualls, W. J. and Rosa, J. A. (1995). Assessing Industrial Buyers' Perception of Quality and Their effects on 
Satisfaction, Industrial Marketing Management, 24, 359-369. 
Reichheld, F. (1996). Learning from Customer Defections. Harvard Business Review 74: 56-69. 
Reicheld, F. & Sasser, Jr. W. E. (1990). Zero Defections: Quality Comes to Services. Harvard Business Review, 
68: 105-111. 
Rice, E. (2001). The Future of the Insurance Market --- Do Insurers Need Crystal Balls? Balance Sheet, 9(1): 14 
-16. 
Sekaran, U. (2000). Research Methods for Business, 3rd edition, New York: John Wiley & Sons Inc. 
Sahney, S., Banwet, D. K. & Karunes, S. (2010). Quality Framework in Education through Application of
Industrial Engineering Letters www.iiste.org 
ISSN 2224-6096 (Paper) ISSN 2225-0581 (online) 
Vol.4, No.8, 2014 
Interpretive Structural Modeling: An Administrative Staff Perspective in the Indian Context. The TQM 
Journal, 22(1): 56-71. 
Sahney, S., Banwet, D. K., & Karunes, S. (2004). A SERVQUAL and QFD Approach to Total Quality 
Education: A Student Perspective. International Journal of Productivity and Performance Management, 
53(2): 143-166. 
Shankar, V. Berry, L. L. & Dotzel, T. (2009). A Practical Guide to Combining Products and Services. Harvard 
73 
Business Review, (Novemebr): 95 – 99. 
Smith, M. & Chang, C. (2009). The Impact of Customer-Related Strategies on Shareholder Value: Evidence 
from Taiwan. Asian Review Accounting, 17(3): 247 – 268. 
Sureshchandar, G. S., Rajendran, C. & Anantharaman, R. N. (2002). The Relationship between Service Quality 
and Customer Satisfaction ---- A Factor Specific Approach. Journal of Service Marketing, 16(4): 363 – 
379. 
Tsoukatos, E. & Rand, G. K. (2006). Path Analysis of Perceived Service Quality, Satisfaction and Loyalty in 
Greek Insurance. Managing Service Quality, 16(5): 501-519. 
Van Iwaarden, J., van der Wiele, T., Ball, L., & Millen, R. (2003). Applying SERVQUAL to Websites: An 
Exploratory Study. International Journal of Quality & Reliability Management , 20(8): 919-935. 
Zahorik, A. J. & Rust, R. T. (1992). Modeling the Impact of Service Quality on Profitability: A Review. In: 
Terry, S. (ed). Advances in Service Quality and Management, Vol. 1. JAI: Greenwich, CT, pp 247-276. 
Zeithaml, V. A., Parasuraman, A. & Berry, L. L. (1988). Communication and Control Processes in the Delivery 
of Service Quality. Journal of Marketing, 64(April): 35-49. 
Zeithaml, V. A. (1987). Defining and Relating Price, Perceived Quality, and Perceived Value, Report No. 87- 
101, Cambridge, MA: Marketing Science Institute.
The IISTE is a pioneer in the Open-Access hosting service and academic event 
management. The aim of the firm is Accelerating Global Knowledge Sharing. 
More information about the firm can be found on the homepage: 
http://www.iiste.org 
CALL FOR JOURNAL PAPERS 
There are more than 30 peer-reviewed academic journals hosted under the hosting 
platform. 
Prospective authors of journals can find the submission instruction on the 
following page: http://www.iiste.org/journals/ All the journals articles are available 
online to the readers all over the world without financial, legal, or technical barriers 
other than those inseparable from gaining access to the internet itself. Paper version 
of the journals is also available upon request of readers and authors. 
MORE RESOURCES 
Book publication information: http://www.iiste.org/book/ 
IISTE Knowledge Sharing Partners 
EBSCO, Index Copernicus, Ulrich's Periodicals Directory, JournalTOCS, PKP Open 
Archives Harvester, Bielefeld Academic Search Engine, Elektronische 
Zeitschriftenbibliothek EZB, Open J-Gate, OCLC WorldCat, Universe Digtial 
Library , NewJour, Google Scholar

More Related Content

What's hot

Aditya birla health insurance company
Aditya birla health insurance companyAditya birla health insurance company
Aditya birla health insurance company
Easypolicy
 
PRESENTATION ABOUT STATE LIFE
PRESENTATION ABOUT  STATE LIFE PRESENTATION ABOUT  STATE LIFE
PRESENTATION ABOUT STATE LIFE Arif Arain
 
present status of insurance sector in Bangladesh
present status of insurance sector in Bangladesh present status of insurance sector in Bangladesh
present status of insurance sector in Bangladesh
MohiuddinShuvo2
 
Insurance sector of bangladesh assignment
Insurance sector of bangladesh assignmentInsurance sector of bangladesh assignment
Insurance sector of bangladesh assignment
SabbirAhamed39
 
Internship Report on EFU Life Assuarance ltd.
Internship Report on EFU Life Assuarance ltd.Internship Report on EFU Life Assuarance ltd.
Internship Report on EFU Life Assuarance ltd.
Wish Mrt'xa
 
Insurance Presentation by muhammad ullah
Insurance Presentation by muhammad ullahInsurance Presentation by muhammad ullah
Insurance Presentation by muhammad ullahmuhammadullah58
 
State Life's Internship Report-2016
State Life's Internship Report-2016State Life's Internship Report-2016
State Life's Internship Report-2016
Seetal Daas
 
Presentation on Birla Sun Life Insurance
Presentation on Birla Sun Life InsurancePresentation on Birla Sun Life Insurance
Presentation on Birla Sun Life Insurance
New Delhi Institute of Management
 
Bajaj Allianz life Insurance Company
Bajaj Allianz life Insurance CompanyBajaj Allianz life Insurance Company
Bajaj Allianz life Insurance Company
Geetanjali Rani
 
0601044 icici prudential life insurance
0601044 icici prudential life insurance0601044 icici prudential life insurance
0601044 icici prudential life insurance
Supa Buoy
 
ppt on Aditya birla capita
ppt on Aditya birla capitappt on Aditya birla capita
ppt on Aditya birla capita
SUDHAKAR BEHERA
 
Presentation of efu
Presentation of efuPresentation of efu
Presentation of efuStudent
 
Jubilee insurance celebrates 75 years
Jubilee insurance celebrates 75 yearsJubilee insurance celebrates 75 years
Jubilee insurance celebrates 75 yearsJubilee Kenya
 
A study on customer satisfaction of life insurance policies
A study on customer satisfaction of life insurance policiesA study on customer satisfaction of life insurance policies
A study on customer satisfaction of life insurance policiesAnnamumumu
 
LIST OF 24 LIFE INSURANCE COMPANIES IN INDIA- BRIEF DETAILS
LIST OF 24 LIFE INSURANCE COMPANIES IN INDIA- BRIEF DETAILSLIST OF 24 LIFE INSURANCE COMPANIES IN INDIA- BRIEF DETAILS
LIST OF 24 LIFE INSURANCE COMPANIES IN INDIA- BRIEF DETAILS
Venu Gopaal
 
Aditya Birla Sun life Insurance (ABSLI) Sip presentation on Thechnical and Fu...
Aditya Birla Sun life Insurance (ABSLI) Sip presentation on Thechnical and Fu...Aditya Birla Sun life Insurance (ABSLI) Sip presentation on Thechnical and Fu...
Aditya Birla Sun life Insurance (ABSLI) Sip presentation on Thechnical and Fu...
SoumyaKatiyar
 
Designing training program for max new york life
Designing training program for max new york lifeDesigning training program for max new york life
Designing training program for max new york lifeTanuj Poddar
 
Overall of Pioneer insurance company limited (insurance assignment)
Overall of Pioneer insurance company limited (insurance assignment)Overall of Pioneer insurance company limited (insurance assignment)
Overall of Pioneer insurance company limited (insurance assignment)
Niloy Saha
 
Bajaj allianz- Survey
Bajaj allianz- SurveyBajaj allianz- Survey
Bajaj allianz- Survey__mitra90
 

What's hot (20)

Aditya birla health insurance company
Aditya birla health insurance companyAditya birla health insurance company
Aditya birla health insurance company
 
PRESENTATION ABOUT STATE LIFE
PRESENTATION ABOUT  STATE LIFE PRESENTATION ABOUT  STATE LIFE
PRESENTATION ABOUT STATE LIFE
 
present status of insurance sector in Bangladesh
present status of insurance sector in Bangladesh present status of insurance sector in Bangladesh
present status of insurance sector in Bangladesh
 
Insurance sector of bangladesh assignment
Insurance sector of bangladesh assignmentInsurance sector of bangladesh assignment
Insurance sector of bangladesh assignment
 
Internship Report on EFU Life Assuarance ltd.
Internship Report on EFU Life Assuarance ltd.Internship Report on EFU Life Assuarance ltd.
Internship Report on EFU Life Assuarance ltd.
 
Insurance Presentation by muhammad ullah
Insurance Presentation by muhammad ullahInsurance Presentation by muhammad ullah
Insurance Presentation by muhammad ullah
 
State Life's Internship Report-2016
State Life's Internship Report-2016State Life's Internship Report-2016
State Life's Internship Report-2016
 
Presentation on Birla Sun Life Insurance
Presentation on Birla Sun Life InsurancePresentation on Birla Sun Life Insurance
Presentation on Birla Sun Life Insurance
 
Bajaj Allianz life Insurance Company
Bajaj Allianz life Insurance CompanyBajaj Allianz life Insurance Company
Bajaj Allianz life Insurance Company
 
0601044 icici prudential life insurance
0601044 icici prudential life insurance0601044 icici prudential life insurance
0601044 icici prudential life insurance
 
ppt on Aditya birla capita
ppt on Aditya birla capitappt on Aditya birla capita
ppt on Aditya birla capita
 
Presentation of efu
Presentation of efuPresentation of efu
Presentation of efu
 
Jubilee insurance celebrates 75 years
Jubilee insurance celebrates 75 yearsJubilee insurance celebrates 75 years
Jubilee insurance celebrates 75 years
 
insurance
 insurance insurance
insurance
 
A study on customer satisfaction of life insurance policies
A study on customer satisfaction of life insurance policiesA study on customer satisfaction of life insurance policies
A study on customer satisfaction of life insurance policies
 
LIST OF 24 LIFE INSURANCE COMPANIES IN INDIA- BRIEF DETAILS
LIST OF 24 LIFE INSURANCE COMPANIES IN INDIA- BRIEF DETAILSLIST OF 24 LIFE INSURANCE COMPANIES IN INDIA- BRIEF DETAILS
LIST OF 24 LIFE INSURANCE COMPANIES IN INDIA- BRIEF DETAILS
 
Aditya Birla Sun life Insurance (ABSLI) Sip presentation on Thechnical and Fu...
Aditya Birla Sun life Insurance (ABSLI) Sip presentation on Thechnical and Fu...Aditya Birla Sun life Insurance (ABSLI) Sip presentation on Thechnical and Fu...
Aditya Birla Sun life Insurance (ABSLI) Sip presentation on Thechnical and Fu...
 
Designing training program for max new york life
Designing training program for max new york lifeDesigning training program for max new york life
Designing training program for max new york life
 
Overall of Pioneer insurance company limited (insurance assignment)
Overall of Pioneer insurance company limited (insurance assignment)Overall of Pioneer insurance company limited (insurance assignment)
Overall of Pioneer insurance company limited (insurance assignment)
 
Bajaj allianz- Survey
Bajaj allianz- SurveyBajaj allianz- Survey
Bajaj allianz- Survey
 

Similar to Quality life insurance service of jiban bima corporation (jbc) of bangladesh

A Study on Claim Settlement amid Life Insurance Segment In India
A Study on Claim Settlement amid Life Insurance Segment In India A Study on Claim Settlement amid Life Insurance Segment In India
A Study on Claim Settlement amid Life Insurance Segment In India
RohitSatote3
 
11.service quality assessment in insurance sector a comparative study between...
11.service quality assessment in insurance sector a comparative study between...11.service quality assessment in insurance sector a comparative study between...
11.service quality assessment in insurance sector a comparative study between...Alexander Decker
 
1.[1 17]service quality assessment in insurance sector a comparative study be...
1.[1 17]service quality assessment in insurance sector a comparative study be...1.[1 17]service quality assessment in insurance sector a comparative study be...
1.[1 17]service quality assessment in insurance sector a comparative study be...
Alexander Decker
 
1.[1 17]service quality assessment in insurance sector a comparative study be...
1.[1 17]service quality assessment in insurance sector a comparative study be...1.[1 17]service quality assessment in insurance sector a comparative study be...
1.[1 17]service quality assessment in insurance sector a comparative study be...
Alexander Decker
 
ANALYSIS OF GROWTH OF LIFE INSURANCE INDUSTRY IN INDIA A COMPARATIVE STUDY ...
ANALYSIS OF GROWTH OF LIFE INSURANCE INDUSTRY IN INDIA   A COMPARATIVE STUDY ...ANALYSIS OF GROWTH OF LIFE INSURANCE INDUSTRY IN INDIA   A COMPARATIVE STUDY ...
ANALYSIS OF GROWTH OF LIFE INSURANCE INDUSTRY IN INDIA A COMPARATIVE STUDY ...
Rhonda Cetnar
 
Policyholders Satisfaction of Life Insurance Products with Reference to Coimb...
Policyholders Satisfaction of Life Insurance Products with Reference to Coimb...Policyholders Satisfaction of Life Insurance Products with Reference to Coimb...
Policyholders Satisfaction of Life Insurance Products with Reference to Coimb...
inventionjournals
 
Study of Investors’ Preference for the Selection of an Insurance Product
Study of Investors’ Preference for the Selection of an Insurance ProductStudy of Investors’ Preference for the Selection of an Insurance Product
Study of Investors’ Preference for the Selection of an Insurance Product
Dr. Amarjeet Singh
 
Roja project
Roja projectRoja project
Roja project
MilankumarJain
 
Impact of service quality on customer satisfaction in life insurance companie...
Impact of service quality on customer satisfaction in life insurance companie...Impact of service quality on customer satisfaction in life insurance companie...
Impact of service quality on customer satisfaction in life insurance companie...
Quang Toan Ton
 
Recitation of Public and Private Sector General Insurance Industry in Structu...
Recitation of Public and Private Sector General Insurance Industry in Structu...Recitation of Public and Private Sector General Insurance Industry in Structu...
Recitation of Public and Private Sector General Insurance Industry in Structu...
Vivekanandha College of arts and Science for Women (Autonomous)
 
Recitation of Public and Private Sector General Insurance Industry in Structu...
Recitation of Public and Private Sector General Insurance Industry in Structu...Recitation of Public and Private Sector General Insurance Industry in Structu...
Recitation of Public and Private Sector General Insurance Industry in Structu...
Vivekanandha College of arts and Science for Women (Autonomous)
 
3. determinants of profitability
3. determinants of profitability3. determinants of profitability
3. determinants of profitability
izbalraza
 
“A STUDY OF THE IMPACT OF LIBERALIZATION ON THE INDIAN LIFE INSURANCE INDUSTRY”
“A STUDY OF THE IMPACT OF LIBERALIZATION ON THE INDIAN LIFE INSURANCE INDUSTRY”“A STUDY OF THE IMPACT OF LIBERALIZATION ON THE INDIAN LIFE INSURANCE INDUSTRY”
“A STUDY OF THE IMPACT OF LIBERALIZATION ON THE INDIAN LIFE INSURANCE INDUSTRY”
Somnath Pagar
 
IDBI Federal Comparative study with LIC
IDBI Federal Comparative study with LICIDBI Federal Comparative study with LIC
IDBI Federal Comparative study with LIC
Neha Arya
 
CII-EY Insurance Report - Insurer of the Future 2016
CII-EY Insurance Report - Insurer of the Future 2016CII-EY Insurance Report - Insurer of the Future 2016
CII-EY Insurance Report - Insurer of the Future 2016
Confederation of Indian Industry
 
A Study Of Comparative Analysis Between LIC And HDFC Life Insurance Companies
A Study Of Comparative Analysis Between LIC And HDFC Life Insurance CompaniesA Study Of Comparative Analysis Between LIC And HDFC Life Insurance Companies
A Study Of Comparative Analysis Between LIC And HDFC Life Insurance Companies
Natasha Grant
 
A STUDY ON MERGER AND ACQUISITION IN INSURANCE INDUSTRY IN INDIA
A STUDY ON MERGER AND ACQUISITION IN INSURANCE INDUSTRY IN INDIAA STUDY ON MERGER AND ACQUISITION IN INSURANCE INDUSTRY IN INDIA
A STUDY ON MERGER AND ACQUISITION IN INSURANCE INDUSTRY IN INDIA
Nat Rice
 
IDBI Federal Comparative study with LIC
IDBI Federal Comparative study with LICIDBI Federal Comparative study with LIC
IDBI Federal Comparative study with LIC
Neha Arya
 
E0342042047
E0342042047E0342042047
E0342042047
inventionjournals
 
Idbi federal sushnato imt
Idbi federal sushnato imtIdbi federal sushnato imt
Idbi federal sushnato imt
Sushnato Dutta
 

Similar to Quality life insurance service of jiban bima corporation (jbc) of bangladesh (20)

A Study on Claim Settlement amid Life Insurance Segment In India
A Study on Claim Settlement amid Life Insurance Segment In India A Study on Claim Settlement amid Life Insurance Segment In India
A Study on Claim Settlement amid Life Insurance Segment In India
 
11.service quality assessment in insurance sector a comparative study between...
11.service quality assessment in insurance sector a comparative study between...11.service quality assessment in insurance sector a comparative study between...
11.service quality assessment in insurance sector a comparative study between...
 
1.[1 17]service quality assessment in insurance sector a comparative study be...
1.[1 17]service quality assessment in insurance sector a comparative study be...1.[1 17]service quality assessment in insurance sector a comparative study be...
1.[1 17]service quality assessment in insurance sector a comparative study be...
 
1.[1 17]service quality assessment in insurance sector a comparative study be...
1.[1 17]service quality assessment in insurance sector a comparative study be...1.[1 17]service quality assessment in insurance sector a comparative study be...
1.[1 17]service quality assessment in insurance sector a comparative study be...
 
ANALYSIS OF GROWTH OF LIFE INSURANCE INDUSTRY IN INDIA A COMPARATIVE STUDY ...
ANALYSIS OF GROWTH OF LIFE INSURANCE INDUSTRY IN INDIA   A COMPARATIVE STUDY ...ANALYSIS OF GROWTH OF LIFE INSURANCE INDUSTRY IN INDIA   A COMPARATIVE STUDY ...
ANALYSIS OF GROWTH OF LIFE INSURANCE INDUSTRY IN INDIA A COMPARATIVE STUDY ...
 
Policyholders Satisfaction of Life Insurance Products with Reference to Coimb...
Policyholders Satisfaction of Life Insurance Products with Reference to Coimb...Policyholders Satisfaction of Life Insurance Products with Reference to Coimb...
Policyholders Satisfaction of Life Insurance Products with Reference to Coimb...
 
Study of Investors’ Preference for the Selection of an Insurance Product
Study of Investors’ Preference for the Selection of an Insurance ProductStudy of Investors’ Preference for the Selection of an Insurance Product
Study of Investors’ Preference for the Selection of an Insurance Product
 
Roja project
Roja projectRoja project
Roja project
 
Impact of service quality on customer satisfaction in life insurance companie...
Impact of service quality on customer satisfaction in life insurance companie...Impact of service quality on customer satisfaction in life insurance companie...
Impact of service quality on customer satisfaction in life insurance companie...
 
Recitation of Public and Private Sector General Insurance Industry in Structu...
Recitation of Public and Private Sector General Insurance Industry in Structu...Recitation of Public and Private Sector General Insurance Industry in Structu...
Recitation of Public and Private Sector General Insurance Industry in Structu...
 
Recitation of Public and Private Sector General Insurance Industry in Structu...
Recitation of Public and Private Sector General Insurance Industry in Structu...Recitation of Public and Private Sector General Insurance Industry in Structu...
Recitation of Public and Private Sector General Insurance Industry in Structu...
 
3. determinants of profitability
3. determinants of profitability3. determinants of profitability
3. determinants of profitability
 
“A STUDY OF THE IMPACT OF LIBERALIZATION ON THE INDIAN LIFE INSURANCE INDUSTRY”
“A STUDY OF THE IMPACT OF LIBERALIZATION ON THE INDIAN LIFE INSURANCE INDUSTRY”“A STUDY OF THE IMPACT OF LIBERALIZATION ON THE INDIAN LIFE INSURANCE INDUSTRY”
“A STUDY OF THE IMPACT OF LIBERALIZATION ON THE INDIAN LIFE INSURANCE INDUSTRY”
 
IDBI Federal Comparative study with LIC
IDBI Federal Comparative study with LICIDBI Federal Comparative study with LIC
IDBI Federal Comparative study with LIC
 
CII-EY Insurance Report - Insurer of the Future 2016
CII-EY Insurance Report - Insurer of the Future 2016CII-EY Insurance Report - Insurer of the Future 2016
CII-EY Insurance Report - Insurer of the Future 2016
 
A Study Of Comparative Analysis Between LIC And HDFC Life Insurance Companies
A Study Of Comparative Analysis Between LIC And HDFC Life Insurance CompaniesA Study Of Comparative Analysis Between LIC And HDFC Life Insurance Companies
A Study Of Comparative Analysis Between LIC And HDFC Life Insurance Companies
 
A STUDY ON MERGER AND ACQUISITION IN INSURANCE INDUSTRY IN INDIA
A STUDY ON MERGER AND ACQUISITION IN INSURANCE INDUSTRY IN INDIAA STUDY ON MERGER AND ACQUISITION IN INSURANCE INDUSTRY IN INDIA
A STUDY ON MERGER AND ACQUISITION IN INSURANCE INDUSTRY IN INDIA
 
IDBI Federal Comparative study with LIC
IDBI Federal Comparative study with LICIDBI Federal Comparative study with LIC
IDBI Federal Comparative study with LIC
 
E0342042047
E0342042047E0342042047
E0342042047
 
Idbi federal sushnato imt
Idbi federal sushnato imtIdbi federal sushnato imt
Idbi federal sushnato imt
 

More from Alexander Decker

Abnormalities of hormones and inflammatory cytokines in women affected with p...
Abnormalities of hormones and inflammatory cytokines in women affected with p...Abnormalities of hormones and inflammatory cytokines in women affected with p...
Abnormalities of hormones and inflammatory cytokines in women affected with p...Alexander Decker
 
A validation of the adverse childhood experiences scale in
A validation of the adverse childhood experiences scale inA validation of the adverse childhood experiences scale in
A validation of the adverse childhood experiences scale in
Alexander Decker
 
A usability evaluation framework for b2 c e commerce websites
A usability evaluation framework for b2 c e commerce websitesA usability evaluation framework for b2 c e commerce websites
A usability evaluation framework for b2 c e commerce websitesAlexander Decker
 
A universal model for managing the marketing executives in nigerian banks
A universal model for managing the marketing executives in nigerian banksA universal model for managing the marketing executives in nigerian banks
A universal model for managing the marketing executives in nigerian banksAlexander Decker
 
A unique common fixed point theorems in generalized d
A unique common fixed point theorems in generalized dA unique common fixed point theorems in generalized d
A unique common fixed point theorems in generalized dAlexander Decker
 
A trends of salmonella and antibiotic resistance
A trends of salmonella and antibiotic resistanceA trends of salmonella and antibiotic resistance
A trends of salmonella and antibiotic resistanceAlexander Decker
 
A transformational generative approach towards understanding al-istifham
A transformational  generative approach towards understanding al-istifhamA transformational  generative approach towards understanding al-istifham
A transformational generative approach towards understanding al-istifhamAlexander Decker
 
A time series analysis of the determinants of savings in namibia
A time series analysis of the determinants of savings in namibiaA time series analysis of the determinants of savings in namibia
A time series analysis of the determinants of savings in namibiaAlexander Decker
 
A therapy for physical and mental fitness of school children
A therapy for physical and mental fitness of school childrenA therapy for physical and mental fitness of school children
A therapy for physical and mental fitness of school childrenAlexander Decker
 
A theory of efficiency for managing the marketing executives in nigerian banks
A theory of efficiency for managing the marketing executives in nigerian banksA theory of efficiency for managing the marketing executives in nigerian banks
A theory of efficiency for managing the marketing executives in nigerian banksAlexander Decker
 
A systematic evaluation of link budget for
A systematic evaluation of link budget forA systematic evaluation of link budget for
A systematic evaluation of link budget forAlexander Decker
 
A synthetic review of contraceptive supplies in punjab
A synthetic review of contraceptive supplies in punjabA synthetic review of contraceptive supplies in punjab
A synthetic review of contraceptive supplies in punjabAlexander Decker
 
A synthesis of taylor’s and fayol’s management approaches for managing market...
A synthesis of taylor’s and fayol’s management approaches for managing market...A synthesis of taylor’s and fayol’s management approaches for managing market...
A synthesis of taylor’s and fayol’s management approaches for managing market...Alexander Decker
 
A survey paper on sequence pattern mining with incremental
A survey paper on sequence pattern mining with incrementalA survey paper on sequence pattern mining with incremental
A survey paper on sequence pattern mining with incrementalAlexander Decker
 
A survey on live virtual machine migrations and its techniques
A survey on live virtual machine migrations and its techniquesA survey on live virtual machine migrations and its techniques
A survey on live virtual machine migrations and its techniquesAlexander Decker
 
A survey on data mining and analysis in hadoop and mongo db
A survey on data mining and analysis in hadoop and mongo dbA survey on data mining and analysis in hadoop and mongo db
A survey on data mining and analysis in hadoop and mongo dbAlexander Decker
 
A survey on challenges to the media cloud
A survey on challenges to the media cloudA survey on challenges to the media cloud
A survey on challenges to the media cloudAlexander Decker
 
A survey of provenance leveraged
A survey of provenance leveragedA survey of provenance leveraged
A survey of provenance leveragedAlexander Decker
 
A survey of private equity investments in kenya
A survey of private equity investments in kenyaA survey of private equity investments in kenya
A survey of private equity investments in kenyaAlexander Decker
 
A study to measures the financial health of
A study to measures the financial health ofA study to measures the financial health of
A study to measures the financial health ofAlexander Decker
 

More from Alexander Decker (20)

Abnormalities of hormones and inflammatory cytokines in women affected with p...
Abnormalities of hormones and inflammatory cytokines in women affected with p...Abnormalities of hormones and inflammatory cytokines in women affected with p...
Abnormalities of hormones and inflammatory cytokines in women affected with p...
 
A validation of the adverse childhood experiences scale in
A validation of the adverse childhood experiences scale inA validation of the adverse childhood experiences scale in
A validation of the adverse childhood experiences scale in
 
A usability evaluation framework for b2 c e commerce websites
A usability evaluation framework for b2 c e commerce websitesA usability evaluation framework for b2 c e commerce websites
A usability evaluation framework for b2 c e commerce websites
 
A universal model for managing the marketing executives in nigerian banks
A universal model for managing the marketing executives in nigerian banksA universal model for managing the marketing executives in nigerian banks
A universal model for managing the marketing executives in nigerian banks
 
A unique common fixed point theorems in generalized d
A unique common fixed point theorems in generalized dA unique common fixed point theorems in generalized d
A unique common fixed point theorems in generalized d
 
A trends of salmonella and antibiotic resistance
A trends of salmonella and antibiotic resistanceA trends of salmonella and antibiotic resistance
A trends of salmonella and antibiotic resistance
 
A transformational generative approach towards understanding al-istifham
A transformational  generative approach towards understanding al-istifhamA transformational  generative approach towards understanding al-istifham
A transformational generative approach towards understanding al-istifham
 
A time series analysis of the determinants of savings in namibia
A time series analysis of the determinants of savings in namibiaA time series analysis of the determinants of savings in namibia
A time series analysis of the determinants of savings in namibia
 
A therapy for physical and mental fitness of school children
A therapy for physical and mental fitness of school childrenA therapy for physical and mental fitness of school children
A therapy for physical and mental fitness of school children
 
A theory of efficiency for managing the marketing executives in nigerian banks
A theory of efficiency for managing the marketing executives in nigerian banksA theory of efficiency for managing the marketing executives in nigerian banks
A theory of efficiency for managing the marketing executives in nigerian banks
 
A systematic evaluation of link budget for
A systematic evaluation of link budget forA systematic evaluation of link budget for
A systematic evaluation of link budget for
 
A synthetic review of contraceptive supplies in punjab
A synthetic review of contraceptive supplies in punjabA synthetic review of contraceptive supplies in punjab
A synthetic review of contraceptive supplies in punjab
 
A synthesis of taylor’s and fayol’s management approaches for managing market...
A synthesis of taylor’s and fayol’s management approaches for managing market...A synthesis of taylor’s and fayol’s management approaches for managing market...
A synthesis of taylor’s and fayol’s management approaches for managing market...
 
A survey paper on sequence pattern mining with incremental
A survey paper on sequence pattern mining with incrementalA survey paper on sequence pattern mining with incremental
A survey paper on sequence pattern mining with incremental
 
A survey on live virtual machine migrations and its techniques
A survey on live virtual machine migrations and its techniquesA survey on live virtual machine migrations and its techniques
A survey on live virtual machine migrations and its techniques
 
A survey on data mining and analysis in hadoop and mongo db
A survey on data mining and analysis in hadoop and mongo dbA survey on data mining and analysis in hadoop and mongo db
A survey on data mining and analysis in hadoop and mongo db
 
A survey on challenges to the media cloud
A survey on challenges to the media cloudA survey on challenges to the media cloud
A survey on challenges to the media cloud
 
A survey of provenance leveraged
A survey of provenance leveragedA survey of provenance leveraged
A survey of provenance leveraged
 
A survey of private equity investments in kenya
A survey of private equity investments in kenyaA survey of private equity investments in kenya
A survey of private equity investments in kenya
 
A study to measures the financial health of
A study to measures the financial health ofA study to measures the financial health of
A study to measures the financial health of
 

Recently uploaded

The-McKinsey-7S-Framework. strategic management
The-McKinsey-7S-Framework. strategic managementThe-McKinsey-7S-Framework. strategic management
The-McKinsey-7S-Framework. strategic management
Bojamma2
 
Project File Report BBA 6th semester.pdf
Project File Report BBA 6th semester.pdfProject File Report BBA 6th semester.pdf
Project File Report BBA 6th semester.pdf
RajPriye
 
What are the main advantages of using HR recruiter services.pdf
What are the main advantages of using HR recruiter services.pdfWhat are the main advantages of using HR recruiter services.pdf
What are the main advantages of using HR recruiter services.pdf
HumanResourceDimensi1
 
anas about venice for grade 6f about venice
anas about venice for grade 6f about veniceanas about venice for grade 6f about venice
anas about venice for grade 6f about venice
anasabutalha2013
 
The Influence of Marketing Strategy and Market Competition on Business Perfor...
The Influence of Marketing Strategy and Market Competition on Business Perfor...The Influence of Marketing Strategy and Market Competition on Business Perfor...
The Influence of Marketing Strategy and Market Competition on Business Perfor...
Adam Smith
 
falcon-invoice-discounting-a-premier-platform-for-investors-in-india
falcon-invoice-discounting-a-premier-platform-for-investors-in-indiafalcon-invoice-discounting-a-premier-platform-for-investors-in-india
falcon-invoice-discounting-a-premier-platform-for-investors-in-india
Falcon Invoice Discounting
 
Tata Group Dials Taiwan for Its Chipmaking Ambition in Gujarat’s Dholera
Tata Group Dials Taiwan for Its Chipmaking Ambition in Gujarat’s DholeraTata Group Dials Taiwan for Its Chipmaking Ambition in Gujarat’s Dholera
Tata Group Dials Taiwan for Its Chipmaking Ambition in Gujarat’s Dholera
Avirahi City Dholera
 
Premium MEAN Stack Development Solutions for Modern Businesses
Premium MEAN Stack Development Solutions for Modern BusinessesPremium MEAN Stack Development Solutions for Modern Businesses
Premium MEAN Stack Development Solutions for Modern Businesses
SynapseIndia
 
April 2024 Nostalgia Products Newsletter
April 2024 Nostalgia Products NewsletterApril 2024 Nostalgia Products Newsletter
April 2024 Nostalgia Products Newsletter
NathanBaughman3
 
FINAL PRESENTATION.pptx12143241324134134
FINAL PRESENTATION.pptx12143241324134134FINAL PRESENTATION.pptx12143241324134134
FINAL PRESENTATION.pptx12143241324134134
LR1709MUSIC
 
Memorandum Of Association Constitution of Company.ppt
Memorandum Of Association Constitution of Company.pptMemorandum Of Association Constitution of Company.ppt
Memorandum Of Association Constitution of Company.ppt
seri bangash
 
VAT Registration Outlined In UAE: Benefits and Requirements
VAT Registration Outlined In UAE: Benefits and RequirementsVAT Registration Outlined In UAE: Benefits and Requirements
VAT Registration Outlined In UAE: Benefits and Requirements
uae taxgpt
 
Skye Residences | Extended Stay Residences Near Toronto Airport
Skye Residences | Extended Stay Residences Near Toronto AirportSkye Residences | Extended Stay Residences Near Toronto Airport
Skye Residences | Extended Stay Residences Near Toronto Airport
marketingjdass
 
ikea_woodgreen_petscharity_dog-alogue_digital.pdf
ikea_woodgreen_petscharity_dog-alogue_digital.pdfikea_woodgreen_petscharity_dog-alogue_digital.pdf
ikea_woodgreen_petscharity_dog-alogue_digital.pdf
agatadrynko
 
5 Things You Need To Know Before Hiring a Videographer
5 Things You Need To Know Before Hiring a Videographer5 Things You Need To Know Before Hiring a Videographer
5 Things You Need To Know Before Hiring a Videographer
ofm712785
 
amptalk_RecruitingDeck_english_2024.06.05
amptalk_RecruitingDeck_english_2024.06.05amptalk_RecruitingDeck_english_2024.06.05
amptalk_RecruitingDeck_english_2024.06.05
marketing317746
 
Exploring Patterns of Connection with Social Dreaming
Exploring Patterns of Connection with Social DreamingExploring Patterns of Connection with Social Dreaming
Exploring Patterns of Connection with Social Dreaming
Nicola Wreford-Howard
 
ENTREPRENEURSHIP TRAINING.ppt for graduating class (1).ppt
ENTREPRENEURSHIP TRAINING.ppt for graduating class (1).pptENTREPRENEURSHIP TRAINING.ppt for graduating class (1).ppt
ENTREPRENEURSHIP TRAINING.ppt for graduating class (1).ppt
zechu97
 
Affordable Stationery Printing Services in Jaipur | Navpack n Print
Affordable Stationery Printing Services in Jaipur | Navpack n PrintAffordable Stationery Printing Services in Jaipur | Navpack n Print
Affordable Stationery Printing Services in Jaipur | Navpack n Print
Navpack & Print
 
Maksym Vyshnivetskyi: PMO Quality Management (UA)
Maksym Vyshnivetskyi: PMO Quality Management (UA)Maksym Vyshnivetskyi: PMO Quality Management (UA)
Maksym Vyshnivetskyi: PMO Quality Management (UA)
Lviv Startup Club
 

Recently uploaded (20)

The-McKinsey-7S-Framework. strategic management
The-McKinsey-7S-Framework. strategic managementThe-McKinsey-7S-Framework. strategic management
The-McKinsey-7S-Framework. strategic management
 
Project File Report BBA 6th semester.pdf
Project File Report BBA 6th semester.pdfProject File Report BBA 6th semester.pdf
Project File Report BBA 6th semester.pdf
 
What are the main advantages of using HR recruiter services.pdf
What are the main advantages of using HR recruiter services.pdfWhat are the main advantages of using HR recruiter services.pdf
What are the main advantages of using HR recruiter services.pdf
 
anas about venice for grade 6f about venice
anas about venice for grade 6f about veniceanas about venice for grade 6f about venice
anas about venice for grade 6f about venice
 
The Influence of Marketing Strategy and Market Competition on Business Perfor...
The Influence of Marketing Strategy and Market Competition on Business Perfor...The Influence of Marketing Strategy and Market Competition on Business Perfor...
The Influence of Marketing Strategy and Market Competition on Business Perfor...
 
falcon-invoice-discounting-a-premier-platform-for-investors-in-india
falcon-invoice-discounting-a-premier-platform-for-investors-in-indiafalcon-invoice-discounting-a-premier-platform-for-investors-in-india
falcon-invoice-discounting-a-premier-platform-for-investors-in-india
 
Tata Group Dials Taiwan for Its Chipmaking Ambition in Gujarat’s Dholera
Tata Group Dials Taiwan for Its Chipmaking Ambition in Gujarat’s DholeraTata Group Dials Taiwan for Its Chipmaking Ambition in Gujarat’s Dholera
Tata Group Dials Taiwan for Its Chipmaking Ambition in Gujarat’s Dholera
 
Premium MEAN Stack Development Solutions for Modern Businesses
Premium MEAN Stack Development Solutions for Modern BusinessesPremium MEAN Stack Development Solutions for Modern Businesses
Premium MEAN Stack Development Solutions for Modern Businesses
 
April 2024 Nostalgia Products Newsletter
April 2024 Nostalgia Products NewsletterApril 2024 Nostalgia Products Newsletter
April 2024 Nostalgia Products Newsletter
 
FINAL PRESENTATION.pptx12143241324134134
FINAL PRESENTATION.pptx12143241324134134FINAL PRESENTATION.pptx12143241324134134
FINAL PRESENTATION.pptx12143241324134134
 
Memorandum Of Association Constitution of Company.ppt
Memorandum Of Association Constitution of Company.pptMemorandum Of Association Constitution of Company.ppt
Memorandum Of Association Constitution of Company.ppt
 
VAT Registration Outlined In UAE: Benefits and Requirements
VAT Registration Outlined In UAE: Benefits and RequirementsVAT Registration Outlined In UAE: Benefits and Requirements
VAT Registration Outlined In UAE: Benefits and Requirements
 
Skye Residences | Extended Stay Residences Near Toronto Airport
Skye Residences | Extended Stay Residences Near Toronto AirportSkye Residences | Extended Stay Residences Near Toronto Airport
Skye Residences | Extended Stay Residences Near Toronto Airport
 
ikea_woodgreen_petscharity_dog-alogue_digital.pdf
ikea_woodgreen_petscharity_dog-alogue_digital.pdfikea_woodgreen_petscharity_dog-alogue_digital.pdf
ikea_woodgreen_petscharity_dog-alogue_digital.pdf
 
5 Things You Need To Know Before Hiring a Videographer
5 Things You Need To Know Before Hiring a Videographer5 Things You Need To Know Before Hiring a Videographer
5 Things You Need To Know Before Hiring a Videographer
 
amptalk_RecruitingDeck_english_2024.06.05
amptalk_RecruitingDeck_english_2024.06.05amptalk_RecruitingDeck_english_2024.06.05
amptalk_RecruitingDeck_english_2024.06.05
 
Exploring Patterns of Connection with Social Dreaming
Exploring Patterns of Connection with Social DreamingExploring Patterns of Connection with Social Dreaming
Exploring Patterns of Connection with Social Dreaming
 
ENTREPRENEURSHIP TRAINING.ppt for graduating class (1).ppt
ENTREPRENEURSHIP TRAINING.ppt for graduating class (1).pptENTREPRENEURSHIP TRAINING.ppt for graduating class (1).ppt
ENTREPRENEURSHIP TRAINING.ppt for graduating class (1).ppt
 
Affordable Stationery Printing Services in Jaipur | Navpack n Print
Affordable Stationery Printing Services in Jaipur | Navpack n PrintAffordable Stationery Printing Services in Jaipur | Navpack n Print
Affordable Stationery Printing Services in Jaipur | Navpack n Print
 
Maksym Vyshnivetskyi: PMO Quality Management (UA)
Maksym Vyshnivetskyi: PMO Quality Management (UA)Maksym Vyshnivetskyi: PMO Quality Management (UA)
Maksym Vyshnivetskyi: PMO Quality Management (UA)
 

Quality life insurance service of jiban bima corporation (jbc) of bangladesh

  • 1. Industrial Engineering Letters www.iiste.org ISSN 2224-6096 (Paper) ISSN 2225-0581 (online) Vol.4, No.8, 2014 Quality Life Insurance Service of Jiban Bima Corporation (JBC) of Bangladesh: An Empirical Study Mohammad A. Ashraf Assistant Professor and Head, Department of Economics, United International University (UIU), 80/8A Dhanmandi, Dhaka 1209, Bangladesh, Ext. 307 Email: mashraf@eco.uiu.ac.bd Abstract The purpose of this paper is to assess customers’ general expectation and perception of insurers in terms of services offered at the insurance service counter (ISC). Besides, this paper also examines the relationship between the demographic factors and SERVQUAL mean score. The study utilized the survey approach. The result shows huge gap for tangible, reliability and responsiveness and shows highest gap between customers’ perception and expectation. This result demonstrates tangible as the most critical determinant of SERVQUAL measure for service quality. The other dimensions (assurance and empathy) also appear important but tangible dominates. Thus, results of this study underscore the need for insurance providers to gear customer services and quality improvement efforts towards components of tangible. The study intends to promote a better theoretical understanding and recognition of the complexities to service quality and its measurement. The challenge for insurance sector in Bangladesh remains the same that is to bring innovative solutions to client while making them realize the value of those services provided. When clients realize that quality is something that cannot be compromised, an organization has to survive in the competitive market managing high value service. Keywords: Service quality, Life Insurance, Customers’ expectation and perception, Customer satisfaction INTRODUCTION In today’s world of competition, managers are keen to put efforts on maximizing shareholder value as their top priority, evidence suggest that shareholders actually do better when firms put the customer first (Martin, 2010). Indeed, service quality and customer satisfaction are inarguably the two core concepts that are at the hub of the marketing theory and practices. If competition occurs mainly through endogenous quality, we should observe that even large markets remain concentrated, while insurance companies provide higher quality in larger markets (Dick, 2007). Nowadays, the key to sustainable competitive advantage lies in delivering high quality service that will in turn result in satisfied customers. The prominence of these two ideas is further manifested by numerous theoretical and empirical studies on the topic that have accelerated over the past few years. It is, therefore, important to study the service quality and customer satisfaction which is regarded as the ultimate goals of any service producers such as insurance industry (Smith and Chang, 2009; Sureshchandar, Rajendran & Anantharaman, 2002; Rice, 2001). 'Does quality pay' (Greising, 1994)? It is one of the key contemporary issues, which have attracted attention from practitioners, policy makers and researchers working in multidisciplinary areas in management. Substantial analysis has been devoted to understand the role of quality in the overall performance of a service business right from the strategic level down to the implementation details (Mukharjee, Nath & Pal, 2003). Although the relationship between service quality and profit has been considered to be neither simple nor straightforward (Zahorik & Rust, 1992), a significant body of service-literature has tried to establish the linkage between quality and different firm performance parameters (Kaplan & Norton, 1996; Ittner & Larcker, 1998). For example, improved service quality and customer satisfaction have been shown to lead to higher productivity (Gupta & Zeithaml, 2006; Reicheld & Sasser, 1990), increased loyalty (Smith and Chang, 2009; Morgan & Rego, 2006; Gans, 2002; Reichheld, 1996), lower transaction cost (Jacobides, 2008; Bolton, 1998), price-premium (Baicker & Chandra, 2008; Anderson, 1996), favorable word-of-mouth (Laczniak, DeCarlo & Ramaswami, 2001; Anderson, Fornell & Lehmann, 1994), market share (Fornell, et al., 1996), repurchase intention (Fried, 2005; Louro, Pieters & Zeelenberg, 2005; Kordupleski, Rust & Zahorik, 1993), customer retention (Tsoukatos & Rand, 2006; Lombardi, 2005), combining product and services (Shankar, Berry & Dotzel, 2009), improved firm reputation (Fergusaon, Deephouse & Fergusaon, 2000; Greising, 1994) and maximized profit (Smith and Chang, 2009). It is, thus, popularly believed that better service leads to improved performance for a service firm. Practically, service quality is a very important part for an insurance company (Ahmad and Sungip, 2008). But mere observation says that local companies are not very much conscious about it. Government companies are less apt on this issue of service quality. Here that’s why the research is being conducted on Government Company. According to a study it was found that in this industry the private insurance companies (local plus foreign) are dominating (68%) compared to government owned (32%) one in the choice of clients due to the 62
  • 2. Industrial Engineering Letters www.iiste.org ISSN 2224-6096 (Paper) ISSN 2225-0581 (online) Vol.4, No.8, 2014 small coverage (few branches) and less attractive policy packages offered by the government owned insurance companies. (Chowdhury, Rahman and Afza, 2007). Again life insurance is more popular in this country. Still people recognize life insurance as the only policy of the insurance companies since the positive response of the respondents towards other insurance policies are quite smaller compared to life insurance. (Chowdhury et al., 2007). A deeper sight into government life insurance company has become an important sector to study now. This study is, therefore, undertaken to assess the level of performance of a public life insurance company of Jibon (i.e. life) Bima (i.e. insurance) Corporation (JBC) in Bangladesh with respect to service dimension and to relate it with customer satisfaction. The methodology used is illustrated with a sample of consumers from the Metropolitan City of Dhaka. Such studies will help the JBC and other companies to improve their quality of service to the customers, which will enhance their profitability and market share as well. LIFE INSURANCE INDUSTRY IN BANGLADESH: AN OVERVIEW Insurance is at least as old as Phoenicians (Jewell, 1974). This superb history of classical insurance has also set up its footprint long time ago in the business arena of Bengal’s soil which is now named as Bangladesh. Factually and interestingly, insurance is, thus, not a new business in this country of South Asia. Centuries back, during British rule in India, some insurance companies started transacting business (Mishra, 200…; Gayathri, Vinaya & Lakshmisha, 2006), both life and general, in Bengal. However, insurance business gained momentum in East Pakistan during 1947-1971, when 49 insurance companies transacted both life and general insurance schemes (BBS, 1974). These companies were of various origins British, Australian, Indian, West Pakistani and local. After the emergence of the People’s Republic of Bangladesh in 1971, the government, in order to make available the fruit of liberation to the general mass, nationalized the insurance industry along with the banks in 1972 by Presidential Order No. 95 (Debnath, 2003). Following the Order, all companies and organization transacting all types of insurance business in Bangladesh came under this nationalized regulation and five insurance corporations were initially established by the Government. These were --- (i) Jatiya Bima Corporation (National Insurance Corporation), (ii) Teesta Bima Corporation (Teesta Insurance Corporation), (iii) Karnaphuli Bima Corporation (Karnaphuli Insurance Corporation), (iv) Rupsa Jiban Bima Corporation (Rupsa Life Insurance Corporation) and (v) Surma Jiban Bima Corporation (Surma Life Insurance Corporation). The basic idea behind the formation of five corporations was to encourage competition even under a nationalized system. Nevertheless, the burden of administrative expenses incurred in maintaining two corporations in each front of life and general and an apex institution at the top outweighed the advantages of limited competition. Consequently, on 14 May 1973, a restructuring was made under the Insurance Corporations Act 1973. Following the Act, in place of five corporations the government formed two insurance companies which were (i) Sadharan Bima Corporation (SBC) for general business, and Jiban Bima Corporation (JBC) for life business (Debnath, 2003). Until 1985, JBC was the only institution to handle life insurance business in Bangladesh. Through the Insurance (Amendment) Ordinance 1984 and Insurance Corporations (Amendment) Ordinance 1984, the government allowed the private sector to establish insurance companies. Up to December 2007, a total of 62 insurance companies have been operating in Bangladesh, of which 18 provide life insurance and 44 are in the general insurance field which made the life insurance business competitive. The life insurance companies are consisted of sixteen (16) national companies and one international company, namely American Life Insurance Company (ALICO). Yet, it had little impact on the business performance of the Jiban Bima Corporation (Chowdhury et al., 2007) The corporation (JBC) offers 15 different types of life insurance schemes. These are whole life assurance, endowment assurance, child protection policy, children endowment, anticipated endowment assurance, pension scheme policy, single payment policy, mortgage protection policy, group term insurance policy, group endowment policy, group variable endowment policy, group pension policy, grameen bima policy (rural insurance policy), joint life endowment policy, and progressive premium policy. A BRIEF LITERATURE REVIEW: SERVICE QUALITY In spite of the growing importance of service quality ((Hallberg & Sipos-Zackrisson, 2010), it remains an abstract and elusive (Mangin, Dubé & Donderi, 2005) construct that is difficult to define and measure (Gummesson, 2008; Chong, Lee & Tan, 1999, Qualls & Rosa, 1995). According to Gummesson (2008), quality is a complex concept and regarding in service there is a humanistic quality approach, at the one extreme stressing 63
  • 3. Industrial Engineering Letters www.iiste.org ISSN 2224-6096 (Paper) ISSN 2225-0581 (online) Vol.4, No.8, 2014 customers, personnel, leadership and culture, whereas at the other end lies a technical approach concerning operations management, statistics and methods of measurement. Gummesson divided quality into services, tangibles and software, but he stresses the importance of a total service offering. Lehtinen and Lehtinen (1991) discussed about physical quality, interactive quality and corporate quality, and, on the other hand, about process and output quality. Pepur & Pivčević (2009) investigate the concept and the measurement of quality of tourism services. It presents results of research conducted with the purpose of determining the guests’ perception of the quality of hotel services in the City of Split. The map ‘importance-performance’ is used for two purposes. It reveals which of the five elementary dimensions of quality are important for hotel guests and secondly, demonstrate the usefulness and relative simplicity of this model for measurement of services quality in the tourism sector. The results not only reveal how the hotel guests perceive the quality of services provided but also which dimensions of quality they find more or less important. Cronemyr & Witell (2010) investigate service improvements in a manufacturing context. The results of the study reveal that when moving from a fire-fighting culture to a proactive culture, a company needs to change from a product to a process perspective. The benefit of changing from a product to a process perspective is the change in focus from reduction of internal costs to value creation through service delivery. This paper shows how feedback from dissatisfied customers can be used as a driving factor in process improvements. Based on this knowledge, a company can select the most important Six Sigma projects to improve their service processes. The change from a product to a process perspective shows that traditionally the severity of almost 50 percent of all faults is underestimated. Kaluarachchi (2010) endeavors to identify the effect of organizational culture (OC) on the total quality management (TQM) practices of a Sri Lankan public sector hospital, which practices Japanese 5-S based TQM and has won several national quality awards. The study identified high senior management commitment, high staff commitment, high stakeholder focus, high integration of continuous improvement, high quality culture, high measurement and feedback, and high learning organization characteristics as TQM practices of the hospital. The study found that the supportive culture of the hospital has positively impacted on its TQM practices. Sahney, Banwet & Karunes (2010) present the results of an empirical study conducted on the administrative staff, so as to obtain the internal customer's perspective on quality. Based on the literature review followed by a pilot study and an earlier study based on the quality function deployment technique, certain elements critical to quality management in education are identified. Thereafter, the interpretive structural modeling (ISM) technique is applied. The study finds that the ISM technique helps prioritize the strategic issues in quality assessment qualitatively, so as to propose a hierarchical structure through prioritizing, sequencing, and categorizing of ideas. The elements are classified as drivers, enablers and dependents, and the hierarchically structured. Lambert (2010) shows that customer relationship management (CRM) is being viewed as a strategic, process-oriented, cross-functional, value-creating for buyer and seller, and a means of achieving superior financial performance. However, there is a need for a more holistic view of cross-functional as it relates to CRM Service quality is not the slippery, mystical, or amorphous concept it is often thought to be. Chowdhury et al. (2007) identify that customers will give an institution high mark for its service when it meets or exceeds their service desires. The five dimensions of service performance (tangibles, reliability, responsiveness, assurance and empathy) give direction to the service quality journey. Although these dimensions will be differently important to various market segments, on an overall basis, they all are important. As a group, they frame the essence of the service quality mandate to be excellent in service, seek to be excellent in tangibles, reliability, responsiveness, assurance and empathy. Service quality is generally defined as customer perceived quality which stresses the individual’s assessment of the value of the total service offering (Gummesson, 2008). Practically, Gronroos (2009) described promised service quality as the difference between expected service quality and experienced service quality. This has a link to the gap model (Parasuraman et al., 1985) and other service quality models (e.g. Bitner 1995). On the other hand, Berry (1995) divided service quality into two types: regular services, and handling of exceptions or problems to ensure that appropriate procedures are taken to deal with inevitable failures. As regards to service quality, the individual’s experience of a service forms the basis of an assessment of its quality. It is great to listen to customers and study their reactions. When purchasing services, customers’ 64
  • 4. Industrial Engineering Letters www.iiste.org ISSN 2224-6096 (Paper) ISSN 2225-0581 (online) Vol.4, No.8, 2014 attention is often limited to a small number of tangible inputs (Zeithaml, Parasuraman & Berry, 1988).). Physical environment include buildings, offices and interior design affects customer beliefs, attitudes and satisfaction Zeithaml and Bitner, 2000), and provides an opportunity to tell the ‘right’ story about a given service (Berry, 1995). Matters such as how contact personnel addresses, articulates, writes, designs and presents proposals are likewise not without meaning (Levitt, 1981, 1986). Making the intangible into tangible is important, because customers do not usually know what they are getting until they do not get it (Levitt, 1986). As tangible input, the service personnel represent the service, the organization and the marketers in the customers’ eyes (Zeithmal and Bitner, 1996). The quality management of personnel includes such things as motivating, managing information, training, career planning and recruiting and retaining of right people (Normann, 1991; Zeithaml and Britner, 1996). It is true that service business is personnel intensive, meaning that quality supplied to the customer is essentially a result of the way personnel perform (Normann, 1991). Schneider (1990) showed that both employees and customers will experience more positive outcomes when the organization operates with a customer service orientation and management supports it. This may be linked to the external service value within the service-profit chain by Heskett et al. (1994), which described employee satisfaction as the underlying factor in the formation of customer perceived quality. The other important tangible element is service culture, and by participating in the production process, customers influence and even create perceived service culture (Lethtinen, 1985). High levels of intangibility call for image building and maintenance to attain reliance based on reputation and subjective impressions of the service (Cowell, 1998). In the long run, image depends mainly on what the company actually provides, but in the short run, image can be used as a tool for the creation of new reality (Normann, 1991). In deploring the inadequacy of measurement procedures used in the marketing discipline Jacoby (1978) has mentioned that many of measures are developed at the whim of a researcher with a thought given to whether or not it is meaningfully related to an explicit conceptual statement of the phenomena or variables in question. In most instances, concepts have not been identified, apart from the instrument or procedures used to measure them. Other scholars have emphasized the need for scale development to be preceded by, and rooted in, a sound conceptual specification of the construct being scaled as well. The conceptual foundation for the SERVQUAL scale was derived from the works of handful of researchers who have examined the meaning of service quality (Gonroos, 1984; Letinen and Letinen, 1985). The SERVQUAL scale also derived from a comprehensive quantitative research study that defined service quality and illuminated the dimensions, along which consumers perceive and evaluate service quality (Parasuraman et al., 1985). The construct of quality as conceptualized in the service literature and as measured by SERVQUAL, the scale that is the focus of this study, involves perceived quality. Perceived quality is the customer’s judgment about an entity’s overall excellence or superiority (Zeithaml, 1984). It differs from objective quality (as by Garvin 1988); it is a form of attitude related but not equivalent to satisfaction and results from a comparison of expectations with perceptions of performance. Parasuraman, Zeithaml and Berry (1996) defined service quality from the customer’s view rather than based on internal performance measures. From this perspective, service quality is the customer’s perception of the superiority of the service. Satisfaction is defined as a customer’s perception of a single service experience, whereas quality is the accumulation of the satisfaction for many customers over many service experiences. A quality service provider is one that is able to consistently provide a satisfying service experience over a long period of time (Sureshchandar et al. 2002). CONCEPTUAL FRAMEWORK The construct of quality as conceptualized in the services literature and as measured by SERVQUAL, the scale that is the focus of this article, involves perceived quality. Perceived quality is the consumer’s judgment about an entity’s overall excellence or superiority (Zeithaml 1987; Zeithaml, Parasuraman, and Berry, 1990; Parasuraman, Zeithaml and Berry, 1988; Parasuraman, Zeithaml & Berry, 1990). It differs from objective quality (as defined by, for example, Garvin 1983); it is a form of attitude, related but not equivalent to satisfaction, and results from a comparison of expectations with perceptions of performance. In the SERVQUAL instrument, 16 statements measure the performance across these five dimensions, using a seven point Likert Scale measuring both customer expectations and perceptions (Gabbie and O'neill, 1996). It is important to note that without adequate information on both the quality of services expected and perceptions of services received then feedback from customer surveys can be highly misleading from both a policy and an 65
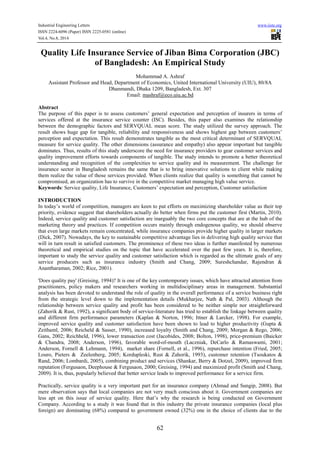
  • 5. Industrial Engineering Letters www.iiste.org ISSN 2224-6096 (Paper) ISSN 2225-0581 (online) Vol.4, No.8, 2014 operational perspective. In the following, the application of SERVQUAL approach is more specified with an example in a catering company. Model of Service Quality Gaps There are seven major gaps in the service quality concept, which are shown in Figure 1. The model is an extension of Parasuraman et al. (1985). According to the following explanation (Luk & Layton, 2002), the three important gaps, which are more associated with the external customers, are Gap1, Gap5 and Gap6; since they have a direct relationship with customers. Gap1: Customers’ expectations versus management perceptions: as a result of the lack of a marketing research orientation, inadequate upward communication and too many layers of management. Gap2: Management perceptions versus service specifications: as a result of inadequate commitment to service quality, a perception of unfeasibility, inadequate task standardization and an absence of goal setting. Gap3: Service specifications versus service delivery: as a result of role ambiguity and conflict, poor employee-job fit and poor technology-job fit, inappropriate supervisory control systems, lack of perceived control and lack of teamwork. Gap4: Service delivery versus external communication: as a result of inadequate horizontal communications and propensity to over-promise. Gap5: The JBC discrepancy between customer expectations and their perceptions of the service delivered: as a result of the influences exerted from the customer side and the shortfalls (gaps) on the part of the service provider. In this case, customer expectations are influenced by the extent of personal needs, word of mouth recommendation and past service experiences. Gap6: The JBC discrepancy between customer expectations and employees’ perceptions: as a result of the differences in the understanding of customer expectations by front-line service providers. Gap7: The JBC discrepancy between employee’s perceptions and management perceptions: as a result of the differences in the understanding of customer expectations between managers and service providers. The gap model is one of the best received and most heuristically valuable contributions to the services literature (Sahney, Banwet & Karunes, 2004). The model identifies seven key JBC discrepancies or gaps relating to managerial perceptions of service quality, and tasks associated with service delivery to customers. The first six gaps (Gap 1, Gap 2, Gap 3, Gap 4, Gap 6 and Gap 7) are identified as functions of the way in which service is delivered, whereas Gap 5 pertains to the customer and as such is considered to be the true measure of service quality. The Gap on which the SERVQUAL methodology has influence is Gap 5. Exploratory research of Parasuraman, Zeithaml, & Berry (1985) revealed that the criteria used by consumers in assessing service quality fit 10 potentially overlapping dimensions. These dimensions were tangibles, reliability, responsiveness, communication, credibility, security, competence, courtesy, understanding/knowing the customer, and access. These 10 dimensions and their descriptions served as the basic structure of the service-quality domain from which items were derived for the SERVQUAL scale. 66
  • 6. Industrial Engineering Letters www.iiste.org ISSN 2224-6096 (Paper) ISSN 2225-0581 (online) Vol.4, No.8, 2014 Figure 1. Model of service quality gaps Source: Adapted from Parasuraman et al. (1985); Luk and Layton (2002) METHODOLOGY As the purpose of this research project is to determine the significance of five service quality dimensions from the customer viewpoints. Service dimensions such as tangibles, reliability, responsiveness, assurance and empathy are independent variables and service quality is dependent variable. This research is to identify the gap between perceptions and expectations of external customers on service dimensions. In the process of collecting data, a questionnaire was developed to ensure that all the information required for analysis be obtained. The questionnaire was extensively explained for each of the customers who were contacted. A total of 107 customers on the counter inside the Regional Branchs of Jiban Bima Corporation was approached to fill up the questionnaire, but only 52 customers attended the survey which excluded 14 questionnaire for erroneous responses. Hence, the sample size of 38 was finally selected for analyzing the findings. Judgment sampling procedure was followed for gathering data for this pilot study 67
  • 7. Industrial Engineering Letters www.iiste.org ISSN 2224-6096 (Paper) ISSN 2225-0581 (online) Vol.4, No.8, 2014 For analyzing data the statistical software of SPSS 12.0 was used. In addition, it provides a lot of useful statistical tools for evaluating data in testing the study hypothesis. Two major statistical analysis tools used in this study can be easily calculated which are reliability analysis and descriptive analysis. Frequencies and descriptive statistic (mean and percentage) were used to explore information about the distributions of variables. To find the service quality gap, mean of each of the variables dimensions between perception and expectation were compared and analyzed. Table 1: Result of reliability analysis for five variables Dimensions No. of Attributes Chronbach's Alpha 68 Expectations Perceptions Tangibles 3 .699 .680 Reliability 4 .530 .715 Responsiveness 3 .464 .382 Assurance 3 .582 .770 Empathy 3 .605 .719 Source: Field Survey In determining the reliability of the instruments, the Cronbach’s Alpha was used to measure reliability of the underlying variables of. tangible, reliability, responsiveness, assurance and empathy. The Cronbach’s Alpha estimates indicate how highly the items in the questionnaire are interrelated in order to determine reliability of the instrument (Hayes, 1998). When the Alpha is more than 0.50 indicated as highly reliable (Nunnally, 1978). In this study, 32 items were tested on its reliability. Table 1 shows the component and total reliabilities of SERVQUAL scores. The findings show that the reliability coefficients for all dimensions are around 0.70 excluding some few exceptions. DATA ANALYSIS AND RESULTS INTERPRETATIONS Profile of Respondents The profiles of the respondents are shown in the Table 2. The profiles focus on the demographic and economic status of the respondents. From the table, it shows that out of 38 respondents, 78.9% of the respondents are male and only 21.1% are female. The highest education level attained by most of the respondents was Higher Secondary School (HSC) level (39.5%), followed by degree/ honors’ (26.3%) and SSC or below (21.1%). It shows that majority of respondents were educated with medium to low qualifications. In term of household income, more than half of the respondents earned less than BDT 10,000. Table 2: Profile of Respondents Characteristics Frequency Percentage Gender Male 30 78.9 Female 8 21.1 Level of Education SSC or below 8 21.1 HSC 15 39.5 Degree/ Honors’ 10 26.3 Masters/PhD 5 13.2 Income in BDT Below 5000 5 13.2 5000-10000 21 55.3 10001-20000 9 23.7 20001-30000 2 5.3 30001 and above 1 2.6 Source: Field Survey The Perception and Expectation Gap on Tangibles Table 3 illustrates the mean score of attributes in tangible dimension in term of perception and expectation. In term of expectation, attribute 3 or ‘employees appear neat’ scores lowest gap and attribute 1 and 2, ‘physical facilities’ and ‘equipments’ show higher gaps. The attribute 3 scores highest on perception and all the attributes have more or less equal score on expectation. So attributes 1 and 2 requires more attention and shows more scopes for development.
  • 8. Industrial Engineering Letters www.iiste.org ISSN 2224-6096 (Paper) ISSN 2225-0581 (online) Vol.4, No.8, 2014 Table 3: Means of Perception and Expectation on Tangibles. Attributes 69 Customers’ Perception Customers’ Expectation Gap 1. Up-to-date equipment 2.63 5.61 -2.98 2. Visually appealing physical facilities 2.45 5.39 -2.94 3. Employees well dressed and appear neat 4.34 5.95 -1.61 Total for Tangibles 3.14 5.65 -2.51 Source: Field Survey The Perception and Expectation Gap on Reliability As shown in table 4, the highest score on expectation is for attribute 5 or ‘dependability’ and the lowest is for attribute 6 or ‘timeliness’ which refer to ability to fulfil promises in a timely manner. So it may infer from here that people in Bangladesh do not mind waiting longer for services. In terms of perception, again attribute 5 scores highest and attribute 6 lowest. Again interestingly the gap is lowest for ‘dependability’, which can be considered most crucial attribute according to expectation. Here the highest strength for JBC can be observed. The risk free nature of the government can be one of the biggest reasons behind it. But more interestingly ‘timeliness’ shows the highest gap. So, though people expect less timeliness, they find lesser timeliness here. Table 4: Means of Perception and Expectation on Reliability Attributes Customers’ Perception Customers’ Expectation Gap 4. Sympathy and reassurance on problems 5.00 6.74 -1.74 5. Dependability 6.39 6.87 -0.48 6. Timeliness 4.63 6.55 -1.92 7. Keeping of records accurately 4.87 6.63 -1.76 Total for Reliability 5.22 6.70 -1.48 Source: Field Survey The Perception and Expectation Gap on Responsiveness As illustrated in Table 5, attribute 8 or ‘Promptness of service’ scored highest on both expectation and perception and again shows the lowest gap. So, one can conclude that JBC is apt in the most essential attribute for its responsiveness. The huge gap on attribute 10 between perception and expectation denotes that though JBC employees are said to be prompt, but it’s true only when they are not busy. During busy hours employees can be said reluctant to give extra effort for getting customer satisfaction. Table 5: Means of Perception and Expectation on Responsiveness. Attributes Customers’ Perception Customers’ Expectation Gap 8. Promptness of service 4.82 6.08 -1.26 9. Willingness to help customers 3.82 5.42 -1.6 10. Responding to customer requests promptly during busyness. 3.55 5.37 -1.82 Total for Responsiveness 4.06 5.62 -1.56 Source: Field Survey The Perception and Expectation Gap on Assurance Table 6 illustrates the mean scores of five attributes selected under assurance dimension in term of perception and expectation. Here smaller gaps exist between perception and expectation. The highest gap is on attribute 11 which is ‘trustworthiness of employees’. Trustworthiness has been considered important because the transactions deal with money. The customers need employees who are honest and skilled to handle their transactions. Table 6: Means of Perception and Expectation on Assurance. Attributes Customers’ Perception Customers’ Expectation Gap 11. Trustworthiness of employees 5.34 6.66 -1.32 12. Feeling safe on transactions 5.74 6.71 -0.97 13. Politeness of employees 5.00 5.87 -0.87 Total for Assurance 5.36 6.41 -1.05 Source: Field Survey
  • 9. Industrial Engineering Letters www.iiste.org ISSN 2224-6096 (Paper) ISSN 2225-0581 (online) Vol.4, No.8, 2014 The Perception and Expectation Gap on Empathy Table 7 shows the most exceptional scenario, customers’ perception exceeds their expectation in attribute 16 or ‘Operating hours convenient to all the customers’. This is not impractical as they do not expect very much from this attribute but JBC has satisfied them to a greater scale. In attribute 15 or ‘Knowing the needs of the customers’ there exists highest expectation and at the same time highest gap. So the customers are thinking that the company does not understand exactly what their requirement is. Table 7: Means of Perception and Expectation on Empathy. Attributes 70 Customers’ Perception Customers’ Expectation Gap 14. Individual attention toward customers 3.68 3.71 -0.03 15. Knowing the needs of the customers 3.97 5.13 -1.16 16. Operating hours convenient to all the customers 4.76 3.74 +1.02 Total for Empathy 4.14 4.20 -0.06 Source: Field Survey The service quality gap for empathy dimension indicates small gap between customers’ perception and expectation, remember that expectation was also the lowest. It means that empathy perceived by the customers are about to meet customers’ expectation. Interestingly tangibles show the highest gap (-2.51) which means that the service quality emerged from physical appearance is poorest of all the dimensions. Table 6: Means of Perception and Expectation on Five Dimensions. Dimensions Customers’ Perception Customers’ Expectation Gap Tangibles 3.14 5.65 -2.51 Reliability 5.22 6.70 -1.48 Responsiveness 4.06 5.62 -1.56 Assurance 5.36 6.41 -1.05 Empathy 4.14 4.20 -0.06 Source: Field Survey The result obviously shows mentionable gap for reliability and responsiveness too. This research illustrates tangibles, reliability and responsiveness as the most critical determinant of SERVQUAL measure for service quality. The other dimensions (assurance and empathy) appear important but those are dominating. Thus, results of this study underscore the need for insurance providers to gear customer service and quality improvement efforts towards components of tangibles, reliability and responsiveness. Conclusions and Recommendations A focused overview of the service quality of JBC can be understood from this study. The research results suggest a need to better understand how the customers’ perception and expectation for service quality differ and how these affect customer satisfaction (refer to table 6). The satisfaction is derived from the comparison of customers’ perception and expectation as mentioned earlier in literature reviews. According to Parasuraman et al (1990), satisfaction equals to perception minus expectation. When the perception were poor on service and the expectation on the service quality were high, customers were deemed to be dissatisfied with quality of service given or provided by the JBC. Reliability scores highest on expectation (6.70) and responsiveness scores highest in perception (5.36). It means that customers consider reliability most essential whereas the actual service quality performs responsiveness onward. The tangibles scores lowest on perception (3.14) whereas empathy scores lowest on expectation (4.20). It is clear that customers’ perceived quality for tangibles of JBC is low, and empathy can be considered as least expected service performance by the very customers of JBC. There is a statistical link between employee behavior and customer satisfaction. These facts are beginning to resonate with insurance companies, who are investing in customer relationship management and self-technologies designed to build customer loyalty and customer centricity. Whether the ‘customer’ is defined as the selling agent, the group benefits manager or the policyholder, the customer service is quickly becoming the critical channel for proactive marketing, sales and customer retention as well a service. Today’s fiercely competitive environment means that players in the insurance industry are looking for revenue momentum, improved profitability and increased customer retention. All three of those goals depend greatly on the customer experience: the customer service counter representatives as part of the customer service centre’s daily operations. Customers expect to be able to reach their insurance company at any time, by phone, online or
  • 10. Industrial Engineering Letters www.iiste.org ISSN 2224-6096 (Paper) ISSN 2225-0581 (online) Vol.4, No.8, 2014 face-to-face. Customers expect complete, consistent, accurate answers to their entire question, whether they are inquiring about the status of claim or the cost of new insurance. The insurance industry is beginning to realize the importance of building an excellent customer experience. Service improvement is supporting a strong trend in which many insurance companies are adopting a customer focus versus a product focus. As a result, insurers are investing heavily in customer relation management (CRM) and customer interaction software. Superior service quality on basic customer-service transactions provides a competitive edge for insurers. It is necessary, therefore, to insure that employees are well prepared, knowledgeable and have superior skills to meet customer expectations. The need for striving for service quality lies in its ability to result in economic success. In the modern, highly competitive business world, the key to winning new clients, retaining current customers, and sustainable competitive advantage lies in delivering high quality service that will, in turn, lead to satisfied customers. Customer satisfaction is considered a prerequisite of customer retention and loyalty, and obviously helps in realizing economic goals like profitability, market share, return on investment (ROI), etc. Insurers that failed in satisfying customers will have a more difficult time convincing customers to come back. Companies that distinguish themselves by creating customer satisfaction will reap the rewards of repeat business while those that don’t will have to spend time and money luring new customers. However, building a customer-focused organization takes time, money and commitment from the highest ranks of both business-side and technology executives. Since the globalization of financial institutions is encouraged by the government and the increasing international competitive markets especially in the insurance market, consumers in this region have a wide range of choices in order to make decision. Top management in the insurance sector should realize that the industry is moving towards a dramatic era. In this ever-changing competitive market, insurance companies have to use their efforts expand their market in facing their competitors. The insurance companies, who can take their employees from their current skills level to where they need to be fast to deliver a consistent and quality customer experience, will enjoy a significant competitive advantage and will be in a position to break away from their competition. It is not sufficient for JBC employee to casually learn and gain knowledge. To survive and win, they must do it purposefully, do it fast and do it continuously. They have to read the customers and paint the most pleasant picture for them. REFERENCES Anderson, E. W. (1996). Customer Satisfaction and Price Tolerance. Marketing Letter 7 (3): 265 -274. Anderson, E. W., Fornell, C. & Lehmann, D. R. (1994). Customer Satisfaction, Market Share, and Profitability: Findings from Sweden. Journal of Marketing, 58 (3): 53-66. Baicker, K. & Chandra, A. (2008). The Labor Market Effects of Rising Health Insurance Premiums. Journal of 71 Labor, 24(3): 609 – 634. Berry, L. L. (1995). Relationship marketing of services – growing interest, emerging perspectives. Journal of the Academy of Marketing Science, 23(4): 236-45. Bitner, M. J. (1995). Building service relationships: it’s all about promises. Journal of the Academy of Marketing Science 23(4): 246-51. Bolton, R. N. (1998). A Dynamic Model of the Duration of the Customers' Relationship with a Continuous Service Provider: The Role of Satisfaction. Marketing Science, 17(1): 45-65. Chong, C., Lee J. & Tan, L. P. (1999). Applying Systems Thinking to a Strategic Simulation of Service Quality. Research Paper, National University of Singapore, Singapore. Chowdhury, T. A., Rahman, M. I. & Afza, S. R. (2007). Perceptions of the Consumers towards Insurance Companies in Bangladesh --- A Study Based on the SERVQUAL Model. BRAC University Journal, 4(2): 55 -66. Cronemyr, P. & Witell, L. (2010). Changing from a Product to a Process Perspective for Service Improvements in a Manufacturing Company. TQM Journal, 22(1): 26. Curry, A. (1999), "Innovation in public service management", Managing Service Quality, 9(3): 180-190. Dick, A. A. (2007). Market Size, Service Quality and Competition in Banking. Journal of Money, Credit and Banking, 39(1): 49-81. Fergusaon, T. D., Deephouse, D. L. & Fergusaon, W. L. (2000). Do Strategic Groups Differ in Reputation? Strategic Management Journal, 21(12): 1195 – 1214. Fornell, C. et al. (1996). The American Customer Satisfaction Index: Nature, Purpose and Findings. Journal of Marketing, 60: 7-18. Fried, J. M. (2005). Informed Trading and False Signaling with Open Market Repurchases. California Law Review, 93(5): 1323-1386.
  • 11. Industrial Engineering Letters www.iiste.org ISSN 2224-6096 (Paper) ISSN 2225-0581 (online) Vol.4, No.8, 2014 Gabbie, O. & O'Neill, M. A. (1996). SERVQUAL and the Northern Ireland Hotel Sector: A Comparative Analysis – Part 1, Managing Service Quality, 6(6): 25-32. Gans, N. (2002). Customer Loyalty and Supplier Quality Competition. Management Science, 48(2): 207 – 221. Gayathri, H., Vinaya, M. C. & Lakshmisha, K. (2006). A Pilot Study on the Service Quality of Insurance Companies. Journal of Services Research, 5(2): 123 – 138. Greising, D. (1994). Quality-How to Make It Pay, Business Week, August 8: 54-59. Gummesson, E. (2008). Quality, Service –Dominant Logic and Many-to-Many Marketing. The TQM Journal, 72 20(2): 143 – 153. Garvin, D. A. (1983). Quality on the Line. Harvard Business Review, 61 (September-October), 65-73. Gupta, S. & Zeithaml, V. A. (2006). Customer Metrics and Their Impact on Financial Performance. Marketing Science, 25(6): 718 -739. Hayes, B. E. (1998). Measuring Customer Satisfaction. Milwaukee: ASQ Quality Press. Ittner, C. D. & Larcker, D. F. (1998). Are Nonfinancial Measures Leading Indicators of Financial Performance? An Analysis of Customer Satisfaction. Journal of Accounting Research 36(1): 1-33. Jacobides, M. G. (2008). How Capability Differences, Transaction Costs and Learning Curves Interact to Shape Vertical Scope. Organization Science, 19(25): 306 – 326. Kaplan, R. S. & Norton, D. P. (1996). The Balanced Scorecard. Boston: Harvard University Press. Kaluarachchi, K.A.S.P. (2010). Organizational Culture and Total Quality Management Practices: A Sri Lankan Case. The TQM Journal, 22 (1): 41-55. Kordupleski, R. E., Rust, R. T. & Zahorik, A. J. (1993). Why Improving Quality Doesn't Improve Quality (Or Whatever Happened to Marketing?). California Management Review 35 (3): 82-95. Lehtinen, U. & Lehtinen, J. R. (1991). Two Approaches to Service Quality Dimensions. The Service Industries Journal, 11(3): 287-303. Levitt, T. (1981), “Marketing intangible products and product intangibles”, Harvard Business Review, 59(May- June): 94-102. Levitt, T. (1986). The Marketing Imagination. New York: The Free Press. Lombardi, L. J. (2005). The Importance of Client Retention. LIMRA’s MarketFacts Quarterly, 24 (2): 31-32. Louro, J., Pieters, R. & Zeelenberg, M. (2005). Negative Returns on Positive Emotions: The Influence of Pride and Self-Regulatory Goals on Repurchase Decisions. The Journal of Consumer Research, 31(4): 833 – 840. Luk, S.T.K. & Layton, R. (2002), "Perception Gaps in customer expectations: Managers versus service providers and customers", The Service Industries Journal , Vol.22, No.2, April, pp. 109-128. Mangin, P. J., Dubé, M. & Donderi, D. C. (2005). Fundamental Questions on Print Quality. A Research Paper done jointly by CIPP, Université du Québec à Trois-Rivières, Quebec and Department of Psychology, McGill University, Montreal, Quebec, Canada. Martin, R. (2010). The Age of Customer Capitalism. Harvard Business Review, 88(1): 58 – 65. Morgan, N. A. & Rego, L. L. (2006). The Value of Different Customer Satisfaction and Loyalty Metrics in Producing Business Performance, Marketing Science, 25(5): 426 -439. Mukherjee, A., Nath, P. & Pal, N. (2003). Resource, Service Quality and Performance Triad: A Framework for Measuring Efficiency of Banking Services. Journal of the Operational Research Society, 54 (7): 723-735. Nunnally, J. L. (1978). Psychometric Theory. New York: McGraw-Hill. Parasuraman, A, Zeithaml, V. A & Berry, L. L. (1988). SERVQUAL : A Multiple Item Scale for Measuring Consumer Perceptions of Service Quality, Journal of Retailing, Spring, pp. 12-40. Parasuraman, A, Zeithaml, V. A, & Berry, L. L. (1990) Delivering Quality Service: Balancing Consumer Perceptions and Expectations. New York: The Free Press. Parasuraman, A., Zeithaml, V. A. and Berry, L. L. (1985). A Conceptual Model of Service Quality and its Implications for Further Research. Journal of Marketing, 49(4), 41-50 Pepur, M. & Pivčević, S. (2009). The concept and measurement of service quality in the hotel sector: the case of Split, Croatia. International Journal of Leisure and Tourism Marketing, 1(1): 44 -57 Qualls, W. J. and Rosa, J. A. (1995). Assessing Industrial Buyers' Perception of Quality and Their effects on Satisfaction, Industrial Marketing Management, 24, 359-369. Reichheld, F. (1996). Learning from Customer Defections. Harvard Business Review 74: 56-69. Reicheld, F. & Sasser, Jr. W. E. (1990). Zero Defections: Quality Comes to Services. Harvard Business Review, 68: 105-111. Rice, E. (2001). The Future of the Insurance Market --- Do Insurers Need Crystal Balls? Balance Sheet, 9(1): 14 -16. Sekaran, U. (2000). Research Methods for Business, 3rd edition, New York: John Wiley & Sons Inc. Sahney, S., Banwet, D. K. & Karunes, S. (2010). Quality Framework in Education through Application of
  • 12. Industrial Engineering Letters www.iiste.org ISSN 2224-6096 (Paper) ISSN 2225-0581 (online) Vol.4, No.8, 2014 Interpretive Structural Modeling: An Administrative Staff Perspective in the Indian Context. The TQM Journal, 22(1): 56-71. Sahney, S., Banwet, D. K., & Karunes, S. (2004). A SERVQUAL and QFD Approach to Total Quality Education: A Student Perspective. International Journal of Productivity and Performance Management, 53(2): 143-166. Shankar, V. Berry, L. L. & Dotzel, T. (2009). A Practical Guide to Combining Products and Services. Harvard 73 Business Review, (Novemebr): 95 – 99. Smith, M. & Chang, C. (2009). The Impact of Customer-Related Strategies on Shareholder Value: Evidence from Taiwan. Asian Review Accounting, 17(3): 247 – 268. Sureshchandar, G. S., Rajendran, C. & Anantharaman, R. N. (2002). The Relationship between Service Quality and Customer Satisfaction ---- A Factor Specific Approach. Journal of Service Marketing, 16(4): 363 – 379. Tsoukatos, E. & Rand, G. K. (2006). Path Analysis of Perceived Service Quality, Satisfaction and Loyalty in Greek Insurance. Managing Service Quality, 16(5): 501-519. Van Iwaarden, J., van der Wiele, T., Ball, L., & Millen, R. (2003). Applying SERVQUAL to Websites: An Exploratory Study. International Journal of Quality & Reliability Management , 20(8): 919-935. Zahorik, A. J. & Rust, R. T. (1992). Modeling the Impact of Service Quality on Profitability: A Review. In: Terry, S. (ed). Advances in Service Quality and Management, Vol. 1. JAI: Greenwich, CT, pp 247-276. Zeithaml, V. A., Parasuraman, A. & Berry, L. L. (1988). Communication and Control Processes in the Delivery of Service Quality. Journal of Marketing, 64(April): 35-49. Zeithaml, V. A. (1987). Defining and Relating Price, Perceived Quality, and Perceived Value, Report No. 87- 101, Cambridge, MA: Marketing Science Institute.
  • 13. The IISTE is a pioneer in the Open-Access hosting service and academic event management. The aim of the firm is Accelerating Global Knowledge Sharing. More information about the firm can be found on the homepage: http://www.iiste.org CALL FOR JOURNAL PAPERS There are more than 30 peer-reviewed academic journals hosted under the hosting platform. Prospective authors of journals can find the submission instruction on the following page: http://www.iiste.org/journals/ All the journals articles are available online to the readers all over the world without financial, legal, or technical barriers other than those inseparable from gaining access to the internet itself. Paper version of the journals is also available upon request of readers and authors. MORE RESOURCES Book publication information: http://www.iiste.org/book/ IISTE Knowledge Sharing Partners EBSCO, Index Copernicus, Ulrich's Periodicals Directory, JournalTOCS, PKP Open Archives Harvester, Bielefeld Academic Search Engine, Elektronische Zeitschriftenbibliothek EZB, Open J-Gate, OCLC WorldCat, Universe Digtial Library , NewJour, Google Scholar