QNBFS Weekly Market Report March 10, 2022
•
0 likes•113 views

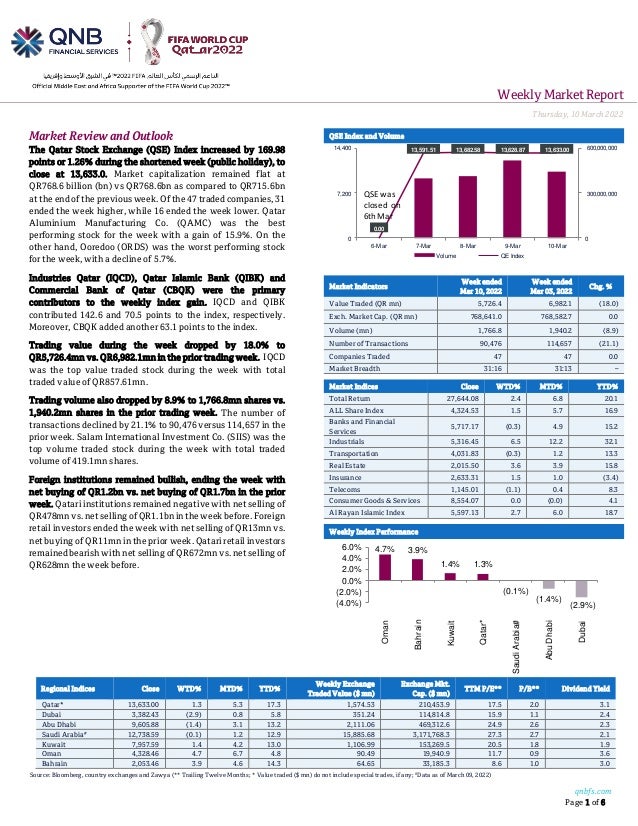
The Qatar Stock Exchange (QSE) Index increased by 169.98 points or 1.26% during the shortened week (public holiday), to close at 13,633.0

Recommended
More Related Content
Similar to QNBFS Weekly Market Report March 10, 2022
Similar to QNBFS Weekly Market Report March 10, 2022 (20)
More from QNB Group
More from QNB Group (20)
Recently uploaded
Recently uploaded (20)
QNBFS Weekly Market Report March 10, 2022
- 1. Weekly MarketReport Thursday,10March2022 qnbfs.com Page 1 of 6 Regional Indices Close WTD% MTD% YTD% Weekly Exchange Traded Value ($ mn) Exchange Mkt. Cap. ($ mn) TTM P/E** P/B** Dividend Yield Qatar* 13,633.00 1.3 5.3 17.3 1,574.53 210,453.9 17.5 2.0 3.1 Dubai 3,382.43 (2.9) 0.8 5.8 351.24 114,814.8 15.9 1.1 2.4 Abu Dhabi 9,605.88 (1.4) 3.1 13.2 2,111.06 469,312.6 24.9 2.6 2.3 Saudi Arabia# 12,738.59 (0.1) 1.2 12.9 15,885.68 3,171,768.3 27.3 2.7 2.1 Kuwait 7,957.59 1.4 4.2 13.0 1,106.99 153,269.5 20.5 1.8 1.9 Oman 4,328.46 4.7 6.7 4.8 90.49 19,940.9 11.7 0.9 3.6 Bahrain 2,053.46 3.9 4.6 14.3 64.65 33,185.3 8.6 1.0 3.0 Source: Bloomberg, country exchanges and Zawya (** Trailing Twelve Months; * Value traded ($ mn) do not include special trades, if any; #Data as of March 09, 2022) Market Review and Outlook QSE Index and Volume The Qatar Stock Exchange (QSE) Index increased by 169.98 points or 1.26% during the shortened week (public holiday), to close at 13,633.0. Market capitalization remained flat at QR768.6 billion (bn) vs QR768.6bn as compared to QR715.6bn at the end of the previous week. Of the 47 traded companies, 31 ended the week higher, while 16 ended the week lower. Qatar Aluminium Manufacturing Co. (QAMC) was the best performing stock for the week with a gain of 15.9%. On the other hand, Ooredoo (ORDS) was the worst performing stock for the week, with a decline of 5.7%. Industries Qatar (IQCD), Qatar Islamic Bank (QIBK) and Commercial Bank of Qatar (CBQK) were the primary contributors to the weekly index gain. IQCD and QIBK contributed 142.6 and 70.5 points to the index, respectively. Moreover, CBQK added another 63.1 points to the index. Trading value during the week dropped by 18.0% to QR5,726.4mn vs. QR6,982.1mn in the prior trading week. IQCD was the top value traded stock during the week with total traded value of QR857.61mn. Trading volume also dropped by 8.9% to 1,766.8mn shares vs. 1,940.2mn shares in the prior trading week. The number of transactions declined by 21.1% to 90,476 versus 114,657 in the prior week. Salam International Investment Co. (SIIS) was the top volume traded stock during the week with total traded volume of 419.1mn shares. Foreign institutions remained bullish, ending the week with net buying of QR1.2bn vs. net buying of QR1.7bn in the prior week. Qatari institutions remained negative with net selling of QR478mnvs. net sellingofQR1.1bn intheweek before. Foreign retail investors ended the week with net selling of QR13mn vs. net buying of QR11mn in the prior week. Qatari retail investors remained bearish with net selling of QR672mn vs. net selling of QR628mn the week before. Market Indicators Week ended Mar 10, 2022 Week ended Mar 03, 2022 Chg. % Value Traded (QR mn) 5,726.4 6,982.1 (18.0) Exch. Market Cap. (QR mn) 768,641.0 768,582.7 0.0 Volume (mn) 1,766.8 1,940.2 (8.9) Number of Transactions 90,476 114,657 (21.1) Companies Traded 47 47 0.0 Market Breadth 31:16 31:13 – Market Indices Close WTD% MTD% YTD% Total Return 27,644.08 2.4 6.8 20.1 ALL Share Index 4,324.53 1.5 5.7 16.9 Banks and Financial Services 5,717.17 (0.3) 4.9 15.2 Industrials 5,316.45 6.5 12.2 32.1 Transportation 4,031.83 (0.3) 1.2 13.3 Real Estate 2,015.50 3.6 3.9 15.8 Insurance 2,633.31 1.5 1.0 (3.4) Telecoms 1,145.01 (1.1) 0.4 8.3 Consumer Goods & Services 8,554.07 0.0 (0.0) 4.1 Al Rayan Islamic Index 5,597.13 2.7 6.0 18.7 Weekly Index Performance 0.00 13,591.51 13,682.58 13,628.87 13,633.00 0 300,000,000 600,000,000 0 7,200 14,400 6-Mar 7-Mar 8-Mar 9-Mar 10-Mar Volume QE Index QSE was closed on 6thMar 4.7% 3.9% 1.4% 1.3% (0.1%) (1.4%) (2.9%) (4.0%) (2.0%) 0.0% 2.0% 4.0% 6.0% Oman Bahrain Kuwait Qatar* Saudi Arabia# Abu Dhabi Dubai
- 2. qnbfs.com Page 2 of 6 Economic, Market & Company News IMF expects Qatar’s economic growth to accelerate to 3.2% in 2022 – The International Monetary Fund (IMF) expected Real GDP growth of the State of Qatar to accelerate to 3.2 percent in 2022, noting that the North Field LNG expansion project will support growth prospects and further strengthen fiscal and external positions over the medium-term. The report of the 2022 Article IV consultation, which was held between Qatar and the IMF from Feb. 13 to March 1, praised the Qatari authorities swift and decisive response to the COVID-19 crisis which dampened its health and economic impact and paved the way for a speedy recovery. The IMF report underlined that the economic recovery in the State of Qatar is gaining strength on the back of rebounding domestic demand, higher hydro-carbon prices, and the preparation for the 2022 FIFA World Cup, adding that the banking sector remains well-capitalized and liquid, with non- performing loans (NPLs) at relatively low levels. The report noted that the State of Qatar has made commendable progress in advancing structural reforms during the pandemic. It became the first GCC country to abolish Kafala with a mandatory minimum wage and allowances for food and housing. In addition, various reforms have been introduced to boost foreign and private investment and improve productivity and competitiveness. (Peninsula Qatar) Baladna acquires 5% share In Juhayna Food Industries (Egypt) – Baladna acquired 5% stake in Juhayna Food Industries (Company listed on Egyptian Stock Exchange), through a series of purchases from the market. Below is the summary of the transactions: No. of Shares acquired to date: 47,116,563 Shares. Total Investment EGP 285,802,001 (Equivalent to QR67,084,980). Baladna is a market leader in the Qatar dairy market and has shown resilient growth over the last 3 years. According to the developed strategy the company wants to continue its growth path within Qatar and to expand to other countries outside Qatar into F&B market. This is by taking into consideration both green field and brown field projects to enhance the shareholder value. Investment decisions are based on very detailed analysis of the market. Egypt market with population more than 100 million is large and promising F&B market. Being the market leader, Juhayna Company is expected to be most beneficial from the market growth with strong distribution network. Juhayna Food Industries A leading Egypt- based manufacturer specialized in the production, processing and packaging of dairy, juice, and cooking products. Since its founding in 1983, it has secured a frontrunner position in the dairy and juice industries in Egypt and has expanded its presence in the Middle East, a feat made possible through its firm commitment to delivering a wide range of high-quality, healthy, and safe products that have become trusted household names. A public listed company on Egyptian Exchange-EGX , ISIN No. EGS30901C010. Total Company shares to-date: 941,405,082 shares. Registered address: Juhayna Headquarter, Polygon, Building No. 02, Beverly Hills, Sheik Zayed – Giza, Egypt). (QSE) BLDN posts 18.7% YoY decrease but 105.8% QoQ increase in net profit in 4Q2021 – Baladna's (BLDN) net profit declined 18.7% YoY (but rose 105.8% on QoQ basis) to QR31.9mn in 4Q2021.The company's Revenue came in at QR210.3mn in 4Q2021, which represents an increase of 10.3% YoY (+15.5% QoQ). EPS amounted to QR0.070 in FY2021 as compared to QR0.082 in FY2020. (QSE) Qatar First Bank to implement a capital raise of up to 420mn ordinary shares through its rights Issue – Qatar First Bank (QFBQ), announced that it has received the regulatory go-ahead to proceed with its ‘Rights Issue,’ as approved by the shareholders at the bank’s recent concluded Extraordinary General Meeting (EGM). Held on 22 September 2021, the EGM resolved to increase the bank’s capital from QR700mn up to QR1.120bn, representing a 60% increase from the current nominal paid-up share capital, by way of offering 420mn new ordinary shares for subscription by means of a rights issue. The bank’s shareholders, who are registered in the shareholders’ register with Qatar Central Securities Depository (QCSD), will be given the right to subscribe to the new shares at close of trading on Sunday, March 13, 2022. Any person holding Subscription Rights at the end of the trading period on Tuesday, March 29, 2022, either by receiving them in their capacity as an eligible shareholder or through buying them during the trading period (a “Holder of Subscription Rights”) will be entitled to subscribe to the new shares. The new shares will be offered at a price of QR1 nominal value plus QR0.2 premium per share. The premium is inclusive of issuance costs not exceeding 1% of the value of subscribed shares. Trading of the Subscription Rights will commence on Wednesday, March 16, 2022, and end on Tuesday, March 29, 2022. Thereafter, the subscription period for Holders of Subscription Rights will start on Wednesday, April 6, 2022, and will end at 1.00pm Doha local time on Tuesday, April 19, 2022. QFBQ has recently announced its financial results for the year ending 31 December 2021, recording the bank’s highest ever net profit attributable to equity holders of the bank of QR100.37mn in the previous 6 years. QFBQ was able to overcome the challenging market conditions, improved its operational efficiency, and diversified its products and services, owing to its new leadership and strategic direction. The bank maintained a sustainable fee income stream, dropped funding costs, and has maintained a well-managed deposits book, resulting in a stronger balance sheet and healthy liquidity position for the year. Qatar First Bank LLC (Public) is the first independent Shari’ah compliant bank authorized by the QFC Regulatory Authority (QFCRA) and a listed entity on the Qatar Stock Exchange (QSE: QFBQ). (QSE)
- 3. qnbfs.com Page 3 of 6 Qatar Stock Exchange Top Gainers Top Decliners Source: Qatar Stock Exchange (QSE) Source: Qatar Stock Exchange (QSE) Most Active Shares by Value (QR Million) Most Active Shares by Volume (Million) Source: Qatar Stock Exchange (QSE) Source: Qatar Stock Exchange (QSE) Investor Trading Percentage to Total Value Traded Net Traded Value by Nationality (QR Million) Source: Qatar Stock Exchange (QSE) Source: Qatar Stock Exchange (QSE) 15.9% 13.5% 12.8% 12.6% 10.4% 0.0% 7.0% 14.0% 21.0% Qatar Aluminium Manufacturing Company Islamic Holding Group Salam International Investment Limited Qatar Cinema & Film Distribution Company Dlala Brokerage & Investment Holding Company -5.7% -5.2% -4.8% -3.7% -3.5% -9.0% -6.0% -3.0% 0.0% Ooredoo Qatar National Cement Company Ezdan Holding Group Qatar International Islamic Bank Medicare Group 857.6 829.8 658.7 441.9 387.7 0.0 400.0 800.0 1,200.0 Industries Qatar QNB Group Qatar Aluminium Manufacturing Company Salam International Investment Limited Gulf International Services 419.1 250.5 195.0 164.3 82.5 0.0 160.0 320.0 480.0 Salam International Investment Limited Qatar Aluminium Manufacturing Company Gulf International Services Investment Holding Group Mesaieed Petrochemical Holding Company 0% 20% 40% 60% 80% 100% Buy Sell 38.51% 50.25% 13.26% 21.60% 13.12% 13.35% 35.11% 14.80% Qatari Individuals Qatari Institutions Non-Qatari Individuals Non-Qatari Institutions 2,965 2,762 4,114 1,612 -1,150 1,150 -2,000 -1,000 0 1,000 2,000 3,000 4,000 5,000 Qatari Non-Qatari Net Investment Total Sold Total Bought
- 4. qnbfs.com Page 4 of 6 TECHNICAL ANALYSIS OF THE QSE INDEX Source: Bloomberg The QE Index moved up by 1.3% over the week and closed at 13,633.00; it reached the upper side of the uptrend channel seen on the price graph. It should be noted that the volumes were high, but not as much as the previous week’s. As a result, the case for a correction becoming stronger around the current levels while the trend remains up. Our resistance level remains around the 13,800 level and our support level remains at 12,000 points. DEFINITIONS OF KEY TERMS USED IN TECHNICAL ANALYSIS RSI (Relative Strength Index) indicator – RSI is a momentum oscillator that measures the speedand change of price movements. The RSI oscillates between 0 to 100. The index is deemed to be overbought once the RSI approaches the 70 level, indicating that a correction is likely. On the other hand, if the RSI approaches 30, it is an indication that the index may be getting oversold and therefore likely to bounce back. MACD (Moving Average Convergence Divergence) indicator – The indicator consists of the MACD line and a signal line. The divergence or the convergence of the MACD line with the signal line indicates the strength in the momentum during the uptrend or downtrend, as the case may be. When the MACD crosses the signal line from below and trades above it, it gives a positive indication. The reverse is the situation for a bearish trend. Candlestick chart – A candlestick chart is a price chart that displays the high, low, open, and close for a security. The ‘body’ of the chart is portion between the open and close price, while the high and low intraday movements form the ‘shadow’. The candlestick may represent any time frame. We use a one-day candlestick chart (every candlestick represents one trading day) in our analysis. Doji candlestick pattern – A Doji candlestick is formed when a security's open and close are practically equal. The pattern indicates indecisiveness, and based on preceding price actions and future confirmation, may indicate a bullish or bearish trend reversal. ShootingStar/Inverted Hammer candlestick patterns – These candlestick patterns have a small real body (open price and close price are near to each other), and a long upper shadow (large intraday movement on the upside). The Shooting Star is a bearish reversal pattern that forms after a rally. The Inverted Hammer looks exactly like a Shooting Star, but forms after a downtrend. Inverted Hammers represent a potential bullish trend reversal.
- 5. qnbfs.com Page 5 of 6 Source: Bloomberg Company Name Price March 10 % Change WTD % Change YTD Market Cap. QR Million TTM P/E P/B Div. Yield Qatar National Bank 22.70 (3.40) 12.43 209,667 17.2 2.7 2.4 Qatar Islamic Bank 22.82 3.73 24.50 53,922 16.0 2.6 2.5 Commercial Bank of Qatar 7.60 5.97 12.58 30,751 15.0 1.7 1.3 Doha Bank 2.77 0.29 (13.38) 8,594 16.7 0.8 2.7 Al Ahli Bank 3.90 0.03 6.95 9,952 13.9 1.5 3.7 Qatar International Islamic Bank 10.26 (3.66) 11.40 15,530 17.2 2.3 3.7 Masraf Al Rayan 5.09 (0.61) 9.68 47,328 22.8 1.9 3.3 Qatar First Bank 1.80 1.01 0.45 1,259 8.6 2.2 N/M National Leasing 0.92 (0.22) (2.66) 453 N/M 0.7 N/M Dlala Holding 1.51 10.40 22.12 428 50.0 1.9 N/M Qatar & Oman Investment 0.92 3.82 13.51 291 59.6 1.0 N/M Islamic Holding Group 5.50 13.46 39.49 312 51.1 2.2 0.9 Banking and Financial Services 378,487 Zad Holding 17.08 0.47 2.28 4,453 23.0 3.0 3.7 Qatar German Co. for Medical Devices 2.57 0.74 (19.06) 297 97.5 9.0 N/M Salam International Investment 1.10 12.77 34.80 1,262 23.9 0.8 N/M Baladna 1.46 (2.21) 1.25 2,781 21.0 1.2 3.6 Medicare Group 7.24 (3.48) (14.82) 2,037 25.5 2.0 24.9 Qatar Cinema & Film Distribution 3.62 12.61 1.92 227 74.0 1.6 1.7 Qatar Fuel 18.48 (0.86) 1.09 18,374 19.0 2.0 4.1 Qatar Meat and Livestock 3.19 2.21 (11.21) 574 N/M 2.1 3.1 Mannai Corp. 7.80 0.91 64.28 3,558 8.8 1.7 0.1 Al Meera Consumer Goods 20.48 1.89 4.49 4,096 20.8 2.7 4.4 Consumer Goods and Services 37,660 Qatar Industrial Manufacturing 3.21 (1.23) 4.56 1,525 11.1 0.9 3.7 Qatar National Cement 5.21 (5.24) 2.20 3,406 15.1 1.1 5.8 Industries Qatar 19.70 1.44 27.18 119,185 14.8 3.0 5.1 Qatari Investors Group 2.40 1.18 8.11 2,984 21.7 1.0 2.5 Qatar Electricityand Water 19.68 8.37 18.55 21,648 14.6 1.8 3.2 Aamal 1.22 3.91 12.82 7,705 25.2 1.0 3.3 Gulf International Services 1.94 4.14 12.94 3,602 66.5 1.1 N/M Mesaieed Petrochemical Holding 3.01 3.54 44.11 37,840 20.3 2.2 1.3 Invesment Holding Group 2.32 2.97 89.02 1,928 72.7 2.2 N/M Qatar Aluminum Manufacturing 2.67 15.94 48.25 14,899 17.9 2.3 3.0 Industrials 214,722 Qatar Insurance 2.55 1.59 (7.27) 8,329 17.8 1.0 N/M QLM Life & Medical Insurance 5.12 0.39 1.39 1,792 17.0 3.0 N/M Doha Insurance 2.00 2.46 4.06 999 13.6 0.8 5.0 Qatar General Insurance & Reinsurance 2.00 2.41 (0.05) 1,749 18.6 0.3 N/M Al Khaleej Takaful Insurance 3.72 2.00 3.31 949 23.5 1.9 1.3 Qatar Islamic Insurance 8.52 (0.77) 6.49 1,278 15.7 3.1 3.8 Insurance 15,096 United Development 1.62 (1.70) 4.94 5,722 16.1 0.5 3.4 Barwa Real Estate 3.90 8.10 27.29 15,156 13.6 0.7 3.2 Ezdan Real Estate 1.42 (4.84) 5.59 37,559 97.7 1.2 N/M Mazaya Qatar Real Estate Development 0.92 0.22 0.00 1,065 34.7 0.8 3.3 Real Estate 59,503 Ooredoo 7.39 (5.73) 5.27 23,672 627.9 1.1 4.1 Vodafone Qatar 1.70 0.95 1.68 7,165 21.8 1.6 3.5 Telecoms 30,836 Qatar Navigation (Milaha) 8.45 (3.42) 10.64 9,602 13.3 0.7 3.5 Gulf Warehousing 4.24 (2.53) (6.57) 248 11.1 1.2 2.4 Qatar Gas Transport (Nakilat) 3.66 (0.38) 10.76 20,250 14.8 2.3 3.3 Transportation 30,100 Qatar Exchange 768,641
- 6. qnbfs.com Contacts QNB Financial Services Co. W.L.L. Contact Center: (+974) 4476 6666 info@qnbfs.com.qa Doha, Qatar Saugata Sarkar, CFA, CAIA Head of Research saugata.sarkar@qnbfs.com.qa Shahan Keushgerian Senior Research Analyst shahan.keushgerian@qnbfs.com.qa . Disclaimer and Copyright Notice: This publication has been prepared by QNB Financial Services Co. W.L.L. (“QNBFS”) a wholly-owned subsidiary of Qatar National Bank (Q.P.S.C.). QNB FS is regulated by the Qatar Financial Markets Authority and the Qatar Exchange. Qatar National Bank (Q.P.S.C.) is regulated by the Qatar Central Bank. This publication expresses the views and opinions of QNBFS at a given time only. It is not an offer, promotion or recommendation to buy or sell securities or other investments, nor is it intended to constitute legal, tax, accounting, or financial advice. QNBFS accepts no liability whatsoever for any direct or indirect losses arising from use of this report. Any investment decision should depend on the individual circumstances of the investor and be based on specifically engaged investment advice. We therefore strongly advise potential investors to seek independent professional advice before making any investment decision. Although the information in this report has been obtained from sources that QNBFS believes to be reliable, we have not independently verified such information and it may not be accurate or complete. QNBFS does not make any representations or warranties as to the accuracy and completeness of the information it may contain, and declines any liability in that respect. For reports dealing with Technical Analysis, expressed opinions and/or recommendations may be different or contrary to the opinions/recommendations of QNBFS Fundamental Research as a result of depending solely on the historical technical data (price and volume). QNBFS reserves the right to amend the views and opinions expressed in this publication at any time. It may also express viewpoints or make investment decisions that differ significantly from, or even contradict, the views and opinions included in this report. This report may not be reproduced in whole or in part without permission from QNBFS. COPYRIGHT: No part of this document may be reproduced without the explicit written permission of QNBFS. Page 6 of 6