Call Girls in Maurice Nagar (Delhi) ꧁8447779280꧂ Female Escorts Service in De...
Q3 SV Office
1. MARKETBEAT
Silicon Valley
Office Q3 2017
cushmanwakefield.com | 1
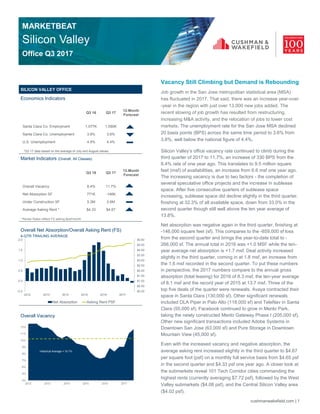
4%
5%
6%
7%
8%
9%
10%
11%
12%
13%
14%
2012 2013 2014 2015 2016 2017
Historical Average = 10.1%
$0.00
$0.50
$1.00
$1.50
$2.00
$2.50
$3.00
$3.50
$4.00
$4.50
$5.00
-0.5
0.0
0.5
1.0
1.5
2.0
2012 2013 2014 2015 2016 2017
Net Absorption Asking Rent PSF
Vacancy Still Climbing but Demand is Rebounding
Job growth in the San Jose metropolitan statistical area (MSA)
has fluctuated in 2017. That said, there was an increase year-over
-year in the region with just over 13,000 new jobs added. The
recent slowing of job growth has resulted from restructuring,
increasing M&A activity, and the relocation of jobs to lower cost
markets. The unemployment rate for the San Jose MSA declined
20 basis points (BPS) across the same time period to 3.6% from
3.8%, well below the national figure of 4.4%.
Silicon Valley’s office vacancy rate continued to climb during the
third quarter of 2017 to 11.7%, an increase of 330 BPS from the
8.4% rate of one year ago. This translates to 9.5 million square
feet (msf) of availabilities, an increase from 6.6 msf one year ago.
The increasing vacancy is due to two factors - the completion of
several speculative office projects and the increase in sublease
space. After five consecutive quarters of sublease space
increasing, sublease space did decline slightly in the third quarter,
finishing at 32.3% of all available space, down from 33.0% in the
second quarter though still well above the ten year average of
13.8%.
Net absorption was negative again in the third quarter, finishing at
-146,000 square feet (sf). This compares to the -859,000 sf loss
from the second quarter and brings the year-to-date total to -
266,000 sf. The annual total in 2016 was +1.0 MSF while the ten-
year average net absorption is +1.7 msf. Deal activity increased
slightly in the third quarter, coming in at 1.8 msf, an increase from
the 1.6 msf recorded in the second quarter. To put these numbers
in perspective, the 2017 numbers compare to the annual gross
absorption (total leasing) for 2016 of 8.3 msf, the ten-year average
of 8.1 msf and the record year of 2015 at 13.7 msf. Three of the
top five deals of the quarter were renewals. Avaya contracted their
space in Santa Clara (130,000 sf). Other significant renewals
included DLA Piper in Palo Alto (118,000 sf) and TeleNav in Santa
Clara (55,000 sf). Facebook continued to grow in Menlo Park,
taking the newly constructed Menlo Gateway Phase I (205,000 sf).
Other new significant transactions included Adobe Systems in
Downtown San Jose (63,000 sf) and Pure Storage in Downtown
Mountain View (45,000 sf).
Even with the increased vacancy and negative absorption, the
average asking rent increased slightly in the third quarter to $4.67
per square foot (psf) on a monthly full service basis from $4.65 psf
in the second quarter and $4.33 psf one year ago. A closer look at
the submarkets reveal 101 Tech Corridor cities commanding the
highest rents (currently averaging $7.72 psf), followed by the West
Valley submarkets ($4.08 psf), and the Central Silicon Valley area
($4.02 psf).
SILICON VALLEY OFFICE
Economics Indicators
Q3 16 Q3 17
12-Month
Forecast
Santa Clara Co. Employment 1,077K 1,090K
Santa Clara Co. Unemployment 3.8% 3.6%
U.S. Unemployment 4.9% 4.4%
Market Indicators (Overall, All Classes)
Q3 16 Q3 17
12-Month
Forecast
Overall Vacancy 8.4% 11.7%
Net Absorption SF 771K -146K
Under Construction SF 5.3M 2.6M
Average Asking Rent * $4.33 $4.67
Overall Net Absorption/Overall Asking Rent (FS)
4-QTR TRAILING AVERAGE
Overall Vacancy
* Rental Rates reflect FS asking $psf/month
*Q3 17 data based on the average of July and August values.
2. MARKETBEAT
Silicon Valley
Office Q4 2016
cushmanwakefield.com | 2
MARKETBEAT
Silicon Valley
Office Q3 2017
$0.00
$1.00
$2.00
$3.00
$4.00
$5.00
$6.00
$0.00
$0.50
$1.00
$1.50
$2.00
$2.50
$3.00
$3.50
$4.00
$4.50
$5.00
2012 2013 2014 2015 2016 2017
ClassBDirect
ClassADirect
Class A Direct Class B Direct
615
173
94
81
0-5K
5-10K
10-20K
20K+
963
Listings
$0
$1
$2
$3
$4
$5
$6
$7
$8
$9
$10
MP MV PA Sun LA Cup SC W SJ Cam LG/Sar Airpt DT N SJ Al/CC Mil Fre S SJ
Outlook
The current average asking rent of $4.67 PSF (full service) is
up 7.9% from one year ago. We expect average rents to
flatten across the Valley as the concentration of deals will be
in lower rent markets.
Net absorption in Q3 was a negative –146,000 sf, an increase
from the negative –859,000 sf recorded in Q2.
We anticipate that activity will improve during the remainder
of 2017 and into 2018. Tenant demand remains strong at
10.9 MSF of active office/R&D requirements.
Investor demand for Silicon Valley product remained strong,
particularly for well-located, modern buildings with long-term
tenancy in place. The top transaction in the second quarter was
the sale of phase III of Menlo Equities’ Santa Clara campus (three
buildings totaling 940,000 sf). These buildings are currently leased
to Palo Alto Networks. Other notable deals were the purchase by
AEW Capital Management of 303 Almaden Blvd in Downtown San
Jose (166,000 sf) and the purchase by San Jose Gateway Place,
Inc. of 2025 Gateway Place in the Airport submarket (158,000 sf).
New product under construction across the region currently stands
at approximately 2.6 msf. This breaks down to 2.0 msf of
speculative product and 666,000 sf of build-to-suit product.
Approximately 273,000 sf of speculative product delivered in the
third quarter which included Creekside Way in Campbell (178,000
sf) and 599 Castro in Downtown Mountain View, which was
partially leased by Pure Storage as mentioned above (95,000 sf).
Although 2017 has been lackluster, we anticipate that activity will
improve during the remainder of 2017 and into 2018. Demand is
healthy for Class A product and major employers continue to
increase their R&D spend. We are currently tracking 10.9 msf of
active office/R&D tenant requirements for occupancy over the next
18-24 months. Rent growth, however, is expected to flatten across
the Valley as long as sublease inventory remains at an elevated
level and as new speculative product comes online.
Average Asking Rate by Submarket (FS)
NORTHERN CITIES COMMANDING HIGHEST RENTS
Availabilities by Size Segment
LACK OF SUPPLY FOR QUALITY LARGE BLOCK SPACE
Average Direct Asking Rate by Class (FS)
CLASS A DIRECT RENTS INCREASED 49% SINCE 2012
VACANCY CONTINUES TO INCREASE IN Q3 TO
11.7% DUE TO INCREASED SUBLEASE SPACE
AND THE COMPLETION OF SPECULATIVE
PROJECTS
3. MARKETBEAT
Silicon Valley
Office Q4 2016
cushmanwakefield.com | 3
MARKETBEAT
Silicon Valley
Office Q3 2017
SUBMARKET
INVENTORY
(SF)
SUBLET
VACANT
(SF)
DIRECT
VACANT
(SF)
VACANCY
RATE
CURRENT
NET ABSORP
(SF)
YTD NET
ABSORPTION
(SF)
UNDER
CONST (SF)
OVERALL
AVERAGE
ASKING
RENT (ALL
Classes)
OVERALL
AVERAGE
ASKING
RENT
(CLASS A)
Menlo Park 4,710,106 88,816 203,844 6.6% 181,232 153,086 1,012,400 $8.70 $8.85
Palo Alto 10,305,281 224,361 349,064 5.6% (2,959) 260,464 119,091 $7.45 $8.81
Los Altos 1,127,550 17,700 48,575 5.9% 847 6,565 0 $5.32 $5.15
Mountain View 5,044,336 516,351 259,503 15.4% (4,780) (501,307) 0 $7.54 $7.97
Cupertino 4,450,287 78,627 86,138 3.7% (23,457) (16,292) 0 $4.58 $4.80
Campbell 2,624,163 80,626 392,647 18.0% 6,910 (85,220) 0 $4.00 $4.12
Los Gatos/Saratoga 2,396,023 44,021 85,471 5.4% (18,966) 3,809 0 $3.63 $3.95
West San Jose 4,187,792 37,943 205,448 5.8% (4,540) 71,455 284,000 $4.14 $4.91
Sunnyvale 10,858,556 232,571 99,314 3.1% (93,833) 344,571 350,663 $5.37 $5.91
Santa Clara 10,279,144 1,159,581 1,969,739 30.4% (80,770) (725,419) 150,000 $4.48 $4.60
San Jose Airport 4,340,878 365,316 841,637 27.8% (50,141) (35,752) 153,112 $3.58 $3.75
North San Jose 4,952,777 65,233 620,324 13.8% (24,849) 90,947 574,250 $3.20 $3.43
Alameda/Civic Center 2,181,059 3,340 65,638 3.2% 14,751 17,700 0 $2.55 $4.18
South San Jose 1,826,940 11,670 66,105 4.3% (9,900) 81,379 0 $2.16 $3.00
Downtown San Jose 8,613,709 124,306 1,005,373 13.1% (77,495) (1,719) 0 $3.53 $4.03
Milpitas 979,437 1,825 44,880 4.8% 13,818 41,310 0 $2.54 $2.19
Fremont 1,991,750 4,583 75,877 4.0% 8,339 8,768 0 $2.34 $2.50
CLASS BREAKDOWN
Class A 46,794,300 2,636,080 4,280,533 14.8% 4,258 (32,732) 2,643,516 N/A $4.96
Class B 19,206,783 339,395 1,215,714 8.1% (62,604) (109,791) N/A N/A N/A
TOTAL 80,869,788 3,056,870 6,419,577 11.7% (146,268) (266,130) 2,643,516 $4.67
Asking rates converted to FS
Key Lease Transactions Q3 2017
PROPERTY SF TENANT LANDLORD TRANSACTION TYPE SUBMARKET
100 Independence Dr 205,222 Facebook Bohannon Development Expansion Menlo Park
4655 Great America Pkwy 130,460 Avaya Prudential Contraction Santa Clara
2000 University Ave 118,167 DLA Piper Columbia Property Trust Renewal Palo Alto
10 Almaden Blvd 63,254 Adobe Systems KBS Realty Advisors Expansion Downtown San Jose
4655 Great America Pkwy 54,635 TeleNav, Inc. Prudential Renewal Santa Clara
599 Castro St 45,000 Pure Storage, Inc. Sobrato Development New Lease Mountain View
Key Sales Transactions Q3 2017
PROPERTY SF BUYER SELLER PRICE SUBMARKET
3333 Scott Blvd Phase III 940,564 CBRE Global Investors Menlo Equities, LLC $610,000,000 / $648 Santa Clara
303 Almaden Blvd 166,361 AEW Capital Management Four Corners/Rockwood $80,150,000 / $482 Downtown San Jose
2025 Gateway Place 158,332 San Jose Gateway Place, Inc. Westport Capital Partners $41,900,000 / $265 Airport
1601 Civic Center Dr 30,000 K&K Outdoor Advertising LLC Flaig Family Trust $7,750,000 / $258 Santa Clara
355-365 Woodview Ave 20,922 Kellogg Family LLC Cochrane Business Ranch $3,800,000 / $181 Morgan Hill