
Recommended
Recommended
More Related Content
Similar to Q1 2017 Sacramento Office Market Update
Similar to Q1 2017 Sacramento Office Market Update (20)
Recently uploaded
Recently uploaded (20)
Q1 2017 Sacramento Office Market Update
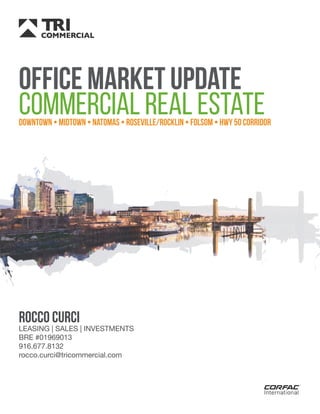
- 1. Office Market Update Commercial Real Estate Rocco Curci LEASING | SALES | INVESTMENTS BRE #01969013 916.677.8132 rocco.curci@tricommercial.com Downtown • Midtown • Natomas • Roseville/Rocklin • Folsom • Hwy 50 Corridor
- 2. National Office Market Quarter One 2017 1 9.7% Vacancy Suburban YTD Net Absorption 12.0M SF CBD YTD Net Absorption (1.3M) SF Suburban Rent $1.90 $0.01 Increase from Q4 Price Per SF Cap Rate < 50K SF 50K - 249K SF $197.87 7.38% $212.46 6.99% 250K - 499K SF $287.79 5.30% > 500K SF $372.84 4.27% Sale Analysis By Building Size CBD: Central Business District - “Downtown” Flat Since Q4 CBD Rent $2.66 $0.02 Increase from Q4 CoStar Group, Inc. (n.d.). The CoStar Office Report: Q1 2017 - National Office Market. Rent: Quoted as Full Service asking Lease rates per SF per Month
- 3. Milwaukee +1 Minneapolis +1 Oklahoma City +1 Philadelphia +1 Dallas Denver Kansas City Miami New York Phoenix Portland Richmond Seattle -1 Market Cycle By Property Type *Quarter Four 2016 1 1 11 16 15 14 12 13 10 9 6 7 8 5 4 3 2 Long Term Occupancy Average Demand & Supply Equilibrium Office - Suburban Health Facility Office - Downtown Industrial - R&D Flex Retail - Power Center Retail - Factory Outlet Apartment Industrial - Warehouse Retail - 1st Tier Regional Mall Retail - Neighborhood / Community Hotel - Full Service Hotel - Ltd Service Cost Feasible New Construction Rents Mueller, Glenn R., Ph.D. “Cycle Monitor - Real Estate Market Cycles: Fourth Quarter 2016 Analysis.” Dividend Capital Research (2016): n. pag. Web. Please inquire if you would like to obtain the full Cycle monitor Report from the source 1 1 16 15 14 12 13 10 9 6 7 8 5 4 3 2 Long Term Occupancy Average N. New Jersey Chicago Stamford Washington DC Hartford +1 Baltimore +1 Boston +1 Cincinnati +1 Cleveland +1 Las Vegas +1 Long Island +1 San Antonio +1 St Louis +2 East Bay Honolulu Pittsburgh Riverside Sacramento San Jose Charlotte +1 Columbus +2 Orange County +1 Orlando +1 Palm Beach +1 Richmond +1 Tampa +1 Austin Raleigh Salt Lake City New Orleans +2 San Diego +1 Houston San Francisco +2 11 Nashville +1 +1 Atlanta +1 Detroit +1 Ft Lauderdale +1 Indianapolis +1 Jacksonville +2 Los Angeles +2 Memphis Norfolk +2 Office Market Cycle *Quarter Four 2016 2
- 4. VacancyAsking Lease Rates Net Absorption Q3 2016 Q2 2016 537,204 SF 260,038 SF 3 Q1 2016 Q2 2016 Q3 2016 Q4 2016 Q4 2016 674,522 SF Q1 2016 (119,819) SF Price Per SF Cap Rate < 50K SF 50K - 249K SF $145.89 6.51% $153.14 7.54% 250K - 499K SF $188.96 8.15% > 500K SF $227.89 6.50% Sale Analysis By Building Size CoStar Group, Inc. (n.d.). The CoStar Office Report: Q1 2017 - Sacramento Office Market. Sacramento Office Market Quarter One 2017 Q1 2017 [138,629) SF Q1 2017
- 5. 4 Sacramento Office Top Sales Quarter One 2017 CoStar Group, Inc. (n.d.). The CoStar Office Report: Q1 2017 - Sacramento Office Market. Please inquire if you would like to obtain the full Cycle monitor Report from the source
- 6. Office Trends by Submarket 10 Years in Arrears Downtown Midtown Natomas CoStar Group, Inc. (n.d.). Retrieved April 15, 2017, from http://www.costar.com/ Vacancy Asking Lease Rate
- 7. Office Trends by Submarket 10 Years in Arrears Roseville Folsom Hwy 50 CoStar Group, Inc. (n.d.). Retrieved April 15, 2017, from http://www.costar.com/ Vacancy Asking Lease Rate
- 8. What’s HappeningDowntown SubMkt 2016 and Beyond 400 Capitol Mall Sale November 2016 511K SF Office | $175.5M @ 6.5% Cap 85.7% Leased at Time of Sale Buyer: Starwood Capital Group 1 1 2 801 K St Sale January 2016 337K SF Office | $79.2M @ 7.2% Cap 86% Leased at Time of Sale Buyer: GPT Properties Trust 2 1100-1102 Q St Sale July 2016 152K SF Office | $29.4M @ 7.6% Cap 87.5% Leased at Time of Sale Buyer: The Evergreen Company 3 3 520 Capitol Mall Sale October 2016 82K SF Office | $28.0M @ 5.98% Cap 91.8% Leased at Time of Sale Buyer: LeFever Mattson 4 4 CA public Utilities Comm Lease August 2016 29,229 SF 300 Capitol Mall - New Lease 6 7 Dept of Managed Health Lease January 2017 27,971 SF 980 9th St - New Lease 7 6 Golden One Center Completion and Opening September 2016 17,000 - 19,000 Capacity $558.2M Project Cost 8 Sawyer Hotel & Condos Nearing Completion Reached Full Height March 2017 16 Story Mixed Use | Open Summer 17 Dev: Sac Kings & JMA Ventures, LLC 9 10 8 Superior Court of CA Lease March 20176 28,881 SF 816 6th Street - New Lease 5 5 Railyard Redevelopment Approval Construction Targeted to Start 2018 200 Acre Former Railyard Residential, Retail, & Soccer Stadium 10 9
- 9. Average Lease Rate Current average asking full service gross lease rate for this submarket. $2.49 9.2% 19.4K SF Net Absorption SF of space that was occupied at the end of period minus SF occupied the previous period Vacancy Rate Average vacancy rate across all office buildings located within this Total Rentable Building Area Square feet of office space currently constructed within this submarket Vacant Square Feet Square feet of space vacant and available for non-sublease tenancy 1.78M 19.99M Leasing CoStar Group, Inc. (n.d.). Retrieved April 11, 2017, from http://www.costar.com/ Number of Transactions $352M Transaction Dollar Volume Average Price 23 $17.6M Average Price Per BLDG SF $274.89 6.3% Average Cap Rate Sales << Jan 16 through Mar 17 6 Downtown Submarket Quarter One 2017
- 10. What’s HappeningMidtown SubMkt 2016 and Beyond 2901-2929 K St Sale September 2016 63K SF Off/Retail | $8.0M @ 9.5% Cap 94% Occupied at Time of Sale Buyer: Rakesh K Dhir 1 1 2 1515 19th St Sale January 2017 25K SF Office | $3.15M @ $126 SF 67% Leased at Time of Sale Buyer: Thomas Brown 2 1909 H St Lease Dec 2016 7,823 SF @ 2.50 NNN Effective Tenant: WU Inc. 3 5 2401-2407 J St Lease August 2016 7,138 SF @ $2.83 FS Effective Tenant: Cook Brown LLP 4 4 1401 21st Lease October 2016 3,601 SF @ $2.00 NNN Effective Tenant: Midtown PBID 5 1625 19th St Apartment & Retail Project Start Construction Underway 70 Apartment Units 2,000 SF of Retail 6 19J Residential Project Construction Start Construction Aimed to Start May 2017 11-Story Residential 19th & J St 7 6 7 3
- 11. Average Lease Rate Current average asking full service gross lease rate for this submarket. $2.05 6.2% 1.1K SF Net Absorption SF of space that was occupied at the end of period minus SF occupied the previous period Vacancy Rate Average vacancy rate across all office buildings located within this Total Rentable Building Area Square feet of office space currently constructed within this submarket Vacant Square Feet Square feet of space vacant and available for non-sublease tenancy 310K 4.99M Leasing CoStar Group, Inc. (n.d.). Retrieved April 11, 2017, from http://www.costar.com/ Number of Transactions $30.59M Transaction Dollar Volume Average Price 35 $1.8M Average Price Per BLDG SF $170.41 6.35% Average Cap Rate Sales << Jan 16 through Mar 17 8 MiDtown Submarket Quarter One 2017
- 12. What’s Happening Natomas Submkt 2016 and Beyond 1 1 2 2480 Natomas Park Sale December 2016 49K SF Office | $9.0M @ 6.99% Cap 100% Leased at Time of Sale Buyer: River City Bank 2 3 3 CA Dept of Food & Ag Renewal August 2016 76,000 SF 2800 Gateway Oaks Dr 5 5 SUtter Health Lease October 2016 28,615 SF 2890 Gateway Oaks Dr 6 6 Samuel Merritt College Lease October 2016 Renewed 19,356 SF Expanded additional 20,405 SF 2710 N Gateway Oaks Dr 7 7 New Proposed 60,000 SF Office Development 2500 River Plaza Dr Dev: Perkins, Williams, & Cotterill Plans Submitted 8 Hilton Garden INn N. Natomas Construction to Start Start Slated by Year End 2017 $20M | 124 Room | Pool, Bar, and Gym Developer: WS Management, Inc. 9 9 8 CA Dept of Human Assist Lease August 2016 81,255 SF @ $1.39 SF + Util. Effective New Lease 4450 E Commerce Way 4 4RIver Plaza & South Natomas Portfolio Sale February 2017 317K SF Office | $43M @ $135.74 SF Buyer: TFO USA Limited - Fund Mgr 1 1 Omninet Capital Natomas Portfolio Purchase August 2016 523K SF Office | $60.3M @ $115.10 SF Buyer: Omninet Capital 3 3
- 13. Average Lease Rate Current average asking full service gross lease rate for this submarket. $1.78 14.3% 0.4K SF Net Absorption SF of space that was occupied at the end of period minus SF occupied the previous period Vacancy Rate Average vacancy rate across all office buildings located within this Total Rentable Building Area Square feet of office space currently constructed within this submarket Vacant Square Feet Square feet of space vacant and available for non-sublease tenancy 988K 6.92M Leasing CoStar Group, Inc. (n.d.). Retrieved April 11, 2017, from http://www.costar.com/ Number of Transactions $21.44M Transaction Dollar Volume Average Price 10 $2.7M Average Price Per BLDG SF $122.82 6.99% Average Cap Rate Sales << Jan 16 through Mar 17 10 Natomas Submarket Quarter One 2017
- 14. Slate Creek Corp Center Sale December 2016 147K SF Office | $23.2M @ $157.18 SF 3300, 3400, 3500 Douglas Buyer: Ridge Capital, Inc. 1 1 2 1101 Creekside Ridge Sale November 2016 86K SF Office | $16.05M @ 9.0% Cap Investment Purchase - 1031 Exchange Buyer: Beard Land Improvement Co 2 Lava Ridge Portfolio Sale October 2016 183K SF Office | $27.6M @ $150.42 SF 3 Bldg: 2990, 3000, & 3010 Lava Ridge Buyer: Barker Pacific Group 3 3 Olympus Corp Center Sale January 2017 191K SF Office | $33.9M @ $177 SF 3001, 3005, 3009, 3013 Douglas Buyer: Barker Pacific Group 4 4 3735 Placer Corporate Lease February 2017 39,869 SF Flex / Office Building Built in 2006 Tenant: JLM Energy, Inc. 5 201 Creekside Ridge Lease October 2016 9,514SF for 7 Year Term Class B Building Built 2005 Tenant: LSA & Associates 6 6 1011 Sunset SubLease February 2017 14,128 SF Sublessor: Esurance Sublesse: Undisclosed 7 7 Adventist Health HQ Targeted Completion Summer 2018 233,000 SF Class A Office Project $100M Project Cost Projection Approx. 1,000 Employee Campus 8 8 UC Med Center Build to Suit 65,000 SF Build to Suit Near California Backyard Louis Pappas Investments Rumor of Potential Construction Start 9 9 Placer Vineyards Final Approval secured 5,230 acre project 14,132 homes, 165 acres commercial 6,000 acres of open space preserved 10 10 5 What’s HappeningRoseville Rocklin 2016 and Beyond
- 15. Average Lease Rate Current average asking full service gross lease rate for this submarket. $1.79 9.5% -5.7K SF Net Absorption SF of space that was occupied at the end of period minus SF occupied the previous period Vacancy Rate Average vacancy rate across all office buildings located within this Total Rentable Building Area Square feet of office space currently constructed within this submarket Vacant Square Feet Square feet of space vacant and available for non-sublease tenancy 1.22M 12.83M Leasing CoStar Group, Inc. (n.d.). Retrieved April 11, 2017, from http://www.costar.com/ Number of Transactions $90.19M Transaction Dollar Volume Average Price 49 $2.6M Average Price Per BLDG SF $186.18 6.78% Average Cap Rate Sales << Jan 16 through Mar 17 14 Roseville & Rocklin Submarket Quarter One 2017
- 16. What’s HappeningFolsom Submarket 2016 and Beyond © Copyright 2016 - Rocco Curci - TRI Commercial Real Estate Services, Inc. - This map contains information from sources we believe to be reliable, but we make no representation, warranty, or guaranty of its accuracy. This map is published strictly for the use of Rocco Curci of TRI Commercial and his clients. Redistribution of this document is strictly prohibited. 90 Blue Ravine Sale November 2016 51K SF Office | $4.95M @ $96.15 SF Owner User Purchase - Vacant Buyer: Inductive Automation 1 1 2 785 Orchard Sale June 2016 41K SF Office | $4.64M @ 2.6% Cap 67% Leased at Time of Sale Buyer: Schwager Davis, Inc 2 2330 E Bidwell Sale June 2016 40K SF Office | $5.20M @ $130.00 SF 80% Leased at Time of Sale Buyer: Individual Investor 3 3 Kaiser Building Sale December 2016 121K SF Med | $51.5M @ 5.25% Cap Lease to Own Buyer: Kaiser Foundation Health Plan 4 4 1743 Creekside Sale August 2016 20K SF Office | $4.55M @ $226.53 Owner will Occupy Majority 5 5 Powerschool Lease January 2016 61,000 SF Goal of 450 Employees 7 7 VoxPro Lease January 2016 15,000 SF expanding to 30,000 SF Goal of 750 employees 8 8 Sutter Urgent Care Lease Opened December 2016 2575 E Bidwell - 3,700 SF Sutter Invested $3.5M 9 9 Folsom Ranch Approved Development 10K + Housing Units, 2.4M SF Retail, 3.6M SF Office & Commercial, 1,000 Acres reserved open space 10 72 Unit Affordable Housing Project Application Submitted Approximately $14.0M Project Developer: The Pacific Cos 11 11 10 950 Iron Point Lease March 2017 15,808 SF Tenant Undisclosed at this Time 6 6
- 17. Average Lease Rate Current average asking full service gross lease rate for this submarket. $1.89 8.4% 3.2K SF Net Absorption SF of space that was occupied at the end of period minus SF occupied the previous period Vacancy Rate Average vacancy rate across all office buildings located within this Total Rentable Building Area Square feet of office space currently constructed within this submarket Vacant Square Feet Square feet of space vacant and available for non-sublease tenancy 440K 5.22M Leasing CoStar Group, Inc. (n.d.). Retrieved April 11, 2017, from http://www.costar.com/ Number of Transactions $84.52M Transaction Dollar Volume Average Price 18 $4.9M Average Price Per BLDG SF $247.12 6.27% Average Cap Rate Sales << Jan 16 through Mar 17 16 Folsom Submarket Quarter One 2017
- 18. 10391 Peter A MCCuen Sale March 2017 110K SF Office | $27M @ $243.33 SF See #5 - Sutter Health Renewed Prior Buyer: Rich Uncles REIT 1 3100 Zinfandel Sale December 2016 124K SF Office | $16.3M @ 8.90% CAP 87% occupied at Time of Sale Buyer: Ethan Conrad 2 2 3075 Prospect Park Sale March 2017 99K SF Office | $10.5M @ $106.15 SF 61.8% Leased at Time of Sale Buyer: R. Scott Rasmussen 3 3 Regent’s Park Sale December 2016 141K SF Office | $8.63M @ 7.31% Cap High vacancy Buyer: Dan Caputo Company 4 4 SUtter Health Renewal March 2017 106,592 SF Exp 2025 10391 Peter A McCuen Blvd Tenant: Sutter Health 5 5 10811 International Lease February 2017 55,192 SF Exp 2022 New Lease Tenant: Undisclosed 6 6 8810 Cal Center Lease March 2017 21,615 SF Class B Building Built 1989 Tenant: Gurnick Academy 7 7 Aerojet Relocating or Eliminating 1,100 Positions 1,100 to 1,400 Positions Eliminating or Relocating to Huntsville, Alabama 8 Gold Point Corp Center Listed For Sale 2 Class A Buildings - 100% Occupied 171K SF Office Asking $35.5M @ 7.0% Cap 9 9 8 1 What’s Happening Hwy 50 Corridor 2016 and Beyond
- 19. Average Lease Rate Current average asking full service gross lease rate for this submarket. $1.59 15.2% -12K SF Net Absorption SF of space that was occupied at the end of period minus SF occupied the previous period Vacancy Rate Average vacancy rate across all office buildings located within this Total Rentable Building Area Square feet of office space currently constructed within this submarket Vacant Square Feet Square feet of space vacant and available for non-sublease tenancy 2.72M 17.95M Leasing CoStar Group, Inc. (n.d.). Retrieved April 11, 2017, from http://www.costar.com/ Number of Transactions $116.9M Transaction Dollar Volume Average Price 18 $6.9M Average Price Per BLDG SF $140.87 7.65% Average Cap Rate Sales << Jan 16 through Mar 17 18 Highway 50 Corridor Submarket Quarter One 2017
- 20. Rocco Curci LEASING | SALES | INVESTMENTS BRE #01969013 916.677.8132 rocco.curci@tricommercial.com #CREobsessed © Copyright 2016 - Rocco Curci, TRI Commercial Real Estate Services, Inc. All Rights Reserved The Information in this document was obtained from sources we deem reliable; however, no warranty or representation, expressed or implied, is made as to the accuracy of the information contained herein.