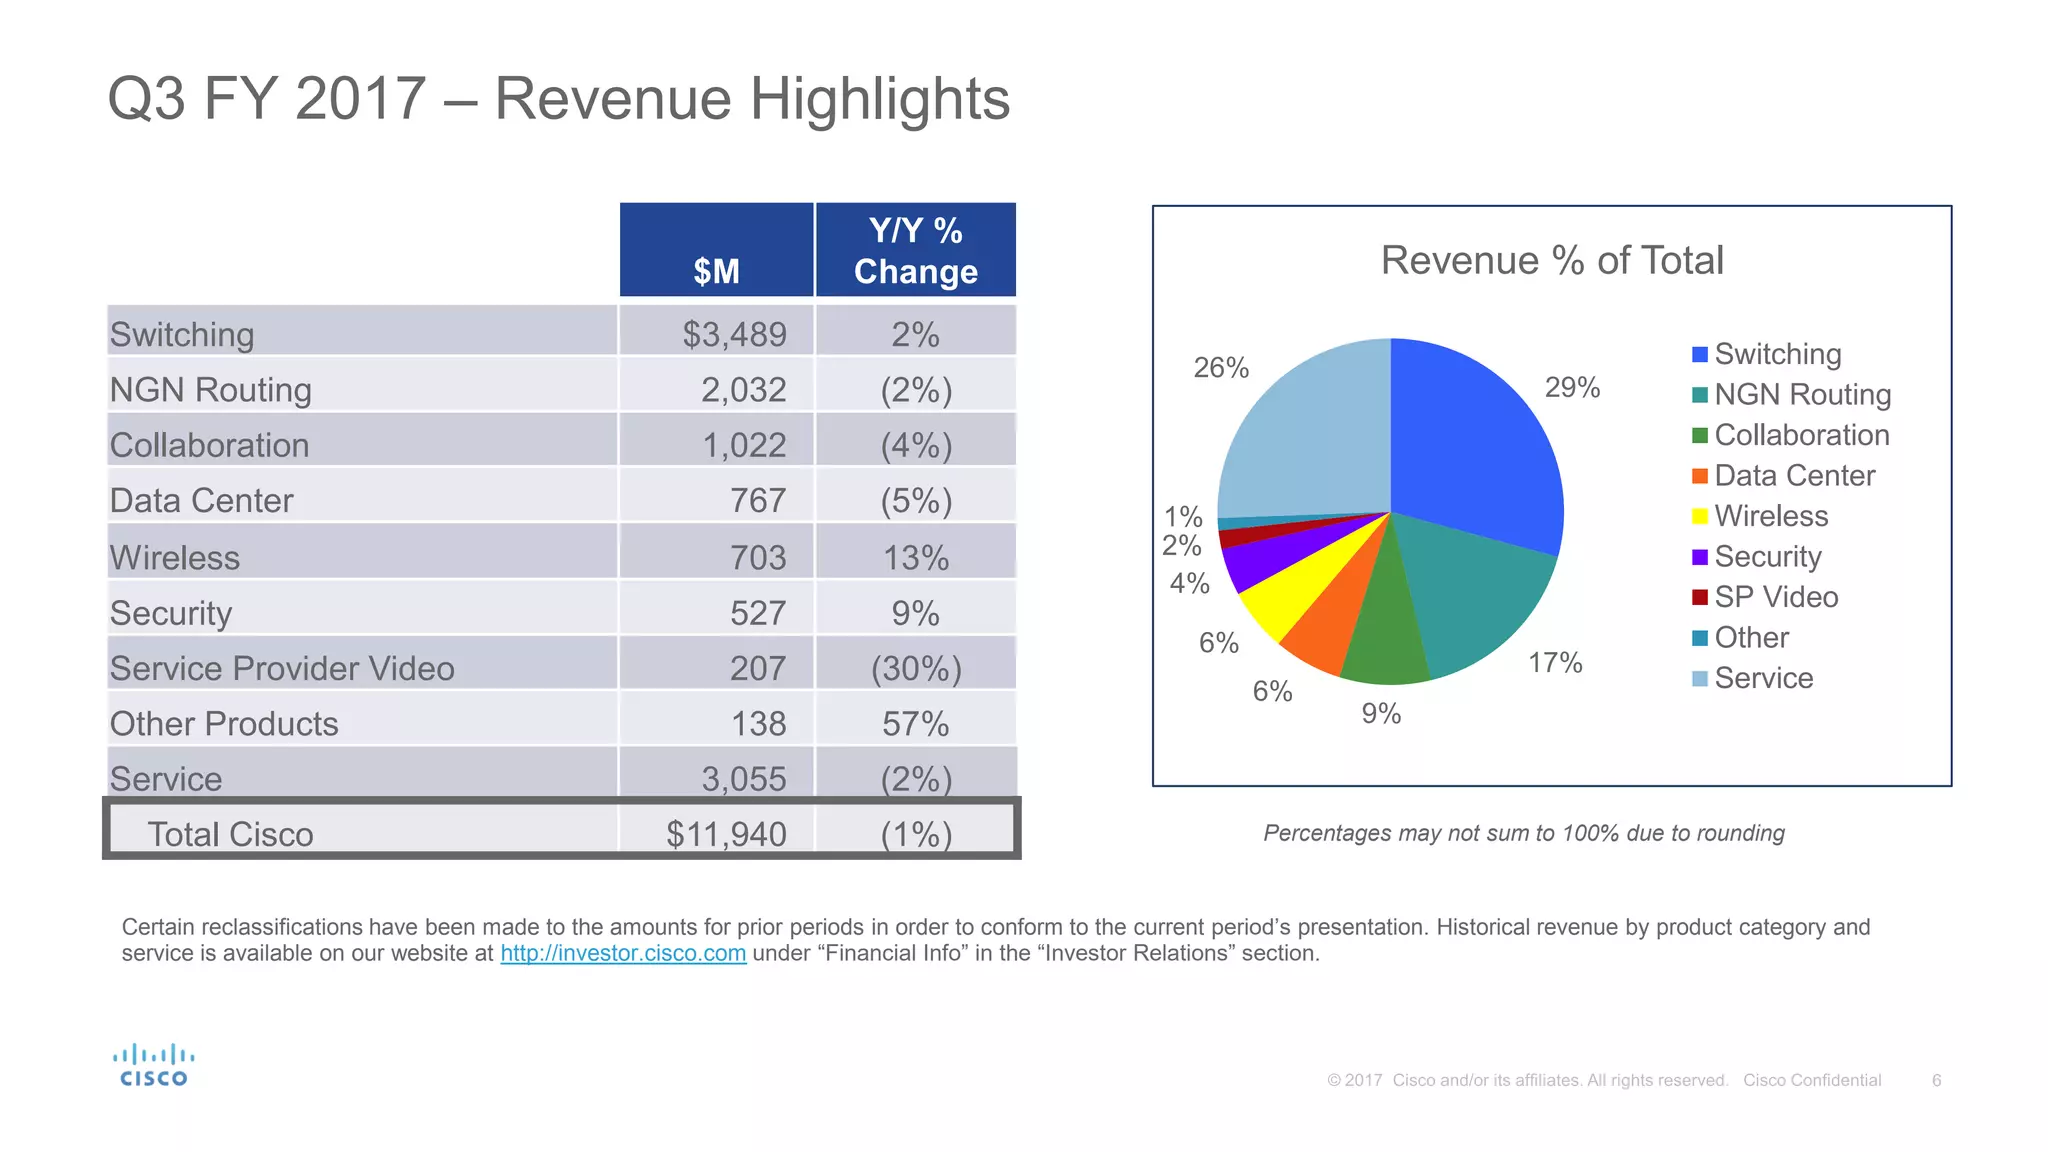
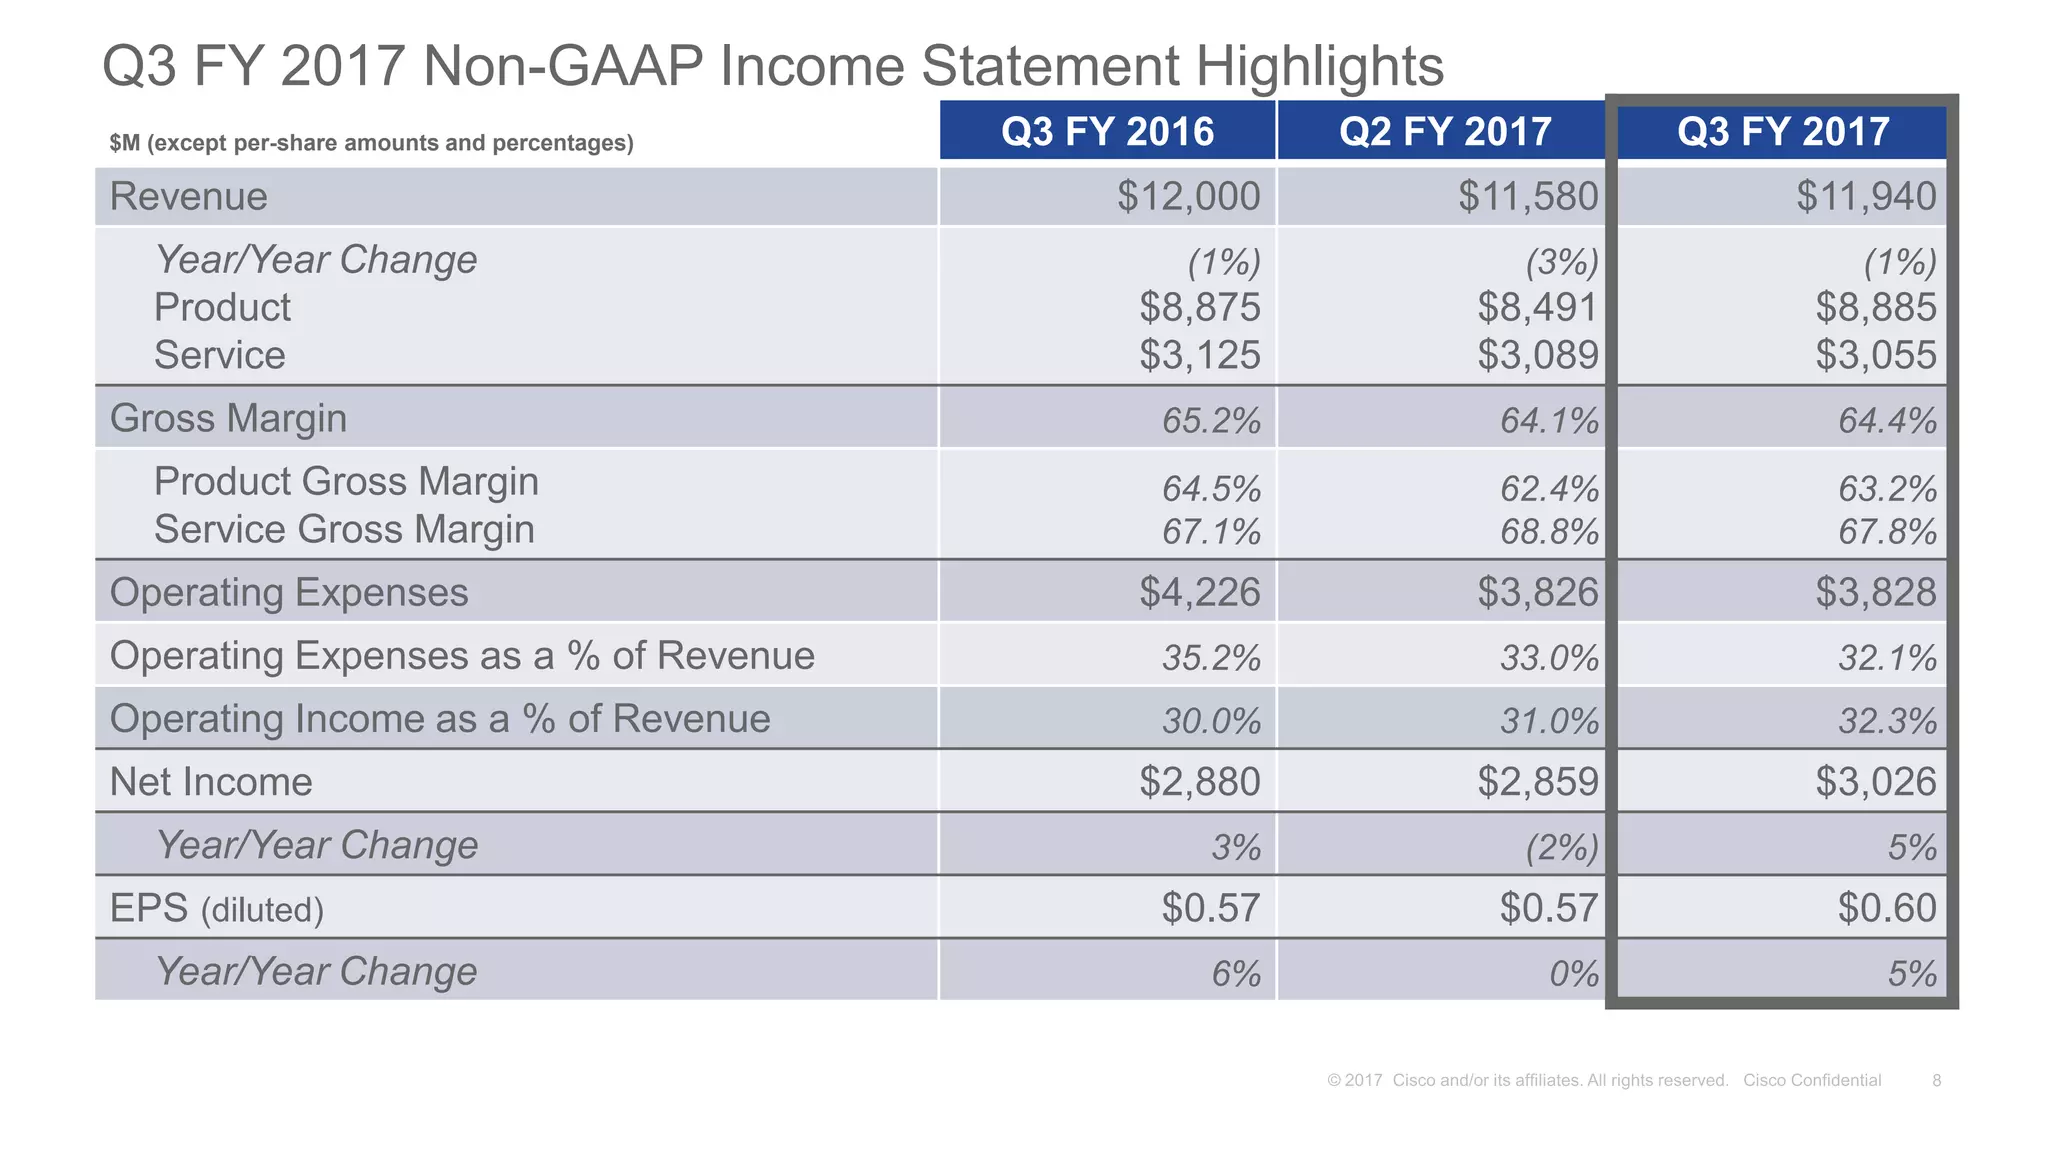
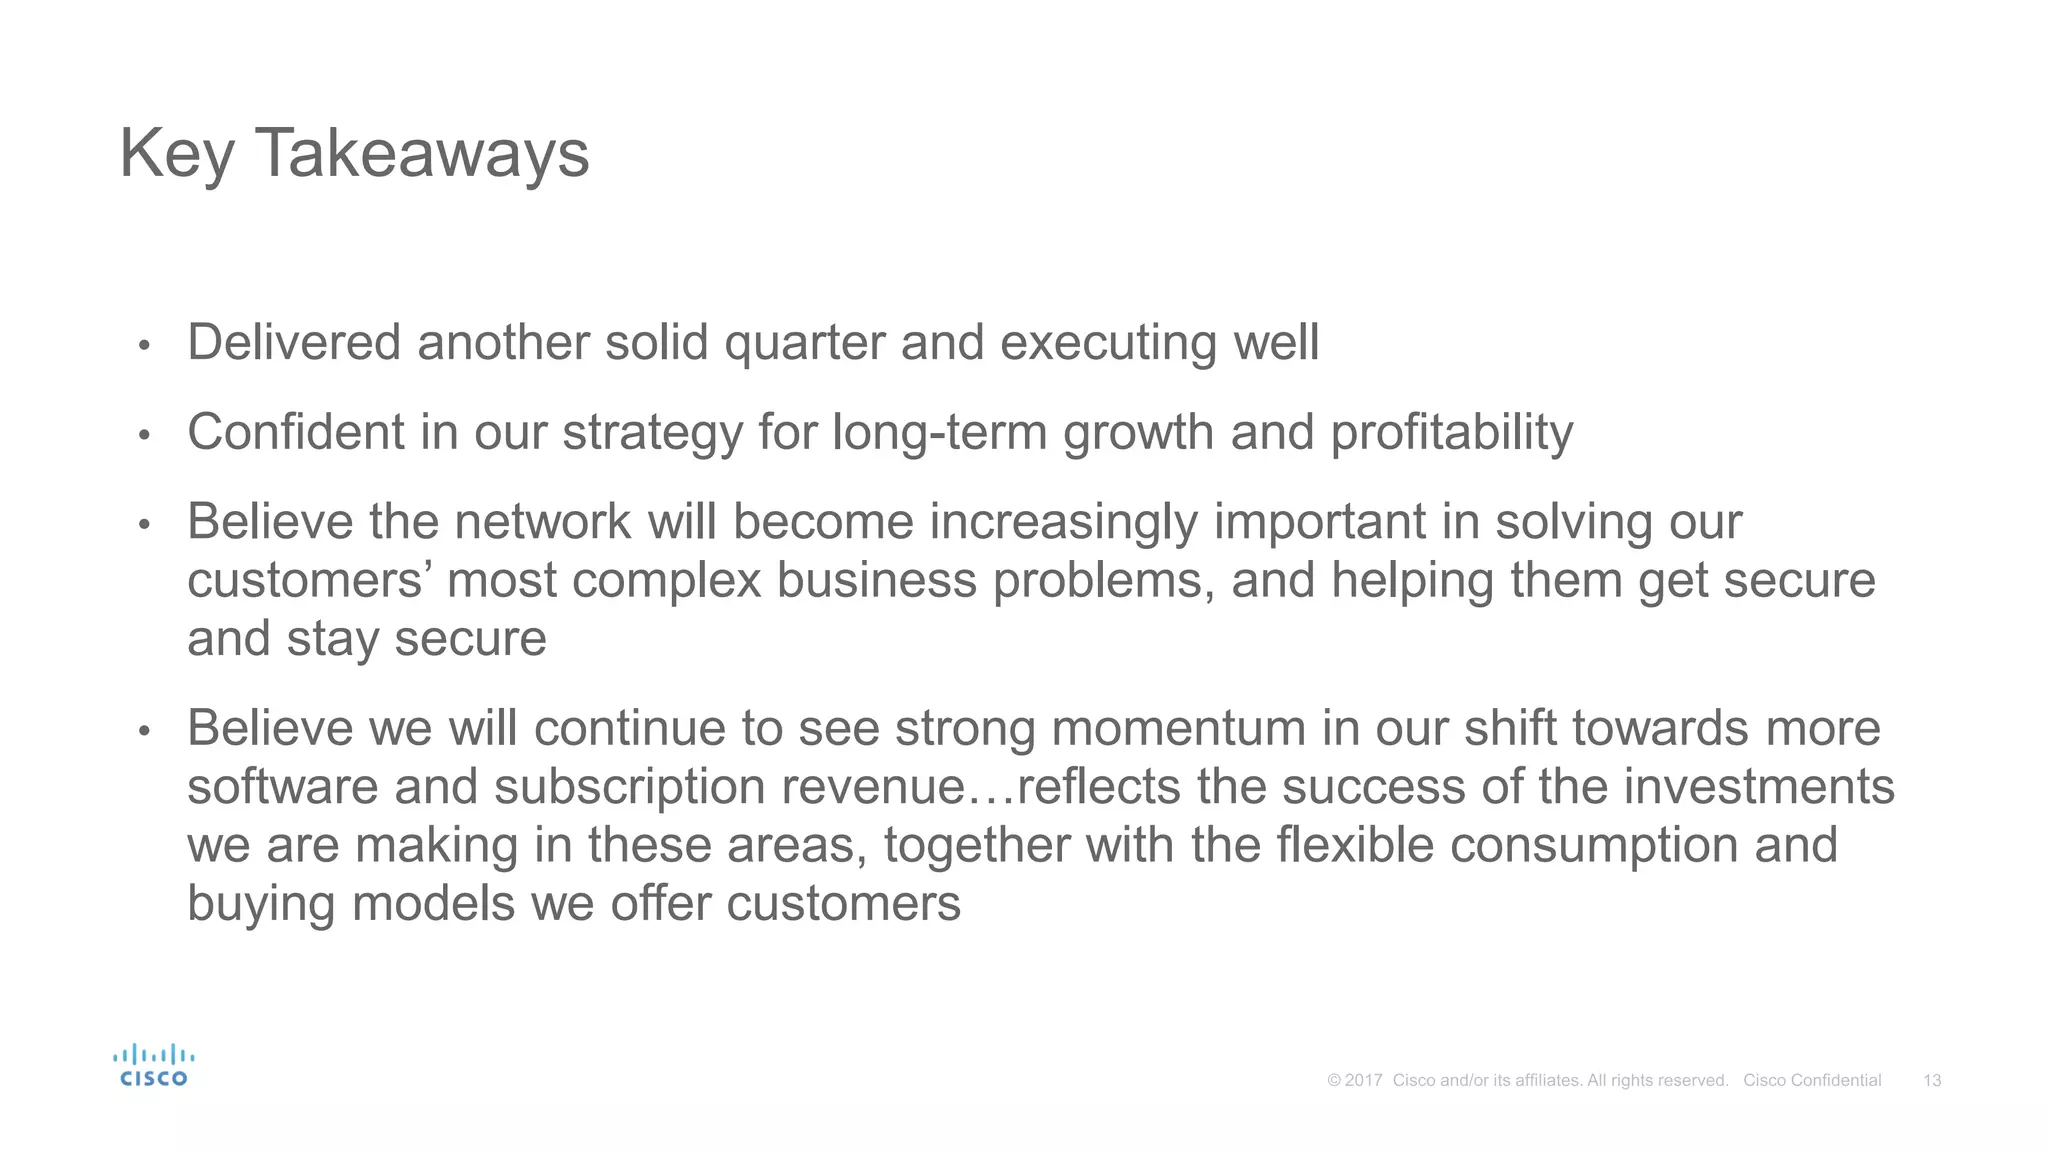
This document provides a summary of Cisco's Q3 Fiscal Year 2017 conference call. The call highlighted Cisco's financial results for Q3 2017, including total revenue of $11.9 billion, down 1% year-over-year, and non-GAAP EPS of $0.60, up 5% year-over-year. Cisco also discussed key business trends, such as its continued transition to more software and subscription revenue through investments in areas like analytics. Finally, Cisco expressed confidence in its strategy for long-term growth and profitability and in continuing to execute well.
ADP reported 6% revenue growth and 6% adjusted diluted EPS growth for the first quarter of fiscal year 2018. Key highlights included a 160 basis point improvement in client retention, 14% revenue growth for PEO services with a 10% increase in average worksite employees, and continued investments in innovation, service, and distribution. For fiscal year 2018, ADP expects 6-8% revenue growth, adjusted EBIT margin expansion, and 5-7% growth in adjusted diluted EPS.
- The company reported Q3 FY2017 revenue of $191.8 million, up 67% year-over-year, with billings of $234.1 million, up 47% year-over-year.
- As of Q3 FY2017, the company had 6,172 total customers, up 98% year-over-year, including 521 Global 2000 customers.
- The company's cash and short-term investments totaled $350 million as of Q3 FY2017, with cash flow from operations of $7.9 million for the fiscal year-to-date and free cash flow of -$30 million for the same period.
ADP reported solid financial results for fiscal 2017, with 6% revenue growth and 13% adjusted EPS growth. Revenue increased to $12.4 billion and adjusted EBIT grew 8% to $2.4 billion. New business bookings were softer due to strong prior year bookings from ACA-related sales. For fiscal 2018, ADP expects 5-7% revenue growth, adjusted EBIT margin expansion, and 2-4% growth in adjusted diluted EPS. ADP will continue investing in innovation, service, and sales while returning capital to shareholders through dividends and share repurchases.
- Box reported financial results for the first quarter of FY18, with revenue of $117.2 million, up 30% year-over-year. Billings were $99.6 million, up 31% year-over-year. Deferred revenue was $224.3 million, up 30% year-over-year.
- Box saw continued growth in paying customers to 74,000, with 64% of Fortune 500 companies now using Box. New products like KeySafe and Relay (beta) provide further differentiation.
- Box improved operating margins through efficiencies, with non-GAAP operating expenses declining to 54% of revenue compared to 60% in the prior year. Box expects to stabilize gross
Rockwell Automation is a global company dedicated to industrial automation and information. It has over 22,000 employees in over 80 countries and had $5.9 billion in fiscal year 2016 sales. The company focuses on helping customers achieve faster time to market, improved asset utilization, lower total cost of ownership, enterprise risk management, and business value through its control products and solutions and architecture & software segments. Rockwell aims to achieve above-market revenue growth, superior returns on investment for its customers, and consistent return of cash to its shareholders.
Cisco held its Q1 FY 2018 conference call on November 15, 2017 to discuss financial results. Key highlights included total revenue of $12.1 billion, non-GAAP earnings per share of $0.61, and growth in security revenue and deferred revenue. All geographic regions returned to order growth during the quarter. Cisco is also working with Google to develop a new hybrid cloud solution and over 1,100 customers adopted its Catalyst 9000 switching platform in the past three months.
ADP reported financial results for the third quarter of fiscal year 2017. Total revenues increased 5% to $3.2 billion, while pretax earnings from continuing operations increased 12% to $0.79 billion. Diluted earnings per share from continuing operations increased 4% to $1.17. The company also provided an outlook for fiscal year 2017, forecasting 6% revenue growth and an increase in adjusted diluted EPS from continuing operations of 13-14%.
The document summarizes Ingersoll Rand's 2017 Investor & Analyst Day. It provides an overview of the company, highlights its strong and improving financial performance, and outlines its strategy and outlook for continued sustainable performance through 2020. Ingersoll Rand's businesses are well positioned due to its leading brands and market positions. The company's business operating system delivers results through a focus on sustainability, innovation, employee engagement and operational excellence.
Intuit Overview document from May 2017 provides:
- Forward-looking statements are subject to risks and uncertainties outlined in SEC filings.
- Intuit's strategy focuses on delivering awesome product experiences using data, enabling contributions from partners, and being the operating system behind SMB success and doing the nation's taxes.
- Intuit has transitioned successfully from a product to a platform company, growing connected services revenue over 36% annually while maintaining overall revenue growth.
This document provides a summary of Nielsen's Q1 2017 earnings results. Key points include:
- Revenue was $1.53 billion, up 3.2% in constant currency. Watch segment revenue grew 11.1% driven by total audience and Gracenote. Buy segment revenue declined 3.7% with challenges in developed markets.
- Adjusted EBITDA was $422 million, up 4.7% in constant currency.
- Nielsen reiterated its full-year 2017 guidance.
Investor roadshow presentation february 2016 final-v2TrueBlueInc
The document provides forward-looking statements and guidance for fiscal year 2016. It states that certain statements made are forward-looking and subject to risks and uncertainties that could cause actual results to differ materially. It then provides an outlook for fiscal year 2016 including total revenue growth of approximately 15% to $3.1 billion, adjusted EBITDA growth of approximately 30% to $190 million, and adjusted EPS of approximately $2.65. It also notes acquisitions completed in 2015 and 2016 that contribute to the projected revenue and earnings.
Aon plc reported its third quarter 2017 results on October 27, 2017. Key metrics included 2% organic revenue growth, a 170 basis point increase in operating margin to 20.3%, and 18% growth in earnings per share to $1.29. Aon is accelerating its strategy of investing in high-growth, high-margin areas through the divestiture of outsourcing businesses and reinvesting the $3 billion in proceeds.
Q2 fy17 earnings slides final no guidance1ir_cisco
This document summarizes Cisco's Q2 FY 2017 conference call. Some key highlights include:
- Total revenue was $11.6 billion, down 2% year-over-year. Non-GAAP EPS was flat at $0.57.
- Cisco continues shifting toward software and recurring revenue, with 51% year-over-year growth in product deferred revenue related to recurring software/subscriptions.
- Cisco delivered strong innovation in key areas like security, collaboration, and next-gen data center.
- Cisco continues returning value to shareholders, including a 12% dividend increase to $0.29 per share. Cisco also announced its intent to acquire AppDynamics to provide customers with deep analytics across networks
This presentation from Cisco discusses the company's financial strategy and performance. It notes that Cisco aims for profitable growth through strategic investments and capital returns. Cisco is executing on shifting more of its software offerings to subscription models to drive recurring revenue and continuing to deliver earnings per share growth during this transition. The presentation also provides projections for Cisco's revenue, software revenue, recurring revenue, and deferred revenue through FY20 that indicate continued growth.
The document is an investor presentation for Canadian Tire Corporation that provides an overview of the company and its various business segments. It discusses the company's strengths, growth plans, and financial highlights for its retail banners (Canadian Tire, FGL Sports, and Mark's), CT REIT, and Canadian Tire Bank. The presentation outlines strategies to strengthen its core retail businesses, engage younger customers, expand digital capabilities, and pursue growth opportunities across its brands and real estate portfolio.
Owens Corning presented information at investor events in June 2017. The presentation discussed Owens Corning's focus on shareholder value and provided an overview of the company's Q2 2017 performance. It summarized the company's three business segments and highlighted its improved portfolio, earnings, cash flow, and macroeconomic drivers. Owens Corning aims to invest in organic growth, pursue value-creating acquisitions, and return cash to shareholders.
Belden is a global company that provides signal transmission solutions through five business platforms: broadcast, enterprise connectivity, industrial connectivity, industrial IT, and network security. The document discusses Belden's financial performance from 2005 to 2015, highlighting improvements in EBITDA margin, return on invested capital, and free cash flow. It also outlines Belden's strategies for continued growth, margin expansion, and shareholder value creation through 2018.
The document is a presentation from Tom Lynch, CEO of TE Connectivity, given at the Citi Global Technology Conference in September 2016. It contains forward-looking statements and discusses non-GAAP measures used. The presentation outlines TE Connectivity's position as a global technology leader in connectivity and sensor solutions serving growing markets. It highlights secular growth drivers across its transportation, industrial, and communications segments driven by trends in connectivity, safety, and sustainability. TE Connectivity is well-positioned for continued organic sales growth and margin expansion through its portfolio transformation, focus on harsh environments and sensors, and operating model improvements.
This document provides an overview of Belden, a global signal transmission solutions company. It discusses Belden's five business platforms that deliver innovative connectivity solutions for broadcast, enterprise, industrial, and network security applications. It highlights Belden's financial performance over time, including improvements in EBITDA margin, return on invested capital, and free cash flow. The document also outlines Belden's strategy for capital deployment, including investing in innovation, acquisitions, and share repurchases. Finally, it provides guidance for Q2 and full year 2016 revenues and earnings per share.
The document provides an agenda and materials for Belden Inc.'s 2016 Investor Day. It includes presentations on Belden's corporate overview, strategy, financials, and individual business segments. Belden confirms its guidance for Q4 2016 and full year 2016, with revenues between $2.355-2.375 billion and EPS between $5.20-5.30. The company discusses its goals for 5-7% revenue growth, 18-20% EBITDA margin, free cash flow greater than net income, and 13-15% ROIC. Belden reviews its proven track record of achieving these goals and driving upper quartile shareholder returns.
Kelly kramer shareholder value draft finalir_cisco
This presentation discusses driving shareholder value at Cisco. It notes that the presentation contains forward-looking statements and projections that are only predictions, and actual results may differ. During the presentation, non-GAAP financial measures will be referenced and a reconciliation to GAAP measures is available on Cisco's website. The presentation goes on to discuss Cisco's competitive advantages in various markets, performance against its financial strategy of revenue and earnings growth with expanding margins, and strategies around operational excellence, research and development portfolio shifts, strong cash flow generation, and driving shareholder returns.
- In the second quarter of fiscal year 2017, the company reported net revenue of $551 million, gross margin of 64.1% excluding special items, and earnings per share of $0.46 excluding special items.
- The company returned $155 million to shareholders in the quarter through $94 million in dividends and $61 million in stock repurchases.
- For the third quarter of fiscal year 2017, the company expects revenue between $555-595 million and earnings per share between $0.49-0.55 excluding special items.
1) The document discusses Ingersoll Rand's performance at an investor conference, noting forward-looking statements and non-GAAP financial measures.
2) It provides an overview of Ingersoll Rand as a 145-year-old industrial company with revenues of $13.5 billion across climate and industrial segments.
3) The presentation highlights Ingersoll Rand's strategy of investing in innovation and acquisitions to drive top-tier revenue growth while improving margins and cash flow through 2020.
ADP reported solid results for the 1st quarter of fiscal year 2017, with 7% revenue growth and strong margin expansion. Revenues increased 7% as reported and 8% on a constant currency basis. Adjusted EBIT margin increased 230 basis points. New business bookings for PEO services were flat compared to the prior year when excluding a single client loss in the consumer health spending account business. ADP reaffirmed its fiscal year 2017 guidance for revenue growth of 7-8% and adjusted diluted EPS growth of 11-13%.
Boston 2016 slides master slides - draft sept2 v2molsoncoorsir
This document summarizes Mark Hunter's presentation at the Barclays Global Consumer Staples Conference on September 7, 2016 as CEO of Molson Coors Brewing Company. The presentation outlines Molson Coors' strategic focus on brand-led growth, cash generation, and capital allocation. It also details how acquiring MillerCoors will double Molson Coors' size, deliver $200M in annual synergies, and over $250M in annual cash tax benefits. The acquisition enhances Molson Coors' commercial capabilities to drive top-line growth through improved insights, innovation, digital capabilities, and customer excellence.
Rockwell Automation is a global company dedicated to industrial automation and information. It has over 22,000 employees, $5.9 billion in fiscal 2016 sales, and serves customers in over 80 countries. The company provides a broad range of industrial automation products and solutions, including control systems, software, industrial networks, safety systems, and more. It focuses on innovation and domain expertise to help customers achieve faster time to market, improved asset utilization, lower total cost of ownership, and enterprise risk management.
1) The document discusses forward-looking statements and non-GAAP financial information presented by Morgan Stanley at its 5th Annual Laguna Conference on September 13, 2017.
2) It provides an overview of Ingersoll Rand, including its history, market capitalization, revenues, business segments, brands, and focus on global megatrends related to climate change, urbanization, and efficiency.
3) Ingersoll Rand has executed a consistent strategy focused on operational excellence, organic growth, dynamic capital allocation, and a winning culture, delivering top-tier revenue growth, margins, cash flow, and returns over recent years.
The document provides an investor presentation for Q1 FY2017. It highlights key metrics such as billings of $240M, up 87% YoY, revenue of $167M, up 90% YoY, and 4,473 customers, up 109% YoY. It also summarizes financial results with revenue of $166.8M for Q1 FY2017, up 19% QoQ and 90% YoY. Billings were $239.8M for Q1 FY2017, up 16% QoQ and 87% YoY. The presentation emphasizes continued strong growth metrics and expanding customer base.
This document provides a summary of Cisco's Q4 Fiscal Year 2016 conference call. Some key points:
- Cisco executed well in Q4 2016 with 2% revenue growth and record non-GAAP earnings per share growth of 9%. For FY2016, revenue was $48.7B, up 3% with record non-GAAP EPS of $2.36, up 8%.
- Orders declined 5% in service provider segment and 6% in emerging markets in Q4, but remained healthy in other segments at 5% growth.
- Cisco is aggressively investing in priority areas like security, IoT, collaboration and cloud regardless of the uncertain macro environment.
- Financial highlights included strong
Cisco reported financial results for its first quarter of fiscal year 2017. Total revenue increased 1% year-over-year to $12.352 billion. Non-GAAP earnings per share grew 3% to $0.61. Service provider orders declined 12% year-over-year, impacting overall product order decline of 2%. Cisco continues to shift its business model to more recurring revenue streams such as software and subscriptions, with product deferred revenue from these areas growing 48% year-over-year. Cisco delivered results in line with its guidance while facing headwinds in some markets.
This document summarizes Cisco's Q3 Fiscal Year 2016 conference call. Some key points:
- Cisco delivered 3% year-over-year revenue growth to $12 billion despite an uncertain macro environment, with strength in security, collaboration, and next generation data center.
- Non-GAAP earnings per share grew 6% year-over-year. Cisco generated over $3 billion in operating cash flow and returned nearly $2 billion to shareholders.
- Momentum continues in key areas like security, collaboration, and transitioning revenue to recurring software and subscription models.
- Cisco provided financial guidance for Q4 FY2016, with projections for further revenue growth and earnings per share.
- Cisco held a Q4 FY2015 conference call to discuss financial results and business trends.
- For Q4 FY2015, Cisco reported record revenues of $12.8 billion and record non-GAAP earnings per share of $0.59.
- Cisco is growing its business and earnings while evolving its portfolio, and returned $8.3 billion to shareholders in FY2015 through buybacks and dividends.
- Cisco held a Q1 FY2016 conference call to discuss financial results and business trends.
- Revenue grew 4% year-over-year to $12.7 billion. Non-GAAP earnings per share grew 9% to $0.59.
- Cisco is making investments to drive growth in cloud, software, and new markets while maintaining profitability.
- Guidance for Q2 FY2016 expects revenue growth of 3-5% year-over-year.
This document summarizes Cisco's Q2 Fiscal Year 2016 conference call. The call discussed Cisco's financial performance for Q2 2016, noting 2% revenue growth and 8% growth in non-GAAP earnings per share. Cisco also provided guidance for the next quarter and discussed key business trends, including momentum in networking, security, cloud-based solutions, and acquisitions. The call included a question and answer session with analysts.
Cisco held a Q3 Fiscal Year 2015 conference call to discuss financial results and business trends. Key highlights included:
- Revenues increased 5% year-over-year to $12.1 billion, and non-GAAP EPS grew 6% to $0.54.
- Switching revenue grew 6% driven by strong demand for the Application Centric Infrastructure portfolio. Data center revenue increased 21%.
- Geographically, Americas and EMEA product orders increased 2% each while APJC returned to 1% growth. Enterprise orders grew 7% and public sector orders grew 7%.
- For Q3, Cisco generated $3 billion in operating cash flow and returned $2.1
- Cisco hosted its Q3 Fiscal Year 2018 conference call on May 16, 2018 to discuss financial results.
- Cisco reported 4% year-over-year revenue growth to $12.46 billion in Q3 2018, with strong performance across products and geographies.
- Recurring revenue grew to 32% of total revenue, up 2 points year-over-year, driven by increased software subscriptions.
- Cisco returned $7.59 billion to shareholders in the quarter through share repurchases of $6.01 billion and dividends of $1.57 billion.
- Cisco hosted its Q2 Fiscal Year 2018 conference call on February 14, 2018 to discuss financial results and business trends.
- Revenue grew 3% year-over-year to $11.88 billion, driven by momentum in intent-based networking and security software.
- Software subscriptions grew 36% year-over-year and now make up 52% of total software revenue.
- Cisco hosted its Q2 Fiscal Year 2018 conference call on February 14, 2018 to discuss financial results and business trends.
- Revenue grew 3% year-over-year to $11.88 billion, driven by momentum in intent-based networking and security software.
- Gross margin was 64.7%, up from 64.1% last year. However, GAAP net income declined due to an $11.1 billion one-time tax charge.
- Masonite reported 3Q16 net sales of $489.6 million, up 3% from 3Q15. Adjusted EBITDA increased 29% to $65.1 million.
- North American residential sales grew 11% due to strength in both retail and wholesale channels. Adjusted EBITDA margin expanded 210 bps.
- Europe sales declined 11% from foreign exchange impacts, but adjusted EBITDA grew 34% driven by portfolio optimization and higher average selling prices.
- Architectural sales grew 3% and adjusted EBITDA margin increased 110 bps from price increases.
- The company remains focused on operational efficiencies, new product innovation, and digital strategies to support long-term growth
This presentation discusses Winnebago Industries' forward-looking statements and risk factors, non-GAAP financial measures, and products. It provides an overview of Winnebago Industries' leadership, strategic priorities, investment thesis, financial performance, and new product introductions across its motorhome, towable, and specialty vehicle segments.
Brink's 4 q&fy 2017 earnings slides final 02062018investorsbrinks
The document discusses Brink's financial results for the fourth quarter and full year of 2017 as well as its outlook for 2018 and 2019. Some key points:
- Revenue grew 13% in Q4 2017 and 10% for the full year, driven by 5% organic growth.
- Operating profit increased 15% in Q4 and 24% for the full year.
- 2018 guidance forecasts further growth with 8% revenue increase and operating profit rising 30-37%.
- The 2019 adjusted EBITDA target is $625 million, up from the initial 2019 target of $475 million set in 2017.
- Growth will come from organic initiatives in the U.S. and acquisitions, with a focus on
This presentation contains forward-looking statements and discusses risks and uncertainties that could cause actual results to differ from projections. It provides an overview of Winnebago Industries' portfolio of outdoor lifestyle brands in RV, marine, and specialty vehicles. The presentation discusses Winnebago's strategic priorities, integrated operating model, investment thesis, growing revenue and market share gains, expanding portfolio and profitability, capital allocation approach, strong balance sheet and liquidity, and the large and growing outdoor recreation industry.
1) The document provides an earnings presentation for 4Q16 and full year 2016 results for Masonite International Corporation. It highlights strong sales growth in North America and Europe, margin expansion, and progress on strategic initiatives.
2) Financial results showed net sales growth of 5.4% in 2016, Adjusted EBITDA growth of 23.7%, and Adjusted EPS growth of over 100%.
3) An outlook is provided for 2017 anticipating continued US housing market growth, sales growth of 7-9%, Adjusted EBITDA of $285-305 million, and Adjusted EPS of $4.10-$4.60.
1) The document provides an earnings presentation for 4Q16 and full year 2016 results for Masonite International Corporation. It highlights strong sales growth in North America and Europe, margin expansion, and progress on strategic initiatives.
2) Key metrics for 4Q16 include 8% normalized sales growth, a 1.6% increase in gross profit, and 6.7% growth in adjusted EBITDA. Full year 2016 sales grew 5.4% with adjusted EBITDA growth of 23.7% and adjusted EPS growth of over 100%.
3) The outlook for 2017 estimates sales growth of 7-9%, adjusted EBITDA of $285-305 million, and adjusted EPS growth of $4.10-$
This presentation discusses advancing semiconductor manufacturing technology. It provides an overview of the company, highlighting its focus on the growing semiconductor market, flexible vertically integrated business model, and key customers. The company has seen strong financial growth in recent years, with revenues increasing 97% and non-GAAP EPS growing 631% from 2015 to 2017. Management believes the company is well-positioned to capitalize on opportunities in the fastest growing segments of the semiconductor market.
This presentation discusses advancing semiconductor manufacturing technology. It begins with forward-looking statements and disclosures. It then highlights the company's strong financial performance over the past 3 years, including 97% revenue growth and 631% increase in non-GAAP EPS. The rest of the presentation focuses on the company's strategy of capitalizing on fast growing segments of the semiconductor market, its flexible business model, key customers enabling growth opportunities, and management's focus on maximizing opportunities in semiconductors.
The document provides an overview of TDS Telecom's fourth quarter 2016 results and strategic priorities for 2017. Key points include:
- 2016 results showed revenue impacts from competition but improvements in churn. Adjusted EBITDA was up 4% excluding discrete items.
- 2017 priorities are protecting the customer base, driving high margin revenue streams, and continuing cost improvements. Investments will focus on network quality and preparing for VoLTE deployment.
- Guidance for 2017 estimates total operating revenues of $3.8-4 billion and adjusted EBITDA of $650-800 million.
This presentation summarizes Internap's 3rd quarter 2016 earnings results. Revenue declined year-over-year primarily due to lower IP connectivity pricing and customer churn. The company reported a large net loss that included a non-cash goodwill impairment charge. Looking forward, the new CEO plans to improve operations, cut costs, and explore ways to recapitalize the business in order to focus on growth. Financial guidance for 2016 was reaffirmed with some minor adjustments to revenue and adjusted EBITDA expectations.
Similar to Q3 fy17 earnings slides final no guidance (20)
ZKsync airdrop of 3.6 billion ZK tokens is scheduled by ZKsync for next week.pdfSOFTTECHHUB
The world of blockchain and decentralized technologies is about to witness a groundbreaking event. ZKsync, the pioneering Ethereum Layer 2 network, has announced the highly anticipated airdrop of its native token, ZK. This move marks a significant milestone in the protocol's journey, empowering the community to take the reins and shape the future of this revolutionary ecosystem.
Methanex is the world's largest producer and supplier of methanol. We create value through our leadership in the global production, marketing and delivery of methanol to customers. View our latest Investor Presentation for more details.
UnityNet World Environment Day Abraham Project 2024 Press ReleaseLHelferty
June 12, 2024 UnityNet International (#UNI) World Environment Day Abraham Project 2024 Press Release from Markham / Mississauga, Ontario in the, Greater Tkaronto Bioregion, Canada in the North American Great Lakes Watersheds of North America (Turtle Island).
Cleades Robinson, a respected leader in Philadelphia's police force, is known for his diplomatic and tactful approach, fostering a strong community rapport.
World economy charts case study presented by a Big 4
World economy charts case
World economy charts case study presented by a Big 4
World economy charts case study presented by a Big 4World economy charts case study presented by a Big 4
World economy charts case study presented by a Big 4
World economy charts case study presented by a Big 4World economy charts case study presented by a Big 4World economy charts case study presented by a Big 4World economy charts case study presented by a Big 4World economy charts case study presented by a Big 4World economy charts case study presented by a Big 4World economy charts case study presented by a Big 4World economy charts case study presented by a Big 4World economy charts case study presented by a Big 4World economy charts case study presented by a Big 4World economy charts case study presented by a Big 4World economy charts case study presented by a Big 4World economy charts case study presented by a Big 4World economy charts case study presented by a Big 4study presented by a Big 4
The E-Way Bill revolutionizes logistics by digitizing the documentation of goods transport, ensuring transparency, tax compliance, and streamlined processes. This mandatory, electronic system reduces delays, enhances accountability, and combats tax evasion, benefiting businesses and authorities alike. Embrace the E-Way Bill for efficient, reliable transportation operations.
2. FORWARD-LOOKING STATEMENTS
This presentation contains projections and other forward-looking statements regarding future events or the future
financial performance of Cisco, including future operating results. These projections and statements are only predictions.
Actual events or results may differ materially from those in the projections or other forward-looking statements. Please
see Cisco’s filings with the SEC, including its most recent filings on Forms 10-K and 10-Q, for a discussion of important
risk factors that could cause actual events or results to differ materially from those in the projections or other forward-
looking statements.
GAAP RECONCILIATION
During this presentation references to financial measures of Cisco will include references to non-GAAP financial
measures. Cisco provides a reconciliation between GAAP and non-GAAP financial information on our website at
www.cisco.com under “Financial Info” in the “Investor Relations” section.
http://investor.cisco.com/investor-relations/financial-information/Financial-Results/default.aspx
3. ▪ Business Momentum & Key Trends
▪ Financial Overview
▪ Business Outlook
▪ Q&A
4. Q3 FY 2017 Highlights
• Results demonstrate we are delivering against our strategic priorities and realizing the benefits
of our investments to transform our business and drive long-term shareholder value
• Delivered a solid quarter with total revenue of $11.9B, down 1% y/y, and non-GAAP EPS of
$0.60, up 5% y/y
• Managing the business well through a multi-year transformation…reflected in strong non-GAAP
gross margin of 64.4% and operating cash flow up 10% y/y to $3.4B
• Continue to innovate across our networking portfolio, with analytics a key element …completed
acquisition of AppDynamics and announced intent to acquire Viptela and MindMeld…aligned to
our strategy of investing to drive long-term growth and transition to more recurring software and
subscription revenue
• Re-making Cisco to succeed in a dramatically changing marketplace…laser focused on
delivering innovation as well as aggressively managing the business to optimize profitability,
cash flows and value for shareholders
5. ▪ Business Momentum & Key Trends
▪ Financial Overview
▪ Business Outlook
▪ Q&A
6. $M
Y/Y %
Change
Switching $3,489 2%
NGN Routing 2,032 (2%)
Collaboration 1,022 (4%)
Data Center 767 (5%)
Wireless 703 13%
Security 527 9%
Service Provider Video 207 (30%)
Other Products 138 57%
Service 3,055 (2%)
Total Cisco $11,940 (1%)
Q3 FY 2017 – Revenue Highlights
Certain reclassifications have been made to the amounts for prior periods in order to conform to the current period’s presentation. Historical revenue by product category and
service is available on our website at http://investor.cisco.com under “Financial Info” in the “Investor Relations” section.
29%
17%
9%
6%
6%
4%
2%
1%
26% Switching
NGN Routing
Collaboration
Data Center
Wireless
Security
SP Video
Other
Service
Revenue % of Total
Percentages may not sum to 100% due to rounding
7. Q3 FY 2017 Product Orders: Geographic Regions & Customer
Segments
Geographic Region Y/Y % Change
Americas (4%)
EMEA (6%)
APJC 2%
Total Cisco (4%)
Product Book to Bill Greater than 1
Customer Segment Y/Y % Change
Enterprise (2%)
Public Sector (4%)
Commercial 1%
Service Provider (10%)
Total Cisco (4%)
8. Q3 FY 2017 Non-GAAP Income Statement Highlights
$M (except per-share amounts and percentages) Q3 FY 2016 Q2 FY 2017 Q3 FY 2017
Revenue $12,000 $11,580 $11,940
Year/Year Change
Product
Service
(1%)
$8,875
$3,125
(3%)
$8,491
$3,089
(1%)
$8,885
$3,055
Gross Margin 65.2% 64.1% 64.4%
Product Gross Margin
Service Gross Margin
64.5%
67.1%
62.4%
68.8%
63.2%
67.8%
Operating Expenses $4,226 $3,826 $3,828
Operating Expenses as a % of Revenue 35.2% 33.0% 32.1%
Operating Income as a % of Revenue 30.0% 31.0% 32.3%
Net Income $2,880 $2,859 $3,026
Year/Year Change 3% (2%) 5%
EPS (diluted) $0.57 $0.57 $0.60
Year/Year Change 6% 0% 5%
9. Q3 FY 2017 GAAP Income Statement Highlights
$M (except per-share amounts and percentages) Q3 FY 2016 Q2 FY 2017 Q3 FY 2017
Revenue $12,000 $11,580 $11,940
Product
Service
$8,875
$3,125
$8,491
$3,089
$8,885
$3,055
Gross Margin 64.3% 62.8% 63.0%
Product Gross Margin
Service Gross Margin
63.8%
65.9%
61.1%
67.7%
61.7%
66.7%
Operating Expenses $4,737 $4,383 $4,349
Operating Expenses as a % of Revenue 39.5% 37.8% 36.4%
Operating Income as a % of Revenue 24.9% 25.0% 26.5%
Net Income $2,349 $2,348 $2,515
Year/Year Change (4%) (25%) 7%
EPS (diluted) $0.46 $0.47 $0.50
Year/Year Change (2%) (24%) 9%
11. Capital Allocation
$M Q3 FY 2016 Q4 FY 2016 Q1 FY 2017 Q2 FY 2017 Q3 FY 2017
Share Repurchases $649 $800 $1,001 $1,001 $503
Dividends Paid 1,308 1,309 1,308 1,304 1,451
Total $1,957 $2,109 $2,309 $2,305 $1,954
Share Repurchase Program*
Amount Purchased
($M)
Number of Shares
(M)
Avg. Price Per
Share
Q3 FY 2017 Purchases $503 15 $33.71
Q3 FY 2016 Q4 FY 2016 Q1 FY 2017 Q2 FY 2017 Q3 FY 2017
Dividends per Share $0.26 $0.26 $0.26 $0.26 $0.29
*Approximately $12.9B remaining authorized funds in repurchase program as of the end of Q3 FY 2017.
12. ▪ Business Momentum & Key Trends
▪ Financial Overview
▪ Business Outlook
▪ Q&A
13. • Delivered another solid quarter and executing well
• Confident in our strategy for long-term growth and profitability
• Believe the network will become increasingly important in solving our
customers’ most complex business problems, and helping them get secure
and stay secure
• Believe we will continue to see strong momentum in our shift towards more
software and subscription revenue…reflects the success of the investments
we are making in these areas, together with the flexible consumption and
buying models we offer customers
Key Takeaways
14. ▪ Business Momentum & Key Trends
▪ Financial Overview
▪ Business Outlook
▪ Q&A
16. FORWARD-LOOKING STATEMENTS
These presentation slides and the related conference call contain forward-looking statements, which are subject to the safe harbor provisions of the Private
Securities Litigation Reform Act of 1995. These forward-looking statements include, among other things, statements regarding future events (such as our
progress on the multi-year transformation of our business, our ability to deliver value to our customers through highly secure, software-defined, automated and
intelligent infrastructure, our ability to deliver on our strategic priorities, our investment in growth areas, the transition of our business to software and recurring
revenues, and our ability to continue to execute well and return value to our shareholders) and the future financial performance of Cisco (including the business
outlook for Q4 FY 2017) that involve risks and uncertainties. Readers are cautioned that these forward-looking statements are only predictions and may differ
materially from actual future events or results due to a variety of factors, including: business and economic conditions and growth trends in the networking
industry, our customer markets and various geographic regions; global economic conditions and uncertainties in the geopolitical environment; overall information
technology spending; the growth and evolution of the Internet and levels of capital spending on Internet-based systems; variations in customer demand for
products and services, including sales to the service provider market and other customer markets; the return on our investments in certain priorities, key growth
areas, and in certain geographical locations, as well as maintaining leadership in routing, switching and services; the timing of orders and manufacturing and
customer lead times; changes in customer order patterns or customer mix; insufficient, excess or obsolete inventory; variability of component costs; variations in
sales channels, product costs or mix of products sold; our ability to successfully acquire businesses and technologies and to successfully integrate and operate
these acquired businesses and technologies; our ability to achieve expected benefits of our partnerships; increased competition in our product and service
markets, including the data center market; dependence on the introduction and market acceptance of new product offerings and standards; rapid technological
and market change; manufacturing and sourcing risks; product defects and returns; litigation involving patents, intellectual property, antitrust, shareholder and
other matters, and governmental investigations; our ability to achieve the benefits of the announced restructuring and possible changes in the size and timing of
the related charges; man-made problems such as cyber-attacks, data protection breaches, computer viruses or terrorism; natural catastrophic events; a
pandemic or epidemic; our ability to achieve the benefits anticipated from our investments in sales, engineering, service, marketing and manufacturing activities;
our ability to recruit and retain key personnel; our ability to manage financial risk, and to manage expenses during economic downturns; risks related to the global
nature of our operations, including our operations in emerging markets, currency fluctuations and other international factors; changes in provision for income
taxes, including changes in tax laws and regulations or adverse outcomes resulting from examinations of our income tax returns; potential volatility in operating
results; and other factors listed in Cisco’s most recent reports on Forms 10-Q and 10-K filed on February 21, 2017 and September 8, 2016, respectively. The
financial information contained in these presentation slides and the related conference call should be read in conjunction with the consolidated financial
statements and notes thereto included in Cisco’s most recent reports on Forms 10-Q and 10-K as each may be amended from time to time. Cisco’s results of
operations for the three and nine months ended April 29, 2017 are not necessarily indicative of Cisco’s operating results for any future periods. Any projections in
these presentation slides and the related conference call are based on limited information currently available to Cisco, which is subject to change. Although any
such projections and the factors influencing them will likely change, Cisco will not necessarily update the information, since Cisco will only provide guidance at
certain points during the year. Such information speaks only as of the date of these presentation slides and the related conference call.
18. Q3 FY 2017 Geographic Revenue and Total Gross Margin
Certain reclassifications have been made to the amounts for prior periods in order to conform to the current period’s presentation. Historical revenue and gross margin by segment
is available on our website at http://investor.cisco.com under “Financial Info” in the “Investor Relations” section.
Revenue Total Gross Margin Percentage
$M (except percentages)
Q3
FY’16
Q2
FY’17
Q3
FY’17
Q3
FY’16
Q2
FY’17
Q3
FY’17
Americas $7,056 $6,660 $7,046 66.3% 64.4% 64.6%
EMEA 3,006 3,065 2,999 65.5% 65.6% 65.5%
APJC 1,938 1,855 1,895 60.5% 60.4% 61.8%
Geographic Total $12,000 $11,580 $11,940 65.2% 64.1% 64.4%