Matplotlib is a popular Python library used for data visualization and making 2D plots from data. It provides an object-oriented API that allows plots to be embedded in Python applications. Matplotlib has a MATLAB-like procedural interface called Pylab and can be considered an open source alternative to MATLAB. It is written in Python and relies on NumPy for numerical computations. Examples shown how to generate simple plots by importing Matplotlib and NumPy, preparing data, and using Matplotlib functions to plot and display the results.


![5
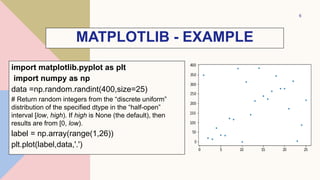
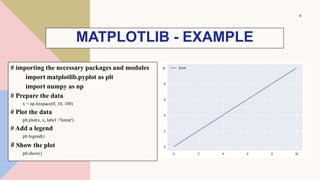
MATPLOTLIB - EXAMPLE
# importing the necessary packages and modules
import matplotlib.pyplot as plt
import numpy as np
plt.plot([1, 2, 3, 4], [1, 4, 9, 16], ‘ro’)
plt.axis([0, 6, 0, 20])
plt.show()](https://image.slidesharecdn.com/pythonformachinelearningmatplotlib-221208073006-f652f1c6/85/Python-for-Machine-Learning-MatPlotLib-pptx-5-320.jpg)