1. Pump Calculations:
Assumptions:
Lengthof PVCpipe 1089.42 meters
Diameterof PVCpipe 3.068 inches 0.077927 meters
PVCpipe roughness(absolute) 0.0000015 meters
Initial frictionfactorguess 0.02
accelerationdue togravity 9.81 m/s^2
densityof water 1000 kg/m^3
dynamicviscosityof water 0.00112 N*s/m^2
ElevationDifference 141 meters
Initial Pressure inthe pipe 25 psi 17.58 meters
Calculations:
𝑃𝑎
𝜌𝑔
+ 𝑧 𝑎 +
𝑣 𝑎
2
2𝑔
=
𝑃 𝑏
𝜌𝑔
+ 𝑧 𝑏 +
𝑣 𝑏
2
2𝑔
+ ℎ𝑒𝑎𝑑 𝑙𝑜𝑠𝑠 − 𝑝𝑢𝑚𝑝 𝑝𝑟𝑒𝑠𝑠𝑢𝑟𝑒
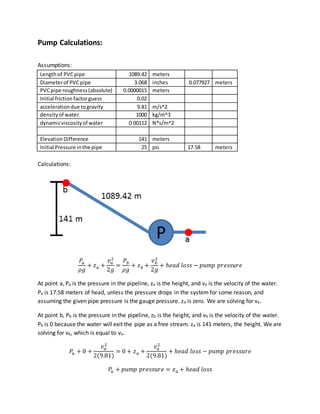
At point a, Pa is the pressure in the pipeline, za is the height, and va is the velocity of the water.
Pa is 17.58 meters of head, unless the pressure drops in the system for some reason, and
assuming the given pipe pressure is the gauge pressure. za is zero. We are solving for va.
At point b, Pb is the pressure in the pipeline, zb is the height, and vb is the velocity of the water.
Pb is 0 because the water will exit the pipe as a free stream. za is 141 meters, the height. We are
solving for vb, which is equal to va.
𝑃𝑎 + 0 +
𝑣 𝑎
2
2(9.81)
= 0 + 𝑧 𝑎 +
𝑣 𝑎
2
2(9.81)
+ ℎ𝑒𝑎𝑑 𝑙𝑜𝑠𝑠 − 𝑝𝑢𝑚𝑝 𝑝𝑟𝑒𝑠𝑠𝑢𝑟𝑒
𝑃𝑎 + 𝑝𝑢𝑚𝑝 𝑝𝑟𝑒𝑠𝑠𝑢𝑟𝑒 = 𝑧 𝑎 + ℎ𝑒𝑎𝑑 𝑙𝑜𝑠𝑠
2. Pump pressure is given by the pump curves. The curves were only given in graphical format, so
point values were extracted from the graph and a cubic equation fit was used to approximate
the pump curve. a*x^3+b*x^2+c*x+d=y where a,b,c,d are constants, x is the flow in m^3/hour,
and y is the pressure in meters of head.
Pump a b c d
6 stage 15sv -0.0025 0.0202 -0.3841 121.92
7 stage 15sv -0.003 0.0288 -0.6199 143.31
8 stage 15sv -0.0032 0.0211 -0.5978 163.54
9 stage 15sv -0.005 0.0906 -1.4032 186.04
10 stage 15sv -0.0047 0.0681 -1.1902 205.89
11 stage 15sv -0.0059 0.1011 -1.6322 227.04
6 stage 22sv -0.0016 0.0041 -0.0865 128.15
7 stage 22sv -0.0021 0.0091 -0.0825 149.47
8 stage 22sv -0.0025 0.0225 -0.3355 171.08
9 stage 22sv -0.0027 0.0169 -0.2383 192.3
10 stage 22sv -0.0029 0.019 -0.2942 213.75
11 stage 22sv -0.0032 0.0215 -0.3328 235.16
Head loss is the sum of minor and major head losses. Minor losses from bends and other
fittings will be assumed to be minimal compared to the major losses in the km long pipe. The
major losses are given by the Darcy–Weisbach equation.
𝑓 ∗
𝐿
𝐷
∗
𝑣2
2𝑔
= ℎ𝑒𝑎𝑑 𝑙𝑜𝑠𝑠
f=friction factor
L=length of pipe
D=diameter of pipe
v=velocity of fluid
g=acceleration due to gravity
The Moody Chart can be used to obtain f, the friction factor. To solve this system, an equation
is needed, so the Colebrook formula, which is an empirical fit of the moody chart, will be used.
1
√ 𝑓
= −2 ∗ 𝑙𝑜𝑔10 (
𝜖
3.7 ∗ 𝐷
+
2.51
𝑅𝐸 ∗ √ 𝑓
)
ϵ=absolute pipe roughness
D=pipe diameter
𝑅𝐸 = 𝑅𝑒𝑦𝑛𝑜𝑙𝑑𝑠 𝑁𝑢𝑚𝑏𝑒𝑟 =
𝜌 ∗ 𝑣 ∗ 𝐷
𝜇
=
𝜌 ∗
𝑄
𝐴
∗ 𝐷
𝜇
Where ρ=density of water, v=velocity, D=pipe diameter, μ=viscosity, Q=flow, A=cross sectional
area
3. The Colebrook formula must be solved iteratively, so it is solved 19 times in a row in Excel
before outputting a friction factor.
So the final governing equation is:
𝑃𝑎 + 𝑎 ∗ 𝑄3
+ 𝑏 ∗ 𝑄2
+ 𝑐 ∗ 𝑄 + 𝑑 = 𝑧 𝑎 + 𝑓 ∗
𝐿
𝐷
∗
𝑣2
2𝑔
Or in terms of just flow and f and constants: (flow on the left is in m^3/hour to match the
derived pump constants. Flow on the right is in m^3/sec)
𝑃𝑎 + 𝑎 ∗ 𝑄3
+ 𝑏 ∗ 𝑄2
+ 𝑐 ∗ 𝑄 + 𝑑 = 𝑧 𝑎 + 𝑓 ∗
𝐿
𝐷
∗
(𝑄/𝐴)2
2𝑔
As an example, if we solve for the flow of a 9 stage 15sv for a 141 meter elevation difference
and a pressure in the pipeline of 17.58 meters, the equation becomes this:
17.58 − .005 ∗ 𝑄3 + .0906 ∗ 𝑄2 − 1.4032 ∗ 𝑄 + 186.04 = 141 + 𝑓 ∗
1089.42
.077927
∗
(
𝑄
0.0047694
)
2
2 ∗ 9.81
f is a function of Q, so this equation can be solved. Specifically, Excel goal seek is used to solve
this equation. When solved, the output Q is 22.11 m^3/hour and the final friction factor is
0.01834.
Cavitation Risk:
From the pump documentation, the NPSHR of the pumps, 15sv and 22sv, never exceed 25 feet
of head. Therefore, given the atmospheric pressure at our location (about 30 feet of head, or 13
psi), and the vapor pressure of water at 50°C (4 feet of head, an extreme case), then there is
enough pressure to prevent cavitation from occurring. Water will drain out of the pipe before
cavitation occurs.
4. Flow results in chart form:
141 measured elevation difference with 17.58 meters of head of pressure in the inlet pipe.
m^3 per
hour
Fill Time
(current
demand)
Fill Time
(Max Sadrach
Zeledon)
Fill Time (Max
Sadrach
Zeledon+Anex)
7 stage 15sv 13.62 6.2 9.8 14.2
8 stage 15sv 18.53 4.6 7.2 10.4
9 stage 15sv 22.11 3.8 6.0 8.7
10 stage 15sv 24.35 3.5 5.5 7.9
11 stage 15sv 25.67 3.3 5.2 7.5
7 stage 22sv 18.04 4.7 7.4 10.7
8 stage 22sv 22.59 3.7 5.9 8.6
9 stage 22sv 25.62 3.3 5.2 7.5
10 stage 22sv 27.99 3.0 4.8 6.9
11 stage 22sv 29.68 2.9 4.5 6.5
5. 141 measured elevation difference with no pressure in the inlet pipe.
m^3 per
hour
Fill Time
(current
demand)
Fill Time
(Max Sadrach
Zeledon)
Fill Time (Max
Sadrach
Zeledon+Anex)
7 stage 15sv 2.99 28.3 44.6 64.7
8 stage 15sv 13.96 6.1 9.5 13.8
9 stage 15sv 19.03 4.4 7.0 10.2
10 stage 15sv 21.99 3.8 6.1 8.8
11 stage 15sv 23.80 3.6 5.6 8.1
7 stage 22sv 10.74 7.9 12.4 18.0
8 stage 22sv 18.46 4.6 7.2 10.5
9 stage 22sv 22.72 3.7 5.9 8.5
10 stage 22sv 25.68 3.3 5.2 7.5
11 stage 22sv 27.77 3.0 4.8 7.0
6. 124 meter elevation difference (SRTM elevation data) with 17.58 meters of head of pressure in
the inlet pipe.
m^3 per
hour
Fill Time
(current
demand)
Fill Time
(Max Sadrach
Zeledon)
Fill Time (Max
Sadrach
Zeledon+Anex)
7 stage 15sv 18.96 4.5 7.0 10.2
8 stage 15sv 22.63 3.7 5.9 8.5
9 stage 15sv 25.62 3.3 5.2 7.5
10 stage 15sv 27.53 3.1 4.8 7.0
11 stage 15sv 28.39 3.0 4.7 6.8
7 stage 22sv 23.78 3.6 5.6 8.1
8 stage 22sv 27.55 3.1 4.8 7.0
9 stage 22sv 29.91 2.8 4.5 6.5
10 stage 22sv 31.95 2.6 4.2 6.0
11 stage 22sv 33.28 2.5 4.0 5.8
7. 124 meter elevation difference (SRTM elevation data) with no pressure in the inlet pipe.
m^3 per
hour
Fill Time
(current
demand)
Fill Time
(Max Sadrach
Zeledon)
Fill Time (Max
Sadrach
Zeledon+Anex)
7 stage 15sv 12.68 6.7 10.5 15.2
8 stage 15sv 18.95 4.5 7.0 10.2
9 stage 15sv 23.06 3.7 5.8 8.4
10 stage 15sv 25.48 3.3 5.2 7.6
11 stage 15sv 26.75 3.2 5.0 7.2
7 stage 22sv 18.51 4.6 7.2 10.4
8 stage 22sv 24.07 3.5 5.5 8.0
9 stage 22sv 27.36 3.1 4.9 7.1
10 stage 22sv 29.88 2.8 4.5 6.5
11 stage 22sv 31.55 2.7 4.2 6.1