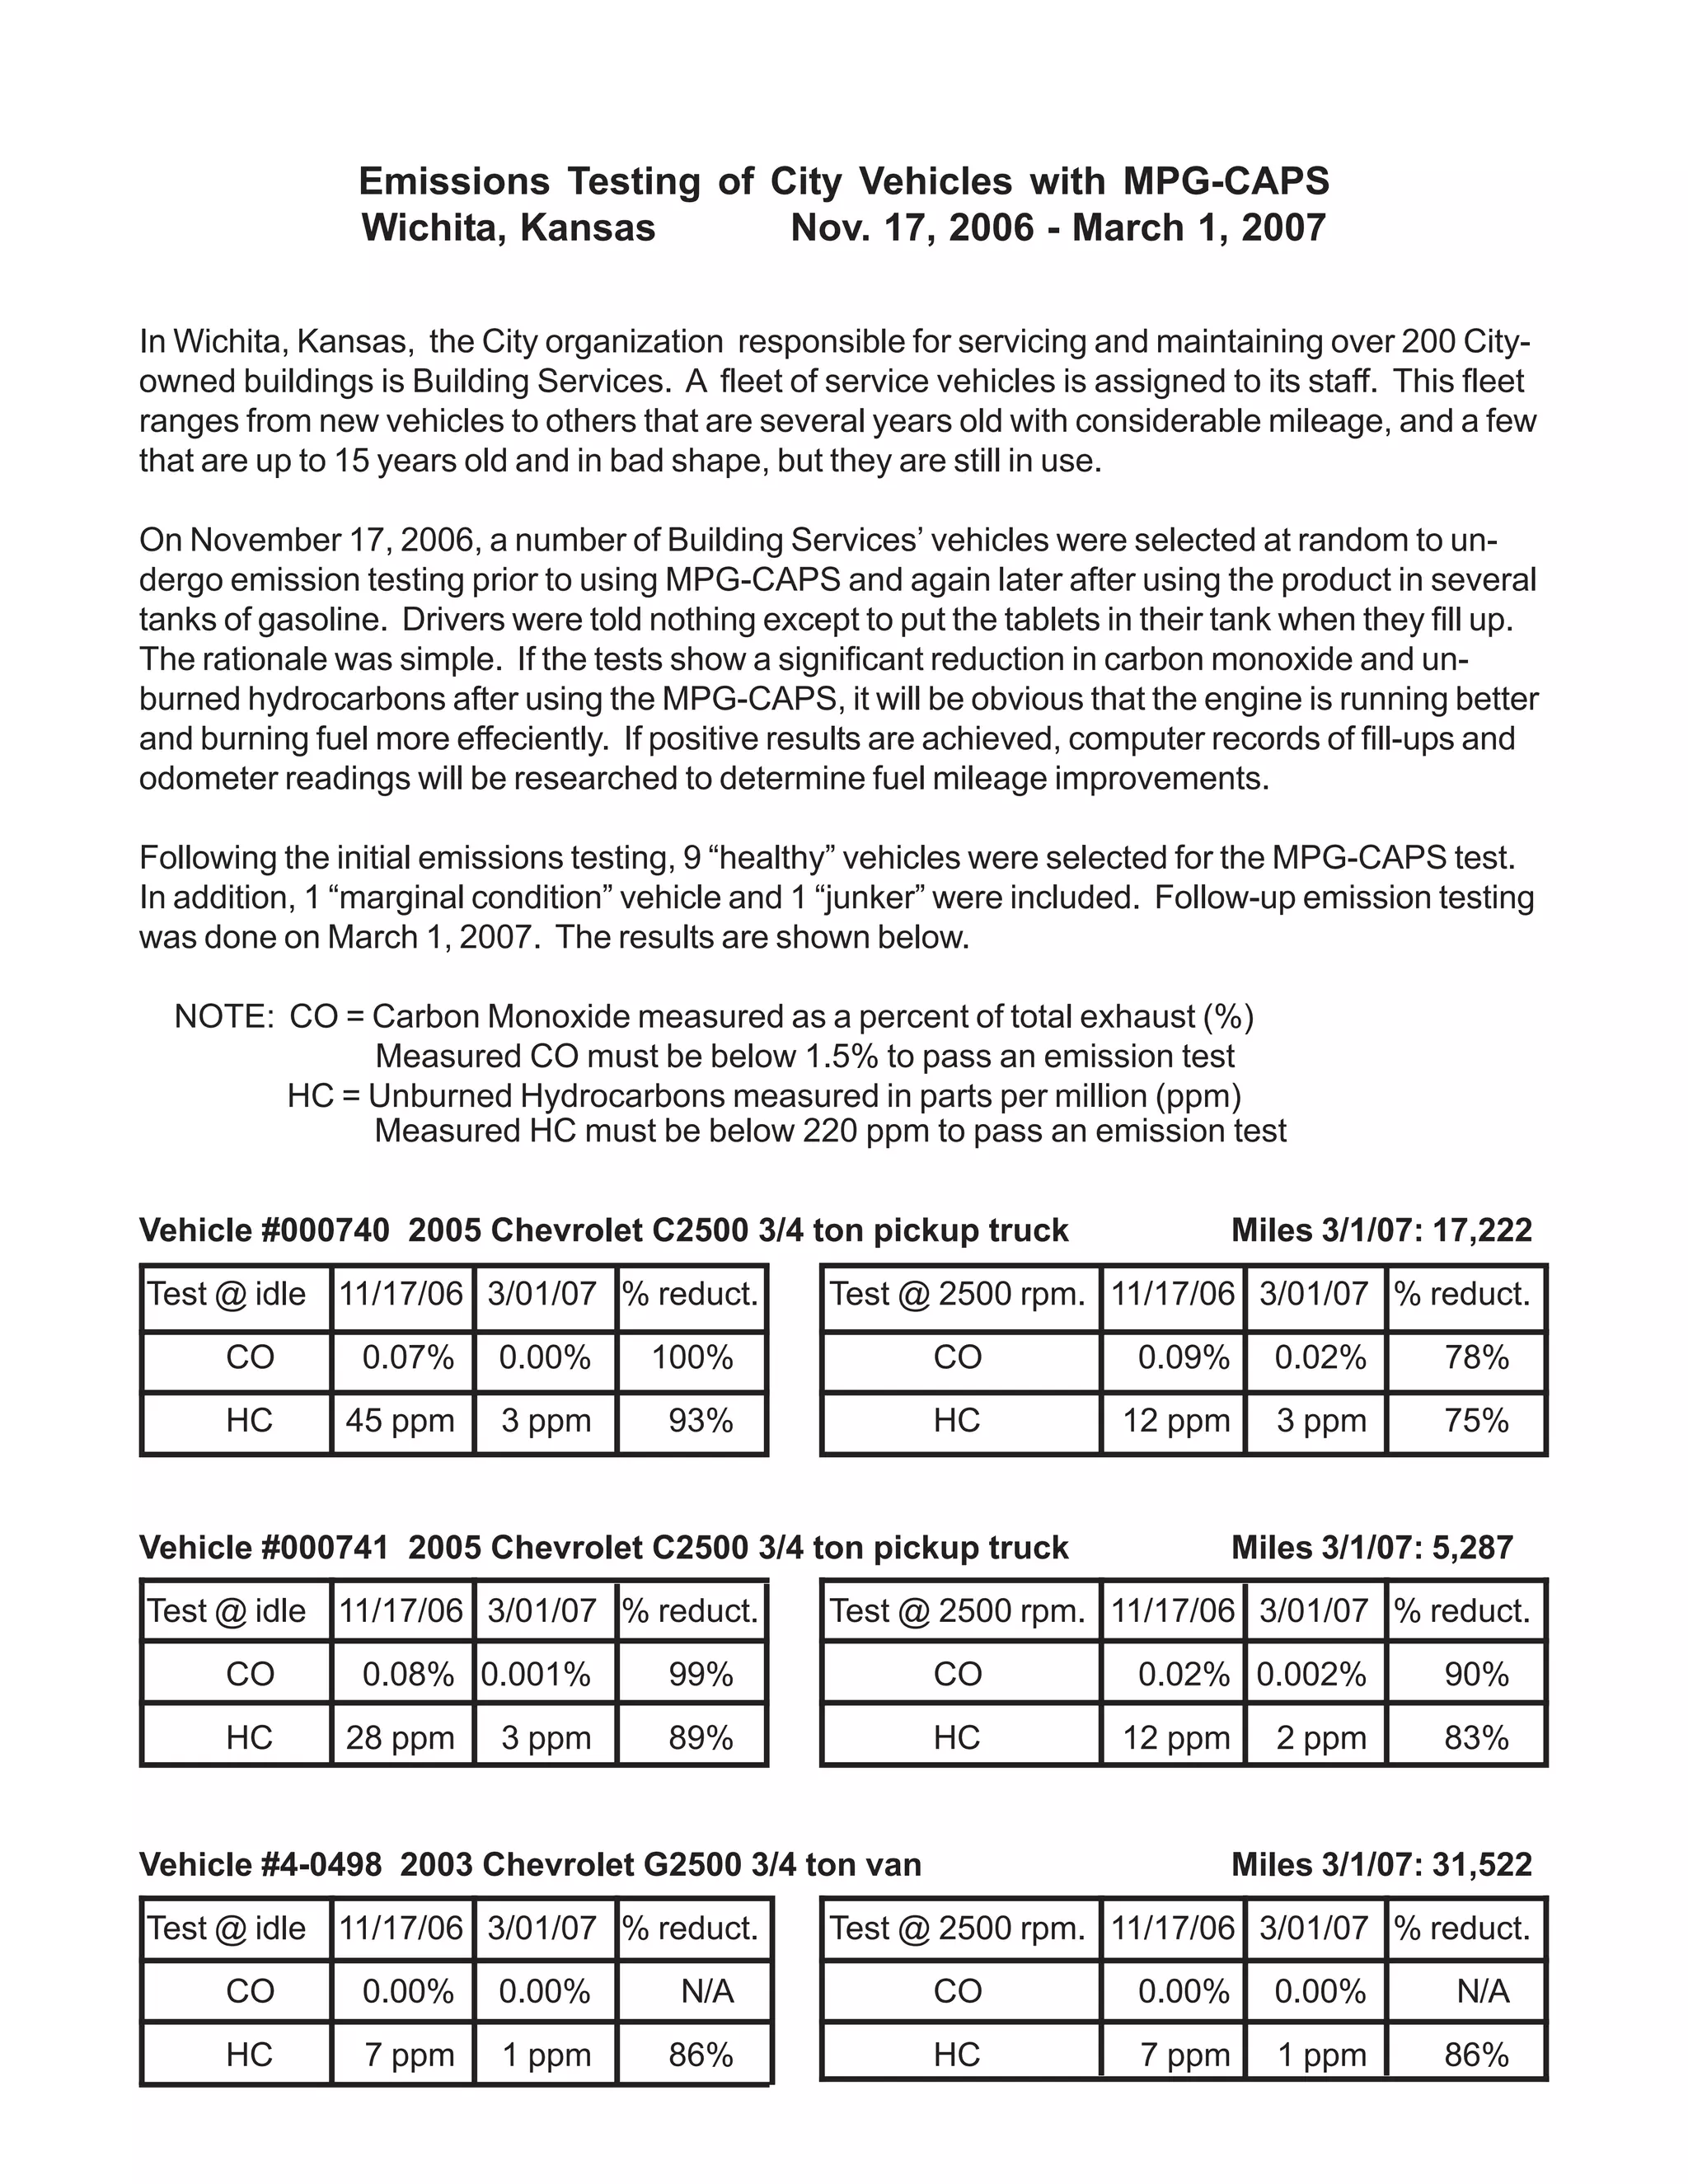
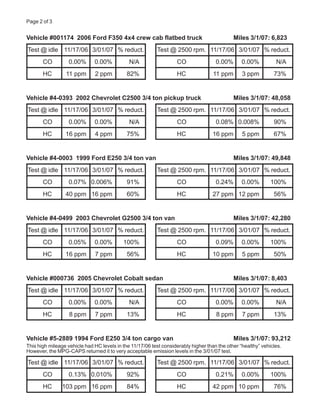
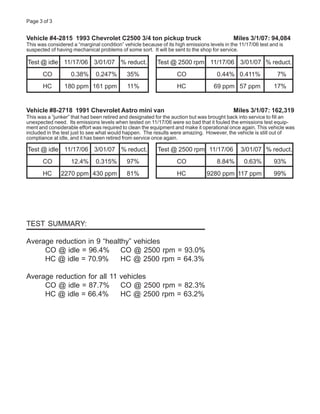
The document summarizes emissions testing done on 11 vehicles in the City of Wichita fleet before and after using MPG-CAPS fuel additives. Testing found significant reductions in carbon monoxide and unburned hydrocarbons emissions across the fleet, with average reductions of 87.7% for CO at idle and 66.4% for hydrocarbons at idle. The highest reductions were seen in older, higher-mileage vehicles. The results suggest MPG-CAPS improves engine efficiency and fuel combustion.
This webinar was hosted on February 13, 2015 from 3-4 pm IST and was presented by Basalingappa Beedi, DTO Central Division, NEKRTC and Manish Dutta Pandey, Project Associate - Urban Transport, EMBARQ India.
City bus services are the backbone of mobility in most Indian cities. While large cities such as Bangalore, Delhi, Chennai etc have established city bus services, smaller cities have significant potential for providing affordable and convenient mobility by establishing a formal public transport system. NEKRTC, the public transport operator in Karnataka has successfully implemented city bus services in 7 cities in the North East of Karnataka including Gulbarga. This webinar provided a framework for cities looking to introduce city bus services through the case study of Gulbarga.
This was the first webinar from the Bus Karo 2.0 webinar series, which will be conducted over the next few months. EMBARQ India's deep engagement on several projects with various city bus agencies, has lead to the publishing of the Bus Karo 2.0 report, which documents the implementation of significant advancements in bus transport in India. As a part of the project, we have come up with a series of webinars, where each webinar will be conducted by EMBARQ India and the partner agency and focus on a different case study detailed in the report.
Bus Karo 2.0 Report - http://embarqindiahub.org/publications/bus-karo-20-case-studies-india
Communicating Public Transport in India Kumar Manish
Public Transport in India needs to be communicated & marketed well to all the stakeholders to create its acceptability and uses. New public transport systems like BRTS are poorly communicated with no communications & marketing plan in place. In addition to great bus infrastructure, soft aspects of branding, communications & marketing needs to be prioritized & promoted.
Do share your feedbacks & comments.
Thanks,
Market Research Report : Electric vehicle market in india 2014 - SampleNetscribes, Inc.
For the complete report, get in touch with us at: info@netscribes.com
Abstract :
Electric vehicle market is expected to witness phenomenal growth in the coming years. Increasing fuel costs, rise in pollution level and increasing government support will boost the adoption of electric vehicles in India.
The report highlights the analysis of the drivers and explains the factors for growth of the industry. Government Initiatives, Rise in fuel costs, Low operating and maintenance cost and foreign dependence for crude oil are the key drivers for the Electric Vehicle Market in India. Recently, MNRE had implemented the Alternate Fuels for Surface Transportation Program to subsidize the purchase of electric vehicles. Domestic electric vehicle industry has witnessed significant short term growth owing to the various initiatives undertaken by the Indian government. Fuel costs play a vital role in influencing the consumer’s automobile purchase decision. Indian automobile industry has been witnessing sluggish demand and one of the primary reasons for this is increase in fuel prices. Use of electric vehicles is likely to reduce the increasing dependence on foreign crude oil as electricity can be generated from various natural resources in India. As electric vehicles are considered to be zero-polluting, increasing usage of such vehicles can aid in bringing down the country’s level of pollution.
Table of Contents :
Slide 1: Executive Summary
Macroeconomic Indicators
Slide 2: Economic Indicators: GDP at cost factor cost: Quarterly (2011-12- 2014-15) & Inflation rate Monthly (Jul-Aug 2013 – Nov-Dec 2013)
Slide 3: Gross fiscal deficit: Monthly (Feb-2013-Jul 2013) & Exchange Rate: Monthly (Apr 2014- Sep 2014)
Slide 4: Lending rate: Annual (2011-12-2013-14); Trade Balance: Annual (2010-11-2013-14) & FDI: Annual (2009-10-2012-13)
Introduction
Slide 5: Electric Vehicle – Introduction and Types of Electric Vehicles – Technology-wise
Slide 6: Electric Vehicle Market – Transition
Slide 7: Shift towards Electric Mobility
Market Overview
Electric Vehicle
Slide 8: Electric Vehicle Market – Overview, Market Size and Growth (2013-2018e) (Value wise), Market Share – Segment-wise (2012-13)
Slide 9: Vehicle Lifecycle Cost Comparison across Supply Chain – Electric Vehicle vs. ICE Vehicles
Slide 10: Cost Comparison across Manufacturing Process – Electric Vehicle vs. ICE Vehicles
Major Segments
Slide 11: Electric Four Wheelers Market – Overview, Market Size and Growth (2013-2018e) (Value wise), Consumer Preference – Electric Vehicle Technology-wise
Slide 12-13: Electric Two Wheelers Market – Overview, Market Size and Growth (2013-2018e) (Value wise), Consumer Preference, Low Speed and High Speed Electric Two Wheeler Specifications
Slide 13: Electric Three Wheelers – Overview, Market Size and Growth (2013-2018e) (Value wise)
Market Analysis
Slide 14: Matrix of Key Challenges to Electric Vehicle Adoption – Segme
Electric Vehicles in India: Challenges & Opportunities Nitin Sukh
Electric vehicles (EVs) are no longer science fiction. Scientific achievements in this space have led to the mainstreaming of EVs in the United States, Israel and some European countries. India isn’t far behind either with Mahindra-Reva, Hero Electric and other domestic OEMs leading the front. Durable lithium ion batteries, fast charging networks, efficient chassis design and electric drive trains are key links in the EV value chain and extensive technological progress has been made in all these areas. However, for EVs to truly lead GhG reduction in Indian Industry and have a positive impact on the country’s energy security, the integration of smart grids and renewable energy feeds into these grids are a must. In fact, without these two critical components, the introduction of EVs into the current ecosystem would be an ecological burden and lead to greater GhG emissions since energy will be derived from a predominantly coal powered and inefficient energy grid.
Therefore, this study undertaken by YES BANK and TERI-BCSD critically analyses the EV value chain, identifying hidden triple bottom line risks and highlighting innovative clean technologies and business models that mitigate those risks, thereby making the value chain more attractive from lending and investment perspectives. The paper also concludes with a sobering and pragmatic analysis of the current and projected EV scenario in India versus the internal combustion engine.
15 Common Myths you were taught to believe about CarsEason Chan
If you drive a vehicle on a regular basis, chances are that you're a victim of car myths that have been circulating for years. Check out these common myths about cars that you're probably guilty of following.
~ https://www.revol.com.sg
TRANSPORT HAULAGE 100 kph
100T+1000T ROLLING FRICTION
Design__ROAD____RAIL____SHIP.
NOW___572_______396______220
ANDY__152_______136______120
RATIO_.3.76_______2.91_____1.83
NET____376_______420______476
ADV___266¬¬¬_______.238______210
VDF____30_______.33.6______38.1 ANDY
VDF_____8________15_______25 NOW
….
HP___ROAD NOW___13,750 HP ;NEW__3,666 HP
HP___RAIL_ NOW____7,333 HP NEW__3,274 HP
HP___SHIP_ NOW____4,400 HP NEW__2,895 HP
Real-World Activity and Fuel Use of Diesel and CNG Refuse TrucksGurdas Sandhu
See journal paper at http://dx.doi.org/10.1016/j.atmosenv.2014.04.036
According to a 2006 report, the waste collection industry in the U.S. operates over 136,000 refuse trucks, almost all diesels, that average 25,000 miles annually and with average fuel economy of less than 3 miles per gallon. There is an increasing adoption of Compressed Natural Gas (CNG) fuelled trucks in the waste collection industry due to the significantly lower cost of CNG per diesel gallon equivalent (dge). This presentation includes results of activity and fuel use from in-use real-world field measurements of eighteen diesel fuelled refuse trucks, with six each of side-load, front-load, and roll-off configurations and six CNG fuelled refuse trucks, with three each of side-load and front-load configurations. The study design included trucks from various manufacturers such as Mack, Autocar, and Freightliner and model years 2003 to 2012. Each truck was instrumented for one day of operation with a portable activity measurement system (PAMS) to log Engine Control Unit (ECU) data and Global Positioning System (GPS) receivers. Trucks were also instrumented with portable emissions measurement system (PEMS), however, emissions results are not included here.
The total quality assured data covers over 2,000 miles and 190 hours of in-use real-world driving. During the measurement period the trucks picked about 7,500 cans with a total of over 500 tons of trash. Measured 1 Hz activity data includes, but is not limited to, vehicle speed, engine speed, intake manifold pressure, intake air temperature, engine load, and elevation (leading to road grade). Duty cycles and fuel use rates are quantified in terms of operating mode bins defined by the U.S. Environmental Protection Agency for the MOVES emission factor model. Overall results are included here; detailed results by truck configuration and fuel type will be covered in the presentation. On average, 50 percent of time was spent at idle, 5 percent braking or decelerating, 28 percent at low speed (up to 25 mph), 12 percent at moderate speed (25 to 50 mph), and 5 percent at high speed (50 mph or higher). Diesel trucks spend more time in high speed mode compared to CNG. Estimated cycle average diesel fuel economy ranges were 2.0 to 3.4 mpg, 2.3 to 3.2 mpg, 3.9 to 6.0 mpg, and for side-loaders, front-loaders, and roll-offs, respectively. In comparison, CNG fuel economy ranges were 1.2 to 1.7 mpdge and 2.0 to 2.5 mpdge for side-loaders and front-loaders, respectively.
—In a laboratory experiment was conducted on
the utilization of Ethanol-Diesel emulsion in a single
cylinder direct injection diesel engine, a single cylinder,
water cooled, four stroke diesel engine was used. The
principal goals of the present work are to obtain emission
data and combustion characteristics for this type of Diesel
Engine, and to identify the ratio of Emulsion which is
effective in reducing emissions. Experiments were
conducted with emulsions viz (90%diesel + 10%ethanol),
(80% diesel + 20% ethanol), (70% diesel + 30%ethanol) as
fuel. While AVL smoke meter was employed to measure
the smoke density in HSU, the exhaust gas analyzer was
used to measure the NOx emission. High volume sampler
was employed to measure the particulate matter emitted at
the exhaust. The combustion characteristics were studied
using AVL combustion analyser. From the experimental
investigation it was found that the smoke, particulate
matter and Oxides of Nitrogen emissions were reduced
marginally. From the pressure curve and cumulative heat
release curve, it was observed that the combustion started
earlier and the rate of pressure rise increased marginally.
1. Emissions Testing of City Vehicles with MPG-CAPS
Wichita, Kansas Nov. 17, 2006 - March 1, 2007
In Wichita, Kansas, the City organization responsible for servicing and maintaining over 200 City-
owned buildings is Building Services. A fleet of service vehicles is assigned to its staff. This fleet
ranges from new vehicles to others that are several years old with considerable mileage, and a few
that are up to 15 years old and in bad shape, but they are still in use.
On November 17, 2006, a number of Building Services’ vehicles were selected at random to un-
dergo emission testing prior to using MPG-CAPS and again later after using the product in several
tanks of gasoline. Drivers were told nothing except to put the tablets in their tank when they fill up.
The rationale was simple. If the tests show a significant reduction in carbon monoxide and un-
burned hydrocarbons after using the MPG-CAPS, it will be obvious that the engine is running better
and burning fuel more effeciently. If positive results are achieved, computer records of fill-ups and
odometer readings will be researched to determine fuel mileage improvements.
Following the initial emissions testing, 9 “healthy” vehicles were selected for the MPG-CAPS test.
In addition, 1 “marginal condition” vehicle and 1 “junker” were included. Follow-up emission testing
was done on March 1, 2007. The results are shown below.
NOTE: CO = Carbon Monoxide measured as a percent of total exhaust (%)
Measured CO must be below 1.5% to pass an emission test
HC = Unburned Hydrocarbons measured in parts per million (ppm)
Measured HC must be below 220 ppm to pass an emission test
Vehicle #000740 2005 Chevrolet C2500 3/4 ton pickup truck Miles 3/1/07: 17,222
Test @ idle 11/17/06 3/01/07 % reduct. Test @ 2500 rpm. 11/17/06 3/01/07 % reduct.
CO 0.07% 0.00% 100% CO 0.09% 0.02% 78%
HC 45 ppm 3 ppm 93% HC 12 ppm 3 ppm 75%
Vehicle #000741 2005 Chevrolet C2500 3/4 ton pickup truck Miles 3/1/07: 5,287
Test @ idle 11/17/06 3/01/07 % reduct. Test @ 2500 rpm. 11/17/06 3/01/07 % reduct.
CO 0.08% 0.001% 99% CO 0.02% 0.002% 90%
HC 28 ppm 3 ppm 89% HC 12 ppm 2 ppm 83%
Vehicle #4-0498 2003 Chevrolet G2500 3/4 ton van Miles 3/1/07: 31,522
Test @ idle 11/17/06 3/01/07 % reduct. Test @ 2500 rpm. 11/17/06 3/01/07 % reduct.
CO 0.00% 0.00% N/A CO 0.00% 0.00% N/A
HC 7 ppm 1 ppm 86% HC 7 ppm 1 ppm 86%
2. Page 2 of 3
Vehicle #001174 2006 Ford F350 4x4 crew cab flatbed truck Miles 3/1/07: 6,823
Test @ idle 11/17/06 3/01/07 % reduct. Test @ 2500 rpm. 11/17/06 3/01/07 % reduct.
CO 0.00% 0.00% N/A CO 0.00% 0.00% N/A
HC 11 ppm 2 ppm 82% HC 11 ppm 3 ppm 73%
Vehicle #4-0393 2002 Chevrolet C2500 3/4 ton pickup truck Miles 3/1/07: 48,058
Test @ idle 11/17/06 3/01/07 % reduct. Test @ 2500 rpm. 11/17/06 3/01/07 % reduct.
CO 0.00% 0.00% N/A CO 0.08% 0.008% 90%
HC 16 ppm 4 ppm 75% HC 16 ppm 5 ppm 67%
Vehicle #4-0003 1999 Ford E250 3/4 ton van Miles 3/1/07: 49,848
Test @ idle 11/17/06 3/01/07 % reduct. Test @ 2500 rpm. 11/17/06 3/01/07 % reduct.
CO 0.07% 0.006% 91% CO 0.24% 0.00% 100%
HC 40 ppm 16 ppm 60% HC 27 ppm 12 ppm 56%
Vehicle #4-0499 2003 Chevrolet G2500 3/4 ton van Miles 3/1/07: 42,280
Test @ idle 11/17/06 3/01/07 % reduct. Test @ 2500 rpm. 11/17/06 3/01/07 % reduct.
CO 0.05% 0.00% 100% CO 0.09% 0.00% 100%
HC 16 ppm 7 ppm 56% HC 10 ppm 5 ppm 50%
Vehicle #000736 2005 Chevrolet Cobalt sedan Miles 3/1/07: 8,403
Test @ idle 11/17/06 3/01/07 % reduct. Test @ 2500 rpm. 11/17/06 3/01/07 % reduct.
CO 0.00% 0.00% N/A CO 0.00% 0.00% N/A
HC 8 ppm 7 ppm 13% HC 8 ppm 7 ppm 13%
Vehicle #5-2889 1994 Ford E250 3/4 ton cargo van Miles 3/1/07: 93,212
This high mileage vehicle had HC levels in the 11/17/06 test considerably higher than the other “healthy” vehicles.
However, the MPG-CAPS returned it to very acceptable emission levels in the 3/01/07 test.
Test @ idle 11/17/06 3/01/07 % reduct. Test @ 2500 rpm. 11/17/06 3/01/07 % reduct.
CO 0.13% 0.010% 92% CO 0.21% 0.00% 100%
HC 103 ppm 16 ppm 84% HC 42 ppm 10 ppm 76%
3. Page 3 of 3
Vehicle #4-2815 1993 Chevrolet C2500 3/4 ton pickup truck Miles 3/1/07: 94,084
This was considered a “marginal condition” vehicle because of its high emissions levels in the 11/17/06 test and is
suspected of having mechanical problems of some sort. It will be sent to the shop for service.
Test @ idle 11/17/06 3/01/07 % reduct. Test @ 2500 rpm 11/17/06 3/01/07 % reduct.
CO 0.38% 0.247% 35% CO 0.44% 0.411% 7%
HC 180 ppm 161 ppm 11% HC 69 ppm 57 ppm 17%
Vehicle #8-2718 1991 Chevrolet Astro mini van Miles 3/1/07: 162,319
This was a “junker” that had been retired and designated for the auction but was brought back into service to fill an
unexpected need. Its emissions levels when tested on 11/17/06 were so bad that it fouled the emissions test equip-
ment and considerable effort was required to clean the equipment and make it operational once again. This vehicle was
included in the test just to see what would happen. The results were amazing. However, the vehicle is still out of
compliance at idle, and it has been retired from service once again.
Test @ idle 11/17/06 3/01/07 % reduct. Test @ 2500 rpm 11/17/06 3/01/07 % reduct.
CO 12.4% 0.315% 97% CO 8.84% 0.63% 93%
HC 2270 ppm 430 ppm 81% HC 9280 ppm 117 ppm 99%
TEST SUMMARY:
Average reduction in 9 “healthy” vehicles
CO @ idle = 96.4% CO @ 2500 rpm = 93.0%
HC @ idle = 70.9% HC @ 2500 rpm = 64.3%
Average reduction for all 11 vehicles
CO @ idle = 87.7% CO @ 2500 rpm = 82.3%
HC @ idle = 66.4% HC @ 2500 rpm = 63.2%