This internship report details the project on highway material testing conducted by Manish Kumar under the guidance of various engineers for the Urban Extension Road-II in Delhi and Haryana. It outlines the project's objectives, which include improving connectivity to the Indira Gandhi International Airport and reducing traffic congestion, along with a comprehensive review of material testing conducted. The report also includes acknowledgments, a literature review, and discussions on laboratory testing methods for materials essential in highway construction.
![w= W1-W2/W1 x100
3.1.4 DETERMINATION OF CONSISTENCY LIMITS
AS PER IS CODE-2720 (PART-5)
OBJECTIVE:
Determination of the liquid limit of soil sample.
NEED AND SCOPE: -
Liquid limit is significant to know the stress history and general properties of the soil met with construction.
From the results of liquid limit the compression index may be estimated. The compression index value will
help us in settlement analysis. If the natural moisture content of soil.
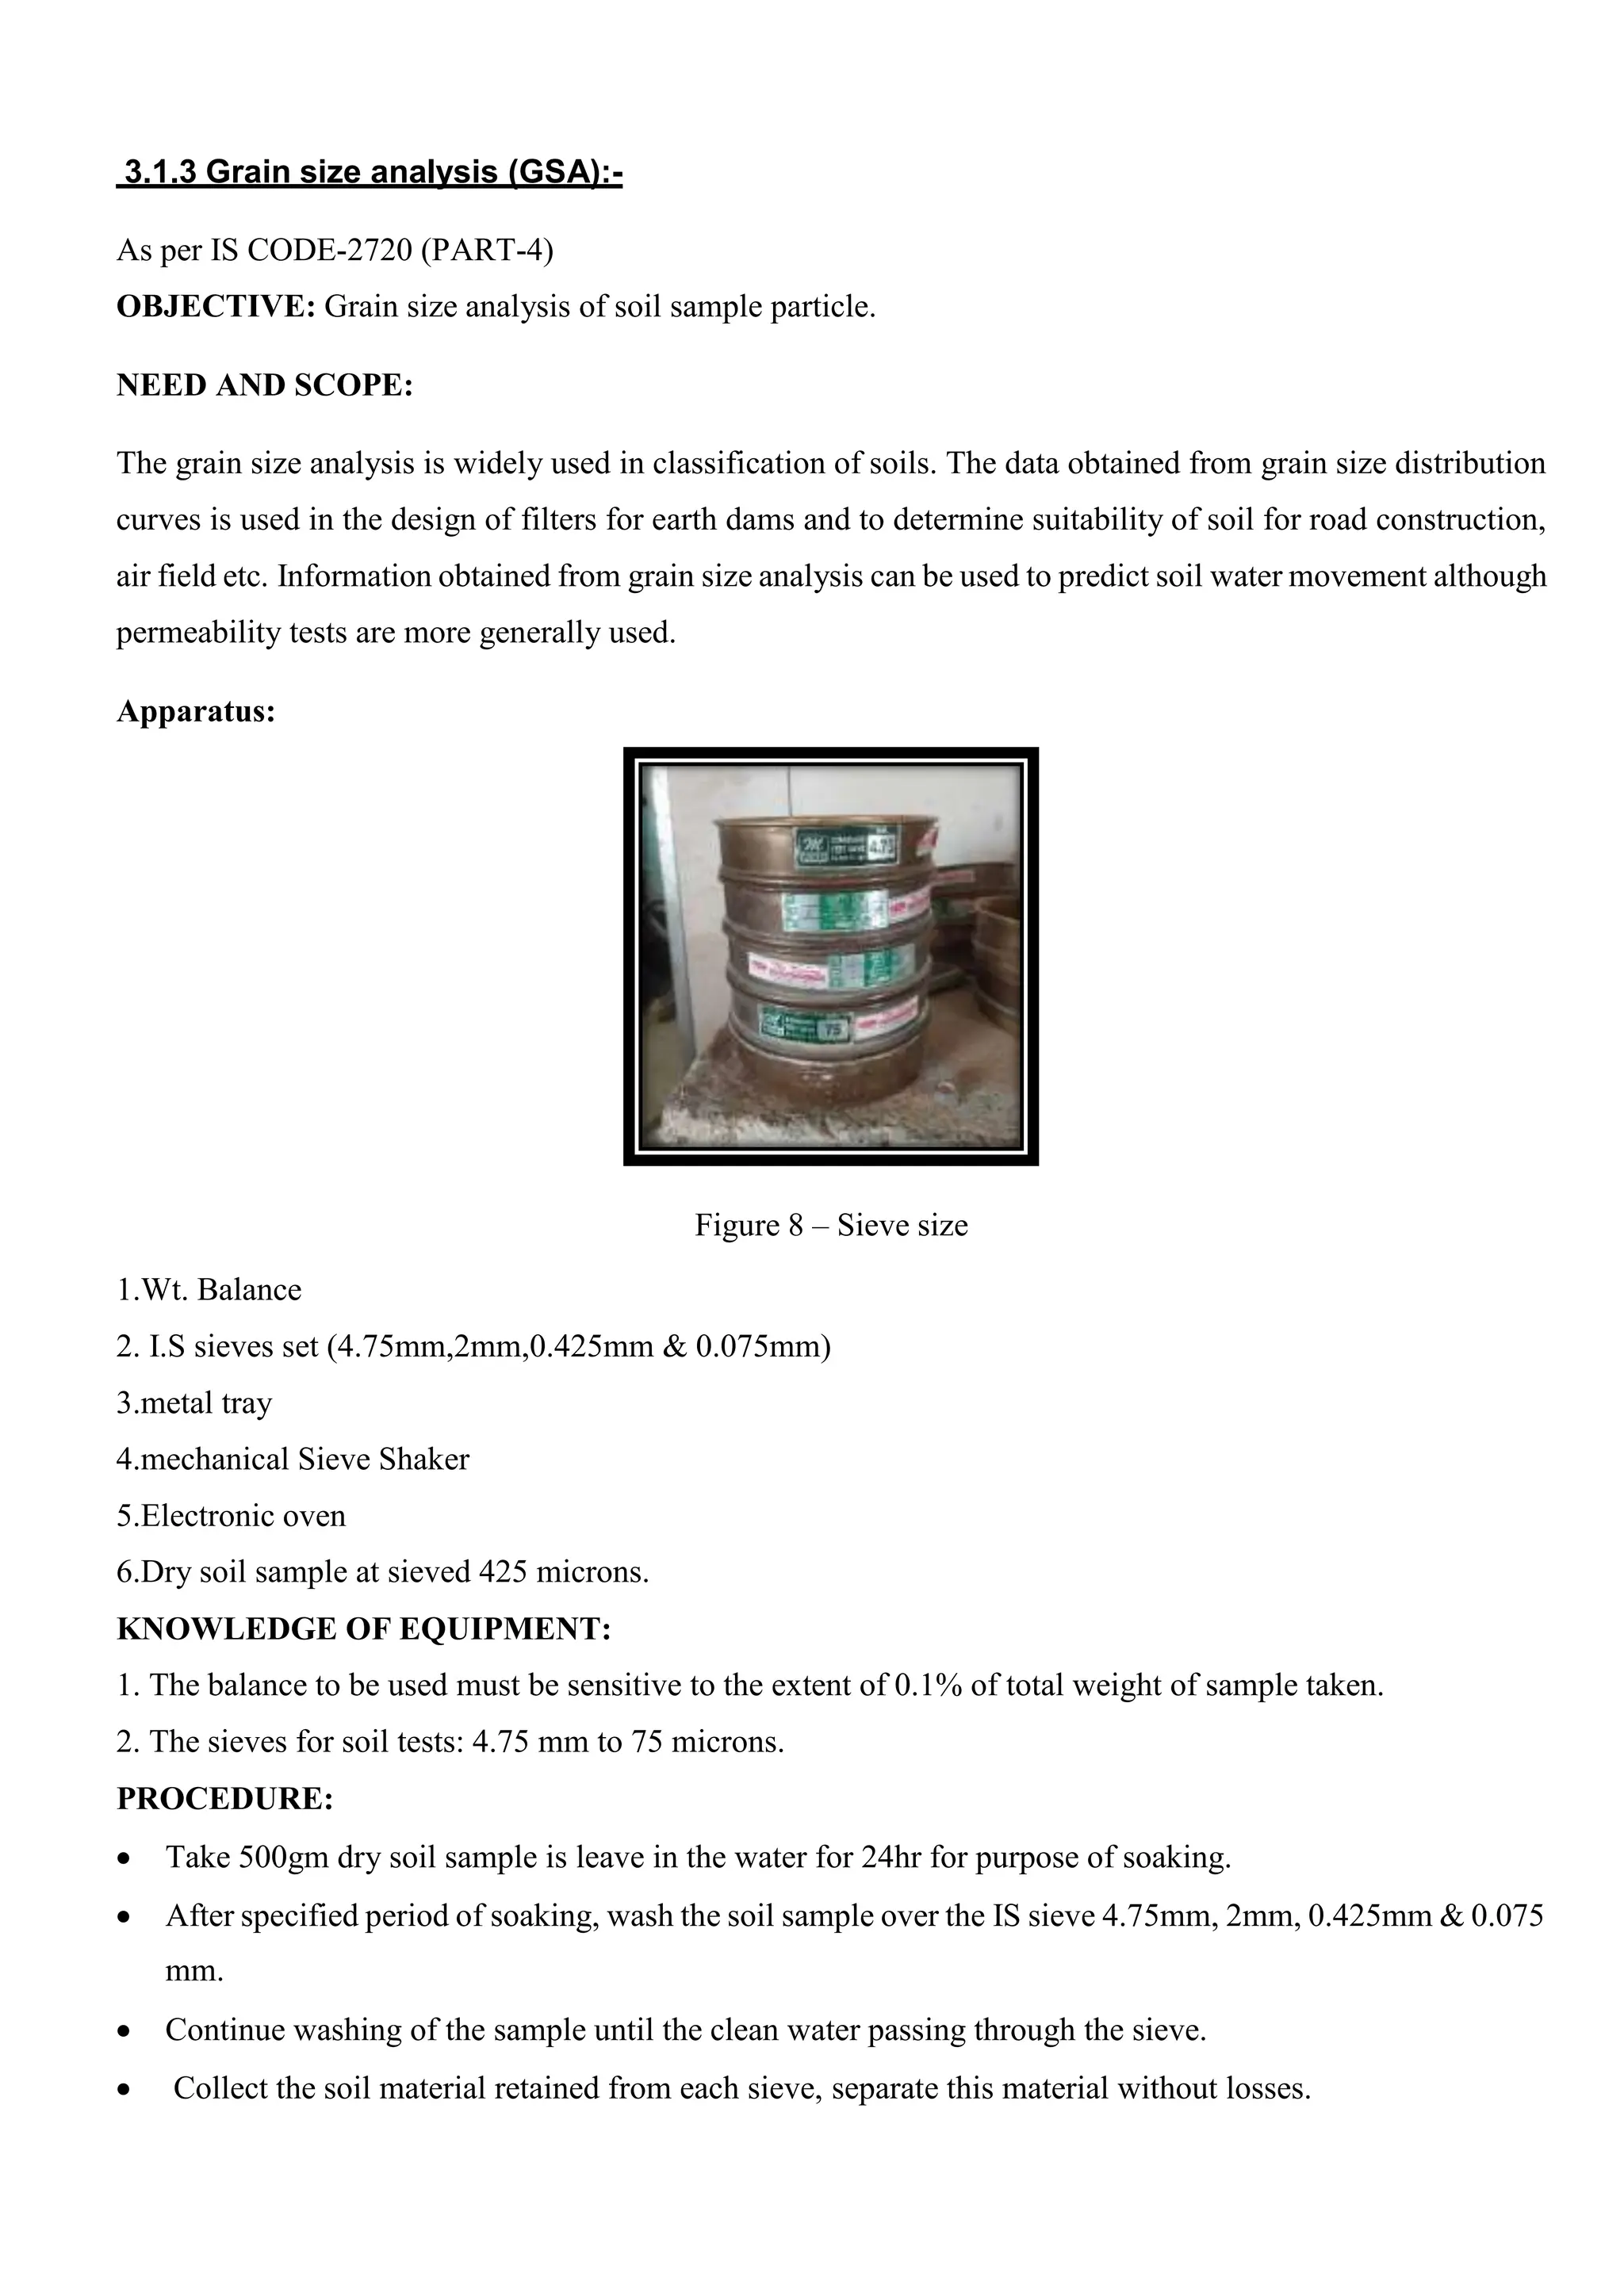
APPARATUS REQUIRED:
1. Oven
2. Balance (0.01g accuracy)
3. Sieve [425 micron]
4. Cone penetrometer
PROCEDURE:
1. About 150 gm. of air-dried soil from thoroughly mixed portion of material passing 425 micron IS sieve
is obtained.
2. Distilled water is mixed to the soil thus obtained in a mixing disc to form a uniform paste.
3. Then the wet soil paste is transferred to the cylindrical cup of cone penetrometer apparatus, ensuring
that no air is trapped in this process.
4. Finally, the wet soil is levelled up to the top of the cup and placed on the base of the cone penetrometer
apparatus.
5. The penetrometer is so adjusted that the cone point just touches the surface of the soil paste in the cup
and the initial ready is to be taken.
6. The vertical clamp is then released allowing the cone to penetrate into soil paste under its own weight
for 5 seconds. After 5 seconds the penetration of the cone is noted to the nearest millimetre.
7. The test is repeated at least to have four sets of values of penetration in the range of 14 to 28 mm.
8. The exact moisture content of each trial is determined
OBSERVATIONS AND CALCULATIONS:](https://image.slidesharecdn.com/manishprojectreport3-240220114500-9971ee73/75/PROJECT-REPORT-POLYTECHNIC-CIVIL-ENGINEE-20-2048.jpg)


![[PDF]PROJECT ON HIGHWAY BY SUBHENDU SAMUI](https://cdn.slidesharecdn.com/ss_thumbnails/project-report-subhendu-160225031340-thumbnail.jpg?width=640&height=640&fit=bounds)


