Foreign trade plays a vital role in the Indian
economy. As the country need to import diverse products so
foreign trade is extremely important to country. India exports
vast number of products and also imports an equal amount of
other products. Although India has steadily opened up its
economy, its tariffs continue to be high when compared with
other countries, and its investment norms are still restrictive.
This leads some to see India as a ‘rapid globalizer’ while
others still see it as a ‘highly protectionist’ economy.
Nonetheless, in recent years, the government’s stand on trade
and investment policy has displayed a marked shift from
protecting ‘producers’ to benefiting ‘consumers’. India is now
aggressively pushing for a more liberal global trade regime,
especially in services. This paper is an attempt to analyse the
major changes in volume, composition and direction of Indian
Foreign Trade.
International trade plays an important role in the development of economy as a whole. India is the 19th largest exporter with a share of 1.7 to the total global trade and 10th largest importer with share of 2.65 to the global merchandise trade, according to the WTO ranking for the year 2018. International trade enables the countries to widen the scope of marketing for its output. Exports of goods and services of a nation provide better employment opportunities to the people and higher standard of living of home as well as host countries. Exports lead to increase the efficiency on the national output and productivity of factors of production. Export of a country may become a growth driver of national economy. Expansion of foreign trade may bring variety of benefits to the people and economy of the country. Dr. S Senthil | Dr. S Kowsalya "An Analysis on India’s Foreign Trade" Published in International Journal of Trend in Scientific Research and Development (ijtsrd), ISSN: 2456-6470, Volume-4 | Issue-3 , April 2020, URL: https://www.ijtsrd.com/papers/ijtsrd30785.pdf Paper Url :https://www.ijtsrd.com/economics/international-economics/30785/an-analysis-on-india%E2%80%99s-foreign-trade/dr-s-senthil
Wastra publications covers analysis of manufacturing ideas in garment industry including how to set up a garment factory, opportunities, insights and trends
CBX Software’s Retail Sourcing Report provides research and analysis aimed at informing global sourcing and buying decisions for retailers, brands and other sourcing professionals.
Trends in international trade WTO report 2017-18 | International Trade | Ba...Sachin Paurush
Report on international trade in the world and their impact on the economy. This report has been published by World Trade Organisation (WTO) for 2017 - 2018 period.
International business current trends in india presentationGulshan Poddar
this presentation gives you view about current trends going on in india in international business segment
it consists of export import trade balance or deficit and also counter trade .
thank you
Export-Play, Important Role of any country’s business India is one among these countries that have been exporting a large number of product and raw material to other countries to earn economy wealth. India is 19th largest export economy. India’s overall, export- in 2019-20 was US $ 313138.5 million and total import was US $ 473995.2 million and trade balance was US $ 160856.7 million. The main object of the paper is to analyse the structural change in foreign trade- Under new Exim policy. The period of the study is from 2010-11 to 2019-20. The result shows that USA, UAE, Hongkong, UK, Germany, Saudi Arbia and China accounted from more than 40% of export from India at the world level. India total export which was US $ 330078.1 million in the year 2018-19 decline to US $ 313138.5 million in the year 2019-20. The total export from India decreased by 5.13% from the year 2018-19 to year 2019-20. In the year 2019-20 the share in total export from India to USA is 16.95%, UAE 9.21%, China 5.30%, Hongkong 3.50%, UK 2.79%, Germany 2.64%, and Saudi Arbia 1.99%. India’s total import in the year 2019-20 was US $ 473995.2 million which China contributed by 37.76%, USA 7.52%, Saudi Ariba 3.60%, Hongkong 3.5%, UAE .38% and Germany 2.81%,. The result show that USA is most important trading partner followed by UAE an UK, Hongkong, China and other countries.
Trade barriers and its effect in Bangladesh economy.Fardeen Ahmed
In this research project I did primary and secondary research to find out the effect of trade barriers( recent increase in tariff, quota) in Bangladesh.
World over the countries are facing issues after the advent of COVID 19. The countries are in a catch 22 situation..If you preserve the health the economy suffers and viceversa..The ppt explores the impact of COVID 19 lockdown on various aspects of Indian economy.
Comparative Analysis between India and China based on Imports of Goods and Se...ManpreetNayak
It is a Comparative Analysis between India and China based on Imports of Goods and Services(% of GDP), Urban Population(% of Total Population), Gross National Expenditure (% of GDP), Pre vs Post Globalization of India based on Inflation, consumer Price (annual %), use descriptive statistics and t-test for comparison.
India vs China: Trade is an Engine of GrowthAritra Ganguly
India and China are two major players in International Trade with potential to grow. This presentation takes a look at the history between these two great nations, how trade has flourished and helped economies to grow in terms of Trade Balances, how it can contribute to GDP growth, barriers to trade and how each country can maximise their potential in this regard.
Comparative Analysis between India and China based on Imports of Goods and Se...NirupamaMaharana
This is a Comparative Analysis between India and China based on Imports of Goods and Services(% of GDP), Urban Population(% of Total Population), Gross National Expenditure(% of GDP) . and Pre vs Post Globalization of India based on Inflation. Time Period is 1961-2020
Trade Performance of India Trends In Trade Tariff & Participation In Internat...Tcharticles
Link To Download Full PPT:
https://tcharticles.com/product/trade-performance-of-india/
This PPT provides ‘To The Point Information’ of India’s trade performance by analyzing India’s progress on crucial trade parameters. It is aimed at providing valuable ‘ready to use information’ to businesses across the globe & minimize their efforts, cost & time in finding the relevant researched data.
India’s merchandise trade is estimated to have hit $1,010 billion in FY 2021-2022. Goods exports crossed the ambitious target of $400 billion, while imports touched $589 billion till the beginning of Februarty2022. Exports reached USD 497.90 billion while imports reached USD 512 billion during FY2020-21; Engineering goods, petroleum products, computer & IT services are major export categories whereas imports are mainly dominated by petroleum & mineral products. Merchandise exports began to rebound in 2021-22 due to increasing demand & expansionary monetary policy adopted by developed countries in response to the impact of covid pandemic. Heavy dependence on imports of essential commodities has kept trade deficit at high level. India has a net surplus in its services trade.
Get More Insights: Download Full PPT
https://tcharticles.com/product/trade-performance-of-india/
INTERNATIONAL TRADE OF EXPORT AND IMPORT DURING COVID-19 PANDEMIC IN INDIAN E...chelliah paramasivan
International trade is a major concept welfare of labour intensive, capital, investment and technology resources promote marketing background throughout world. International trade exchanges of goods and services between countries developing economy inflation. International trade is exchanges of capital good and consumed product transfer across the international borders or territiores. International trade is lockdown period faliure of commercial activities not supply of home appliance products, natural resources during COVID-19 pandemic in Indian economy. Government of India not finalised the export and import extend the marketing network, working capital and reduction of economy growth rate. This paper highlighted is international trade of export and import during COVID-19 pademic in Indian economy.
Role of the Cotton Textiles Export Promotion Council (TEXPROCIL) In the Devel...paperpublications3
Abstract: India, a country which is known for its textile manufacturing and handlooms, since the early times; and this is revealed by literary and archaeological evidences. India’s textiles manufacturing sector is one of the pillar of the national economy. Government of India has taken many steps to create a brand of Indian textile in the global arena. All the exporters are been provided with various different promotion council to promote their items. For each item there is an export council and for textile it is TEXPROCIL (The Cotton Textiles Export Promotion Council). “ By not just pulling away the protectionist measures, but also by enhancing business sector access, avoiding policies which distort competition & also to agree on reforms to world trade regulations; with the help of these council there can be boost in trade and also seize the opportunities that it offers for everyone, in the years to come”. Undoubtedly the coin has two phases similarly, the councils has some failing points also. The drawbacks of the council have leaded the exports to battle with various problems in promoting their products. The problems are been stated below.
Strategizing the Covid-19 response for a country (Biswadeep Ghosh Hazra) - {N...Biswadeep Ghosh Hazra
Problem Statement- Asses the situation of China and, after a round of brainstorming, googling and fact-checking, come up with a solution that can liberate the country of its present problems. The solution that you are providing must take into account how China can lure in companies, solve its COVID crisis, internal issues and pay its labours sufficiently.
The case study entailed making a countrywide strategy in the wake of the COVID-19 crisis. My solution revolved around suggesting the country from being a manufacture driven economy to a service-driven one, as almost all developed nations have a strong service sector that contributes a significant chunk to the GDP
how can I sell pi coins after successfully completing KYCDOT TECH
Pi coins is not launched yet in any exchange 💱 this means it's not swappable, the current pi displaying on coin market cap is the iou version of pi. And you can learn all about that on my previous post.
RIGHT NOW THE ONLY WAY you can sell pi coins is through verified pi merchants. A pi merchant is someone who buys pi coins and resell them to exchanges and crypto whales. Looking forward to hold massive quantities of pi coins before the mainnet launch.
This is because pi network is not doing any pre-sale or ico offerings, the only way to get my coins is from buying from miners. So a merchant facilitates the transactions between the miners and these exchanges holding pi.
I and my friends has sold more than 6000 pi coins successfully with this method. I will be happy to share the contact of my personal pi merchant. The one i trade with, if you have your own merchant you can trade with them. For those who are new.
Message: @Pi_vendor_247 on telegram.
I wouldn't advise you selling all percentage of the pi coins. Leave at least a before so its a win win during open mainnet. Have a nice day pioneers ♥️
#kyc #mainnet #picoins #pi #sellpi #piwallet
#pinetwork
how to swap pi coins to foreign currency withdrawable.DOT TECH
As of my last update, Pi is still in the testing phase and is not tradable on any exchanges.
However, Pi Network has announced plans to launch its Testnet and Mainnet in the future, which may include listing Pi on exchanges.
The current method for selling pi coins involves exchanging them with a pi vendor who purchases pi coins for investment reasons.
If you want to sell your pi coins, reach out to a pi vendor and sell them to anyone looking to sell pi coins from any country around the globe.
Below is the contact information for my personal pi vendor.
Telegram: @Pi_vendor_247
Empowering the Unbanked: The Vital Role of NBFCs in Promoting Financial Inclu...Vighnesh Shashtri
In India, financial inclusion remains a critical challenge, with a significant portion of the population still unbanked. Non-Banking Financial Companies (NBFCs) have emerged as key players in bridging this gap by providing financial services to those often overlooked by traditional banking institutions. This article delves into how NBFCs are fostering financial inclusion and empowering the unbanked.
Financial Assets: Debit vs Equity Securities.pptxWrito-Finance
financial assets represent claim for future benefit or cash. Financial assets are formed by establishing contracts between participants. These financial assets are used for collection of huge amounts of money for business purposes.
Two major Types: Debt Securities and Equity Securities.
Debt Securities are Also known as fixed-income securities or instruments. The type of assets is formed by establishing contracts between investor and issuer of the asset.
• The first type of Debit securities is BONDS. Bonds are issued by corporations and government (both local and national government).
• The second important type of Debit security is NOTES. Apart from similarities associated with notes and bonds, notes have shorter term maturity.
• The 3rd important type of Debit security is TRESURY BILLS. These securities have short-term ranging from three months, six months, and one year. Issuer of such securities are governments.
• Above discussed debit securities are mostly issued by governments and corporations. CERTIFICATE OF DEPOSITS CDs are issued by Banks and Financial Institutions. Risk factor associated with CDs gets reduced when issued by reputable institutions or Banks.
Following are the risk attached with debt securities: Credit risk, interest rate risk and currency risk
There are no fixed maturity dates in such securities, and asset’s value is determined by company’s performance. There are two major types of equity securities: common stock and preferred stock.
Common Stock: These are simple equity securities and bear no complexities which the preferred stock bears. Holders of such securities or instrument have the voting rights when it comes to select the company’s board of director or the business decisions to be made.
Preferred Stock: Preferred stocks are sometime referred to as hybrid securities, because it contains elements of both debit security and equity security. Preferred stock confers ownership rights to security holder that is why it is equity instrument
<a href="https://www.writofinance.com/equity-securities-features-types-risk/" >Equity securities </a> as a whole is used for capital funding for companies. Companies have multiple expenses to cover. Potential growth of company is required in competitive market. So, these securities are used for capital generation, and then uses it for company’s growth.
Concluding remarks
Both are employed in business. Businesses are often established through debit securities, then what is the need for equity securities. Companies have to cover multiple expenses and expansion of business. They can also use equity instruments for repayment of debits. So, there are multiple uses for securities. As an investor, you need tools for analysis. Investment decisions are made by carefully analyzing the market. For better analysis of the stock market, investors often employ financial analysis of companies.
What website can I sell pi coins securely.DOT TECH
Currently there are no website or exchange that allow buying or selling of pi coins..
But you can still easily sell pi coins, by reselling it to exchanges/crypto whales interested in holding thousands of pi coins before the mainnet launch.
Who is a pi merchant?
A pi merchant is someone who buys pi coins from miners and resell to these crypto whales and holders of pi..
This is because pi network is not doing any pre-sale. The only way exchanges can get pi is by buying from miners and pi merchants stands in between the miners and the exchanges.
How can I sell my pi coins?
Selling pi coins is really easy, but first you need to migrate to mainnet wallet before you can do that. I will leave the telegram contact of my personal pi merchant to trade with.
Tele-gram.
@Pi_vendor_247
BYD SWOT Analysis and In-Depth Insights 2024.pptxmikemetalprod
Indepth analysis of the BYD 2024
BYD (Build Your Dreams) is a Chinese automaker and battery manufacturer that has snowballed over the past two decades to become a significant player in electric vehicles and global clean energy technology.
This SWOT analysis examines BYD's strengths, weaknesses, opportunities, and threats as it competes in the fast-changing automotive and energy storage industries.
Founded in 1995 and headquartered in Shenzhen, BYD started as a battery company before expanding into automobiles in the early 2000s.
Initially manufacturing gasoline-powered vehicles, BYD focused on plug-in hybrid and fully electric vehicles, leveraging its expertise in battery technology.
Today, BYD is the world’s largest electric vehicle manufacturer, delivering over 1.2 million electric cars globally. The company also produces electric buses, trucks, forklifts, and rail transit.
On the energy side, BYD is a major supplier of rechargeable batteries for cell phones, laptops, electric vehicles, and energy storage systems.
Turin Startup Ecosystem 2024 - Ricerca sulle Startup e il Sistema dell'Innov...Quotidiano Piemontese
Turin Startup Ecosystem 2024
Una ricerca de il Club degli Investitori, in collaborazione con ToTeM Torino Tech Map e con il supporto della ESCP Business School e di Growth Capital
where can I find a legit pi merchant onlineDOT TECH
Yes. This is very easy what you need is a recommendation from someone who has successfully traded pi coins before with a merchant.
Who is a pi merchant?
A pi merchant is someone who buys pi network coins and resell them to Investors looking forward to hold thousands of pi coins before the open mainnet.
I will leave the telegram contact of my personal pi merchant to trade with
@Pi_vendor_247
How to get verified on Coinbase Account?_.docxBuy bitget
t's important to note that buying verified Coinbase accounts is not recommended and may violate Coinbase's terms of service. Instead of searching to "buy verified Coinbase accounts," follow the proper steps to verify your own account to ensure compliance and security.
how to sell pi coins in South Korea profitably.DOT TECH
Yes. You can sell your pi network coins in South Korea or any other country, by finding a verified pi merchant
What is a verified pi merchant?
Since pi network is not launched yet on any exchange, the only way you can sell pi coins is by selling to a verified pi merchant, and this is because pi network is not launched yet on any exchange and no pre-sale or ico offerings Is done on pi.
Since there is no pre-sale, the only way exchanges can get pi is by buying from miners. So a pi merchant facilitates these transactions by acting as a bridge for both transactions.
How can i find a pi vendor/merchant?
Well for those who haven't traded with a pi merchant or who don't already have one. I will leave the telegram id of my personal pi merchant who i trade pi with.
Tele gram: @Pi_vendor_247
#pi #sell #nigeria #pinetwork #picoins #sellpi #Nigerian #tradepi #pinetworkcoins #sellmypi
US Economic Outlook - Being Decided - M Capital Group August 2021.pdfpchutichetpong
The U.S. economy is continuing its impressive recovery from the COVID-19 pandemic and not slowing down despite re-occurring bumps. The U.S. savings rate reached its highest ever recorded level at 34% in April 2020 and Americans seem ready to spend. The sectors that had been hurt the most by the pandemic specifically reduced consumer spending, like retail, leisure, hospitality, and travel, are now experiencing massive growth in revenue and job openings.
Could this growth lead to a “Roaring Twenties”? As quickly as the U.S. economy contracted, experiencing a 9.1% drop in economic output relative to the business cycle in Q2 2020, the largest in recorded history, it has rebounded beyond expectations. This surprising growth seems to be fueled by the U.S. government’s aggressive fiscal and monetary policies, and an increase in consumer spending as mobility restrictions are lifted. Unemployment rates between June 2020 and June 2021 decreased by 5.2%, while the demand for labor is increasing, coupled with increasing wages to incentivize Americans to rejoin the labor force. Schools and businesses are expected to fully reopen soon. In parallel, vaccination rates across the country and the world continue to rise, with full vaccination rates of 50% and 14.8% respectively.
However, it is not completely smooth sailing from here. According to M Capital Group, the main risks that threaten the continued growth of the U.S. economy are inflation, unsettled trade relations, and another wave of Covid-19 mutations that could shut down the world again. Have we learned from the past year of COVID-19 and adapted our economy accordingly?
“In order for the U.S. economy to continue growing, whether there is another wave or not, the U.S. needs to focus on diversifying supply chains, supporting business investment, and maintaining consumer spending,” says Grace Feeley, a research analyst at M Capital Group.
While the economic indicators are positive, the risks are coming closer to manifesting and threatening such growth. The new variants spreading throughout the world, Delta, Lambda, and Gamma, are vaccine-resistant and muddy the predictions made about the economy and health of the country. These variants bring back the feeling of uncertainty that has wreaked havoc not only on the stock market but the mindset of people around the world. MCG provides unique insight on how to mitigate these risks to possibly ensure a bright economic future.
Poonawalla Fincorp and IndusInd Bank Introduce New Co-Branded Credit Cardnickysharmasucks
The unveiling of the IndusInd Bank Poonawalla Fincorp eLITE RuPay Platinum Credit Card marks a notable milestone in the Indian financial landscape, showcasing a successful partnership between two leading institutions, Poonawalla Fincorp and IndusInd Bank. This co-branded credit card not only offers users a plethora of benefits but also reflects a commitment to innovation and adaptation. With a focus on providing value-driven and customer-centric solutions, this launch represents more than just a new product—it signifies a step towards redefining the banking experience for millions. Promising convenience, rewards, and a touch of luxury in everyday financial transactions, this collaboration aims to cater to the evolving needs of customers and set new standards in the industry.
Poonawalla Fincorp and IndusInd Bank Introduce New Co-Branded Credit Card
Project report of eco
1. PROJECT REPORT ON TARIFF POLICIES.:
CHOOSE ANY TWO COUNTRIES AND MAKE A DETAILED
REPORT ON THEIR TRADE RELATIONS AND THE IMPACT
OF TARIFFS ON TRADE BETWEENTHE CHOSEN
ECONOMIES
M.COM – I BANKING & FINANCE 2020-2021
SUBMITTED BY: Harshit kanakia
ROLL NO – 25
2. PROJECT REPORT ON TARIFF POLICIES.:
CHOOSE ANY TWO COUNTRIES AND MAKE A DETAILED
REPORT ON THEIR TRADE RELATIONS AND THE IMPACT
OF TARIFFS ON TRADE BETWEENTHE CHOSEN
ECONOMIES
M.COM – I BANKING & FINANCE
2020-2021
SUBMITTED BY: Harshit kanakia
ROLL NO – 25
SUBJECT: INTERNATIONAL ECONOMIES
H.R. COLLEGE OFCOMMERCE AND ECONOMICS
CHURCHGATE, MUMBAI- 400 020.
3. CONTENTS
SR NO. COMPONENTS
1.
INTRODUCTION OF INDIA-CHINA TRADE
RELATIONSHIP
2.
BILATERAL TRADE: DYNAMICS AND DIRECTION
3.
BILATERAL TRADE ANALYSIS: INTENSIVE AND
EXTENSIVE
4. HIRSCHMAN HERFINDAHL INDEX
5. TRADE COST ANALYSIS
6.
TARIFF AND NON-TARIFF ANALYSIS
7. RECENT CONDITION OF INDIA- CHINA
TRADE WAR: A WALK THROUGH THE
PANDEMIC PHASE
8. IMPACT OF INDIA- CHINA TRADE WAR ON
ECONOMIES
9. CONCLUSION
10. BIBLOGRAPHY
4. INDIA – CHINA TRADE RELATIONSHIP:THE TRADE GIANTS
OF PAST, PRESENT AND FUTURE
INTRODUCTION
The relationship between the two giants of Asia, and the world, has been
progressing at a tremendous pace. Both nations have witnessed their share
of ups-and-downs over the years. India and China todayrepresent Asia’s two
largest and most dynamic economies which are emerging as new trend setters
in international relations. The history of bilateral relations between India
and China dates back to mid 1980s1.
The process of dialogue initiated by the governments of the two countries at
that point of time was quite helpful in identifying the common trade
interests. Efforts were initiated to make the most of their economic strengths
so as to further the economy relations between India and China. In the year
1984, India and china entered into a Trade Agreement, which provided them
with the status of Most Favored Nation (MFN). It was in 1992 that the India
and China got involved in a full-fledged bilateral trade relation.
The year 1994 marked the beginning of a new era in the India- China
economic relations. In this year a double Taxation Agreement was signed
between India and China. The government of both the countries also took
the necessary initiative to turn into dialogue partners in the Association of
Southeast Asian Nations (ASEAN). In 2003, Bangkok Agreement was
signed the two countries. Under this agreement both India and china offered
some trade preferences to each other. India provided preferences on tariff
for 217 products export from India. In 2003, India and China entered into an
agreement to initiate open border trade via the Silk Route.
The two countries have also shown interest to take part in a multilateral
trade system as per the WTO commitments. China has already been the top
trading partners of India in the recent time. The economic relation between
the two countries is considered to be one of the most significant bilateral
relations in the contemporary global economic scenario and this trend is
expected to continue in the years to come. Today, China is India’s largest
trading partner; whereas India is within the top ten of China’s trading partner.
BILATERAL TRADE:DYNAMICS AND DIRECTION
The bilateral trade between India and China has grown four-fold in the past
decade. But the trade was tilted more in favor of China. India had
unfavorable balance of trade with China. While China continues to enjoy a
huge favorable balance of trade vis-à-vis most other smaller states of the
South Asian region, it is only the India-china trade that has remained to be
5. China’s most balanced trade in South Asia. However, both these nations are
growing very fast and can propel the future world economy with a pool of
the world’s largest skilled work force.
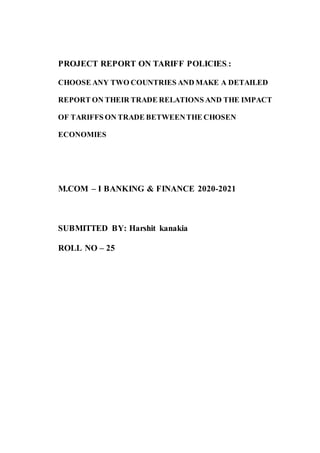
India – China Trade at a Glance (USD Billion)
Source: Trade Map Database
In 2013, China overtook UAE to become India’s biggest trading partner.
Presently, China is India’s 4th biggest export destination whereas the biggest
import source. The trade figures between India and China witnessed a
tremendous jump from USD 2.71 billion in 2001 to around 70 billion in
2016. Importantly, majority of the trade remained in favor of China as it
exported around 60.48 billion and imported 9 billion during 2016.
China s
h
ar
esinIndia’s total tradestoodataround 11%during 2016.Further, its share
inIndia’s total exports stood at 3.7% whereas its share in India’s overall
imports stood at 16% during the same period. Comparatively, the growth of
India’s imports from China was laggard with respect to exports. The trend in
trade deficit gap for India exponentially widened over the years. Majority of
the non-tariff barriers imposed by China are State Trading Enterprises (171),
followed by Sanitary and Phytosanitary Measures (118), Technical Barriers
to Trade (102) among others. Also, China has resorted to newly initiated
SPS and TBT in the recent years to curb rising imports from across the
globe. Of the total imports, it has been analyzed that around 70% of the
imports from China including electrical equipment, sound recorders and
parts thereof; mechanical appliances and parts thereof; optical and
photographic instruments and parts thereof and other items are of experience
nature, viz. majorly comprise of one-time use.
70
61.60
60 55.48 54.14
58.23
60.48
50
41.25
51.64
40
31.59
30 24.58 30.61
20
15.64
10.17
17.44 14.73 13.43
10.09
10 1.83
6.05
9.58 8.92
2.62 3.62 16.72 16.42
7.18 7.83
9.49 10.37
0.92 1.53 2.57 4.10
2001 2002 2003 2004 2005 2006 2007 2008 2009 2010 2011 2012 2013 2014 2015 2016
India imports from China India export to China
6. Despite rising presence of Chinese products in India, breakdown of India –
China trade era into four periods reveal a different story. During 2001-06,
the growth rate of imports from China were 53.6%, which were reduced to
28.8% during 2006-11 and further diminished to 1.7% during 2011-16.
Although, the trend in exports from India also remained lackluster during
the same period, with growth rate in exports to China entering into negative
trajectory of -11.8% during 2011-16.
Astoundingly, India’s share in China’s imports stood at a menial 0.6%
during 2016 revealing insignificant presence of Indian products in Chinese
markets.
India – China Trade at a Glance (April – October 2017)
USD Million Apr-17 May-17 Jun-17 Jul-17 Aug-17 Sep-17 Oct-17
India's exports to China 978.46 751.37 754.56 793.64 908.29 1036.95 1224.6
Growth (Y-o-Y) 40.08
%
3.69% 20.85% 31.85% 60.08% 38.21% 72.13%
India's imports from
China
5904.1
2
5942.42 6237.88 6026.38 6489.53 6939.07 5907.76
Growth (Y-o-Y) 64.75
%
28.80% 16.67% 19.46% 20.55% 29.72% 4.22%
Source: Ministry of Commerce and Industry
Interestingly, during April – October 2017, India’s export growth to China
witnessed a surge from 40% in April 2017to 72.13% in October 2017whereas
India’s import growth from China shrunk from 64.7% to 4.22% during the
same period previous year. Based on level of processing, India’s exports to
China shifted from Raw materials to Intermediate goods over the decade.
Around 60% of the exports to China were focused on Raw materials in
2006.
However, during 2016, share of raw materials fell to 25%, which
compensated to the rise in share of intermediate goods from 34.5% in 2006
to 50% in 2016. Conversely, based on category front, India’s industrial
export share to China fell from 95% to 84% during 2001-16. The fall in share
was compensated with the rise in share of Petroleum products and
Agricultural products. The share of petroleum exports to China from India
grew by 7 percentage points during 2001-16.
7. India’s top ten import items from China
HS
code
Product label India's imports from
China (USD
Billion)
Share
in
2020
CAG
R
2016-
20
2001 2006 2011 2016 (In %) (In %)
85 Electrical machinery and
equipment and parts thereof;
sound recorders and
reproducers, television
0.21 3.77 13.24 20.87 34.5% 9.5
%
84 Machinery, mechanical
appliances, nuclear reactors,
boilers; parts thereof
0.22 3.09 9.79 10.73 17.7% 1.8
%
29 Organic chemicals 0.29 1.62 4.08 5.59 9.2% 6.5
%
39 Plastics and articles thereof 0.02 0.32 1.21 1.84 3.0% 8.7
%
89 Ships, boats and floating structures 0.00 0.09 1.44 1.78 2.9% 4.4
%
72 Iron and steel 0.01 0.50 1.99 1.65 2.7% -3.7%
31 Fertilizers 0.01 0.10 2.73 1.54 2.5% -10.8%
90 Optical, photographic,
cinematographic,
measuring, checking,
precision, medical or
Surgical
0.04 0.18 0.92 1.31 2.2% 7.3
%
73 Articles of iron or steel 0.01 0.78 1.45 1.20 2.0% -3.7%
87 Vehicles other than railway
or tramway rolling stock,
and parts and accessories thereof
0.01 0.19 1.01 1.14 1.9% 2.5
%
Total value of top ten import items 0.82 10.64 37.86 47.64 78.8% 4.7
%
Rest of the products 1.01 5.00 17.62 12.84 21.2% -6.1%
Total Imports from China 1.83 15.64 55.48 60.48 100.0
%
1.7
%
Source: Trade Map Database
India’s toptenimports from China comprise of79%ofthe overall imports from
China. The majority of the share is held by Electrical equipment (HS-85) at
34.5%, followed by Mechanical appliances (17.7%) and Organic Chemicals
(9.2%) among others.
8. Interestingly, top ten importable products from China witnessed a positive
rise of 4.7% during 2011-16, whereas the rest of the products witnessed a
fall of -6.1% during the same period. Among top imports, electrical products
(HS 85) grew by 9.5% followed by plastic products (HS 39) at 8.7% and
Optical, photographic and other medical devices (HS 90) at 7.3% during the
same period.
India’s top ten export items to China
HS
code
Product
label
India's exports to
China (USD
Billion)
Share
in
2016
CAG
R
2011-
16
2001 2006 2011 2016 (In %) (In %)
52 Cotton 0.07 0.70 2.80 1.26 14.2% -14.7%
26 Ores, slag and ash 0.25 3.61 4.30 1.17 13.1% -23.0%
29 Organic chemicals 0.10 0.52 0.86 0.79 8.8% -1.8%
27 Mineral fuels, mineral oils and
products of them
distillation; bituminous substances
0.00 0.06 1.62 0.70 7.9% -15.4%
74 Copper and articles thereof 0.00 0.40 1.87 0.64 7.2% -19.3%
25 Salt; Sulphur; earths and
stone; plastering materials,
lime and cement
0.05 0.15 0.47 0.51 5.7% 1.5%
84 Machinery, mechanical appliances,
nuclear reactors, boilers; parts thereof
0.01 0.18 0.37 0.47 5.2% 4.5%
85 Electrical machinery and equipment
and parts thereof;
sound recorders and reproducers,
television
0.01 0.07 0.33 0.39 4.4% 3.6%
15 Animal or vegetable fats and oils
and their cleavage
products; prepared edible fats; animal
0.00 0.05 0.30 0.27 3.0% -2.1%
39 Plastics and articles thereof 0.11 0.40 0.62 0.27 3.0% -15.4%
Total value of top ten import items 0.62 6.15 13.54 6.46 72.5% -13.8%
Rest of the products 0.30 1.68 3.18 2.46 27.5% -5.0%
Total exports to China 0.92 7.83 16.72 8.92 100.0
%
-11.8%
Source: Trade Map Database
India’s top ten export items to China comprise of 73% of the overall exports to
China. The majority of the share is held by Cotton (HS 52) at 14.2%;
followed by Ores, Slag and ash (HS 26) at 13.1% and Organic Chemicals
(HS 29) at 8.8% among others.
Contrary to the rise in imports of top ten products from China, growth rate of
exports of India’s top ten items to China fell by a drastic -13.8% during
2011-16. The exportable products that witnessed majority of the fall include
9. Ores, slag and ash (HS 26) by -23%, followed by Copper (HS 74) by -
19.3%, Plastic products (HS 39) and mineral fuels (HS 27) by 15.4% each
and cotton (HS 52) by -14.7% among other during the same. period.
Machinery and Mechanical appliances witnessed highest positive growth of
4.5% among top ten exportable products to China during the same period.
Based on level of processing, India’s import pattern from China witnessed a
dramatic shift. The share of Capital goods grew from 22.4% in 2001 to
56.4% in 2016. This substantial jump in share of capital goods was
compensated for the loss in share of intermediate goods and raw materials.
The import share of intermediate goods from China fell from 47.4% to
29.4%, whereas share of raw materials fell from 20% to 1% during the same
period. Conversely, based on category, around 99% of the imports by India
from China are industrial products and merely 1% is agriculture products
indicating higher level of reliance on industrial products from China.
Less than 150 products in India have mandatory technical standards,
whereas developed countries have such standards for most of their product
ranges. The Bureau of Indian Standards, the body that lays down quality
standards for most goods in the country, has laid down 18,000 standards, but
they are all voluntary. This provides an easy passage to low-quality Chinese
products to enter into Indian markets despite of imposing anti-dumping
duties and countervailing duties. The cost price of low-quality Chinese
products is so low that despite imposing Anti-dumping duties and
countervailing duties, the unit price remains lower than Indian products.
BILATERAL TRADE ANALYSIS: INTENSIVE AND EXTENSIVE
To gather a comprehensive and in-depth information and pattern between
India and China, an intensive-cum-secondary trade analysis has been
conducted.
TRADE DEPENDENCE INDEX
The trade dependence index, or trade to GDP ratio, or the openness index is
a measure of the importance of international trade in the overall economy. It
gives an indication of the degree to which an economy is open to trade.
Openness of an economy is determined by a large number of factors, most
importantly by trade restrictions like tariffs, nontariff barriers, foreign
exchange regimes, non-trade policies and the structure of national
economies.
10. Trade-to-GDP ratio at a Glance
Source: World Bank Database and Trade Map Database
In the recent years, India’s dependence on trade has fallen from 43% in 2013
to 27% in 2016 indicating higher inclusiveness in Gross Domestic Products
and relatively lower susceptibility to external shocks and volatility, ceteris
paribus. Conversely, China’s dependence on trade has dramatically and
drastically declined from 61% in 2007 to 33% in 2016. Despite both
nations’ stronger footprint in global ecosystem as far as products are
concerned, their trade to GDP ratio remained in a comfortable position in
the recent years.
RATE OF IMPORT PENETRATION
The import penetration rate shows to what degree domestic demand (the
difference between GDP and net exports) is satisfied by imports. It is also
called as self-sufficiency ratio. The index may be used as the basis of
specific policy objectives targeting self-sufficiency. It may provide an
indication of the degree of vulnerability to certain types of external shocks.
2007 2008 2009 2010 2011
India
2012
China
2013 2014 2015 2016
30.4%
61.3%
41.9%
55.7%
33.5%
43.2%
34.4%
48.7%
41.9%
48.1%
42.6%
45.2%
43.2%
43.3%
38.2%
41.0%
31.0%
35.7%
27.3%
32.9%
11. 1.24 1.24
1.12 1.14 1.12
1.04 1.08
0.88 0.89 0.96
0.94
0.78 0.85
0.72
0.57 0.52 0.47 0.41
Rate of Import Penetration between India and China
Source: World Bank Database and Trade Map Database
Over the years, products from China have deeply penetrated into the Indian
markets. As indicated from the chart above, China’s import penetration in
India increased from 1.9% in 2007 to 2.6% in 2016. Although the trend has
witnessed a decline in the recent years due to various developments in trade
relations, it will take India nearly a decade to have a comfortable trade
balance scenario with China. Onthe other hand, India’s import penetration
rate in China’s market has remained abysmally low and has fallen to a new
low in the recent years. India’s import penetration rate in China fell from
0.44% in 2007 to 0.11% in 2016.
TRADE INTENSITY INDEX
TII or Trade Intensity Index is a uniform export share that describes whether a
country exports more or less to a destination than world does on average. TII value
greater than 1 indicates an intense trade relationship.
Trade Intensity Index between India(blue) and China(red) at a Glance 2007-
2016
2.80%
2.67% 2.60% 2.67% 2.75%
2.56%
2.39%
2.17%
2.31%
1.93%
0.44% 0.47%
0.28% 0.35% 0.32% 0.23% 0.18% 0.16% 0.13% 0.11%
2007 2008 2009 2010 2011 2012 2013 2014 2015 2016
India's ImportPenetration Rate in China China's ImportPenetration Rate in India
12. Substantiating the claims of Import Penetration Rate, China has created a
significant presence in India’s ever growing consumer market. China has an
intense export relationship with India, however, vice versa is not true. India’s
export relationship with China has remained laggard and abysmal since the
beginning oftheir traderelationship. China’s TII inIndia grew from 0.88in 2012
to1.24in2016whereas India’s TIIin China hasconsistently fallen from 0.94in
2007to0.34in 2016 indicating an unintended presence of Indian products in
China’s market.
HIRSCHMAN HERFINDAHL INDEX
HHI or Hirschman-Herfindahl Index is used to estimate the export
concentration of India and China in each other’s market. HHI as 1 indicates least
diversified portfolio of exports whereas 0 indicates a perfectly diversified
portfolio. It is assumed that diversification of exports is essential for
developing countries as it gives them the space to develop competence over
a broader range of manufactured commodities. Nations grow through
entrepreneurial dynamism and not by depending on what they have
traditionally done well.
HIRSCHMAN HERFINDAHL INDEX BETWEEN INDIA AND CHINA
As illustrated from the chart above, India’s imports from China are highly
concentrated onfewer products compared to India’s export toChina. India’s
exports to China are evidently very diverse as far as product categories are
concerned (at HS-02). The trend in Hirschman Herfindahl Index suggests
that over the years India’s export basket to China has expanded making it less
susceptible to any volatility in China whereas China’s export basket toIndia
has become concentrated.
0.7
0.6
0.5
0.4
0.3
0.2
2007 2008 2009 2010 2011 2012 2013 2014 2015 2016
Import from China Export to China
13. GRUBEL LLOYD INDEX FOR INTRA INDUSTRY TRADE
Additionally, GLI or Grubel-Lloyd Index helps in measuring the scale of intra-
industry trade between nations. Nations can hugely benefit from Intra-industry
trade due to economies of scale. GLI value 0 indicates pure inter-industry trade
whereas 1 indicates pure intra-industry trade.
ADJUSTED GRUBEL – LLOYD INDEX FOR INTRA – INDUSTRY TRADE
BETWEEN INDIA AND CHINA
Source: PHD Research Bureau; Compiled from World Integrated Trade Database; at HS-
02
The intra-industry trade relationship between India and China has expanded
consistently over the years. Around 53% of the trade between India and
China is in the form of intra-industry, or similar products. This share has
increase from 28% in 2007 to 53% in 2016.
TRADE COST ANALYSIS
Trade cost analysis provides an optimal viewpoint to access the overall cost as a
percentage of overall export, which is incurred during trade between two
nations. Trade costs are the price equivalent of the reduction of international
trade compared with the potential implied by domestic production and
consumption in the origin and destination markets. Higher bilateral trade costs
result in smaller bilateral trade flows.
The crux of the analysis suggests that despite rising complementarities in each
other’s market, both the nations are not able to intensify their trade relationship,
perhaps due to different priorities at hand. Nevertheless, both the nations should
zero in on the removal of different bottlenecks in doing trade with each other
and note that with rising complementarity, both the nations should focus on
grasping this opportunity. Further, the trade relationship and regime should be
revisited to arrive at a balance trade mechanism. The regime should not favor
0.60
0.50 0.53
0.50
0.40
0.30
0.20
0.10
0.00
0.35
0.40 0.41
0.35 0.35
0.28 0.29
0.26
2007 2008 2009 2010 2011 2012 2013 2014 2015 2016
14. any one nation; in this case the trade highly favors China whereas India is left
with a huge trade deficit in its balance of trade. Despite being contiguous
nations, India and China witnessed extremely high trade cost. Trade cost for
agricultural products rose exorbitantly from 166% in 2010 to 213% in 2015.
Although the data for manufacturing trade cost is not available for the recent
years, the overall trade cost eased to 100% on the back of lower manufacturing
trade cost during 2013. Both India and China need to reduce the extra barriers
imposed on agricultural products to boost the Agri-products trade and reduce
the ever-rising trade costs.
TARIFF ANALYSIS
A tariff is a tax imposed by a country on an imported item. It adds to the cost of
imported goods and is one of several trade policies that a country can enact.
The data on tariffs imposed by China on different products imported from India
(at HS-02) level revealed some startling figures. The average tariff imposed by
China on Dairy products from World was 10.79% compared to 2% on India
during 2011. Similarly, tariffs on products like Edible fruit and nuts, coffee and
tea, products of milling industry, preparations of meat and fish, cocoa,
beverages, residues from food industry, footwear, lead and articles thereof,
railways, ships and boats, and aircrafts are lower in case of India compared to
the average tariff imposed by China on world.
Tariff Scenario in China (Simple Average in percentage terms)
The overall tariff structure revealed that certain products from India attracted
comparatively higher tariffs. The tariff on products such as Tobacco (29.25%);
27 Mineral fuels, mineral oils and products of their 3.88 4.52 4.46 6.87
28 Inorganic chemicals; organic or inorganic compound 4.51 5.19 4.68 5.39
29 Organic chemicals 5.05 5.63 4.97 5.76
30 Pharmaceutical products 3.79 3.57 3.87 4.04
31 Fertilizers 15.78 4.5 9.48 14.42
32 Tanning or dyeing extracts; tannins and their 6.37 7.06 6.16 7.16
33 Essential oils and resinoids; perfumery, cosmetic 10.19 11.49 10.04 12.8
34 soap, organic surface-active agents, washing 7.64 8.79 7.74 8.64
35 Albuminoidal substances; modified starches; glues; 7.91 8.04 7.83 8.04
36 Explosives; pyrotechnic products; matches; 7.24 7.08
37 Photographic or cinematographic goods 10.19 9.42 10.85 11.38
38 Miscellaneous chemical products 5.99 6.79 5.91 7.28
39 Plastics and articles thereof 6.62 7.28 6.38 7.4
40 Rubber and articles thereof 9.46 11.27 9.27 11.28
15. sugars and sugar products (25.17%); cereals (21.75%); edible preparations
(20.7%); prepared feathers and articles thereof (19.92%); preparations of
vegetables, fruits, nuts (19.75%); miscellaneous manufactured articles
(18.67%); fur skins and artificial fur (17.95%); musical instruments (17.74%);
preparations of cereals, flour, starch or milk (17.26%); clocks and watches and
parts thereof (15.91%); headgear and parts thereof (14.86%); other made-up
textile articles (14.56%); fertilizers (14.42%); vehicles other than railway or
tramway (14.15%); natural or cultured pearls (13.65%); articles of apparel and
clothing accessories, not knitted (13.04%); articles of leather, saddlery and
harness (13.02%); articles of stone, plaster, cement, asbestos, mica (13%); glass
and glassware (13%); carpets and other textile floor coverings (12.82%); animal
or vegetable fats and oils (12.8%); essential oils and resinoids, perfumery,
cosmetics (12.8%) among others.
NON-TARIFF BARRIERS ANALYSIS
Export prospects of a country are not completely determined by tariff reduction
or tariff elimination. While every country tries to maximize its export prospects
by gaining market access to the other country, the importing country equally
tries to restrict the access of the exporting countries because in the event of
import surge its own sensitive sectors get weakened. In context to that, they
protect their sensitive sectors by raising non-tariff measures (NTMs). Non-tariff
barriers (NTMs) can take various forms. Broadly these can be categorized as
import policy barriers, standards, testing, labelling and certification
requirements, anti-dumping and countervailing measures, export subsidies and
domestic support government procurement. Unlike tariffs that directly increase
the price of imports and indirectly limit the cost of imports. NTMs tend to have
a significant trade-reducing affect that is on par with tariffs. With tariffs on
various products coming down each year, the onus of restricting surging
imports lies on variety of non-trade measures.
Various Non-Tariff Barriers imposed by China on World (as on 31st June 2017)
In
force
Initiated
SPS 118 1074
TBT 102 1085
Anti-dumping 95 5
Countervailing 4 1
Safeguards 2 0
Quantitative Restrictions 42 0
Tariff Rate Quotas 10 0
16. State Trading Enterprises 171 0
Source: WTO’s Integrated Trade Intelligence Portal (I-TIP)
Various Non-Tariff Barriers imposed by India on World (as on 31st June 2017)
In
force
Initiated
SPS 29 135
TBT 2 100
Anti-dumping 248 80
Countervailing 1 1
Safeguards 3 0
Conversely, Majority of the non-tariff measures imposed by India were Anti-
dumping duties (248); followed by Quantitative restrictions (59) and Sanitary
and Phytosanitary Measures and State Trading Enterprises (29 each) among
others. Further, in the recent years, India has resorted more towards
implementing newer SPSs, TBTs and Antidumping duties. Interestingly, around
anti-dumping duties were imposed on 93 Chinese products whereas 40 new
initiatives were started by India2.
Less than 150 products in India have mandatory technical standards, whereas
developed countries have such standards for most of their product ranges. The
Bureau of Indian Standards, the body that lays down quality standards for most
goods in the country, has laid down 18,000 standards, but they are all voluntary.
This provides an easy passage to low-quality Chinese products to enter into
Indian markets despite of imposing anti-dumping duties and countervailing
duties. The cost price of low-quality Chinese products is so low that despite
imposing Anti-dumping duties and countervailing duties, the unit price remains
lower than Indian products.
Around 90 products from China are under the anti-dumping duty ambit.
However, merely putting anti-dumping duties won’t help curbing imports as unit
value of certain products are so low that despite anti-dumping duty the final
value remains lower than unit value of the same product from different
countries. It is imperative for us to assess whether the Chinese imports are
substituting or complementing the domestic production in India with specific
emphasis on sectors like Steel, Urea and other chemicals, Electronics, Telecom
and consumer products of mass consumption. Additional duties on imports of
intermediate and capital goods from China might become counterproductive in
17. case those products are utilized to propel the domestic production in India.
RECENT CONDITIONOF INDIA- CHINA TRADE WAR: A
WALK THROUGH THE PANDEMIC PHASE
India’s trade with China last year fell to the lowest since 2017, with the trade
imbalance declining to a five-year low on the back of a slump in India’s imports
from China. Two-way trade in 2020 reached $87.6 billion, down by 5.6%, according
to new figures from China’s General Administration of Customs (GAC). India’s
imports from China accounted for $66.7 billion, declining by 10.8% year-on-year
and the lowest figure since 2016. India’s exports to China, however, rose to the
highest figure on record, for the first time crossing the $20 billion-mark and growing
16% last year to $20.86 billion. The trade deficit, a source of friction between India
and China, declined to a five year-low of $45.8 billion, the lowest since 2015. While
there was no immediate break-up of the data in 2020, India’s biggest import in 2019
was electrical machinery and equipment, worth $20.17 billion. Other major imports
in 2019 were organic chemicals ($8.39 billion) and fertilisers ($1.67 billion), while
India’s top exports were iron ore, organic chemicals, cotton and unfinished
diamonds. The past 12 months saw a surge in demand for iron ore in China with a
slew of new infrastructure projects aimed at reviving growth after the COVID-19
slump.
China’s total iron ore imports were up 9.5 per cent in 2020. Whether 2020 is an
exception or marks a turn away from the recent pattern of India’s trade with China
remains to be seen. While India’s imports from China declined, so did India’s
imports overall with a slump in domestic demand last year. There is, as yet, no
evidence to suggest India has replaced its import dependence on China by either
sourcing those goods elsewhere or manufacturing them at home, and the trade
pattern of the coming 12 months, as India’s economy begins to rebound, will reveal
whether the past year was an exception or a turning point. The decline in exports to
India bucked the trend of a strong year for Chinese exports, which surged 10.9% in
December and grew 4% in 2020, aided by the economic recovery in China while
many countries remained in various states of lockdown. This marked a sharp
turnaround for the world’s second-largest economy, which saw its GDP contract
6.8% during the height of the COVID-19 outbreak in the first quarter of the year and
18. a 4.9% fall in foreign trade from January until May. With a stringent lockdown
bringing the outbreak in China under control by the summer, the economy
rebounded to grow 3.2% in the second quarter and 4.9% in the third, with China’s
industries humming back to life with much of the rest of the world in lockdown.
China was “the world's only major economy to have registered positive growth in
foreign trade in goods,” Li Kulwin, spokesperson of the GAC, said, with China’s
foreign trade and exports in the first 10 months of the year accounting for a record
12.8% and 14.2% of the global total. That was reflected in the annual export figures,
recording a sharp rise with most of China’s major trading partners. Exports to
ASEAN countries, China’s largest trading partner last year with $684 billion in
annual trade, were up 6.7%, while exports to the EU, China’s second-largest trading
partner, were also up 6.7%, with trade reaching $649 billion. Despite the trade war
with the U.S. and the pandemic, two-way trade was up 8.3% to $586 billion, with
Chinese exports up 7.9% to reach a record $451 billion. The trade surplus with the
U.S. was $317 billion in 2020, higher than the $288 billion figure at the end of
President Donald Trump’s first year in office in 2017, underlining the limited impact
of his tariff and trade war as he ends his presidency.
19. IMPACT OF INDIA- CHINA TRADE WAR ON ECONOMIES
India is one of the largest manufacturers of generic drugs. But it has not been
able to export to China because of China’s protectionist policies. While Indian
pharmaceutical companies exporting generic drugs to the United States and
Europe, as most of the drugs have received FDA and EU approval, it is quite
striking that China does not allow imports of drugs from India.
As tensions simmer at the border between India and China, what is more concerning is
the economic fall out of the souring relationship between the two countries. This is
because the economic interdependence of the two neighbours is too deep to be
ignored. China and the US are the largest two trading partners of India. While Indian
exports to the US outnumber the imports from the country, the same is not true when it
comes to China. And hence, to become friends-turned-foes with India would have
business repercussions in China, too. For the period between April 2019 and February
this year, China accounted for 11.8 per cent of India’s total imports. However, India’s
total exports to the country was a mere 3 per cent. Clearly, we buy more from China than
we sell. This trade deficit with China, also a major contributor to India's overall trade
deficit, is one of the world's biggest trade deficits between two nations. The deficit with
China stood at $3.3 billion in February, a 13 per cent rise from the year-ago period. This
is even as India’s overall trade deficit remained flat from a year ago at $9.8 billion.
20. It is no secret that India is the biggest market for Chinese businesses outside their own
country. Citing Gateway House research, CNN reported that Chinese investors have
poured some $4 billion into Indian tech start-ups since 2015.
Alibaba, for example, has invested in Indian e-commerce company Snapdeal, digital
wallet Paytm and food delivery platform Zomato. Tencent, meanwhile, has backed Indian
messaging company Hike and ride hailing app Ola. Gateway House found that more than
half of India's 30 unicorns—private firms worth more than $1 billion—have Chinese
investors. Meanwhile, India changed its FDI policy in April soon after the People's Bank
of China decided to up its stake in India's HDFC bank to over 1 per cent.
As per the tweak, neighbouring nations can invest in Indian firms only after getting the
Centre's approval for the same. China retaliated saying India's new policy violated
WTO's principle of non-discrimination and are against the general trend of free trade.
And Huawei is still in the running to help build 5G networks in India's fast-growing
internet economy, despite a US-led campaign against the Chinese company.
The Indian government has already started mulling amending the latest telecom
tenders to cause a body blow to Huawei. According to various reports, more such
measures will follow. China’s Xiaomi leads the India smartphone market with 30 per cent
market share, followed by Vivo, Samsung, Realm and Oppo.
To be sure, several large Chinese companies spanning handsets, electronic devices and
internet firms are deeply invested in India’s consumer market where a fast growing
middle-class and an aspirational young consumer base has helped propel the growth for
companies such as Xiaomi Corp, BBK Electronics that owns brands such as Oppo, Vivo,
among others; apart from electronics goods company TCL.
India's emergence as the biggest overseas market for Chinese mobile phone companies is
one of the most significant developments in China's relations with India over the past five
years. The India sales of those top Chinese smartphone brands totalled more than $16
billion in 2019, according to IDC. The Chinese smartphone makers have already built
factories and created jobs in India. Interestingly, these smartphone makers have embraced
Prime Minister Narendra Modi's "Make in India" programme. Xiaomi locally
manufactures 95 per cent of the phones it sells in India. And hence, any adverse
announcements forcing Chinese businesses to shut shop in India will add to the
burgeoning unemployment rates in India. While it is widely perceived that India might be
21. most impacted economically in case of a conflict with China, the latter, too, will lose a
significant and perhaps, one of the most easily accessible markets. Hence, China will
stand as much to lose as India.
CONCLUSION
During the first decade of 21st century, the presence of Chinese products in
Indian market has grown profoundly and exponentially. During 2001-2016,
India’s imports from China jumped to a whopping 33 times, from USD 1.83
billion toUSD 60.48billion. Astoundingly, India’s trade deficit with China
expanded 57 times during the same period. India's trade deficit with China
narrowed marginally to USD 51.57 billion in 2016-17 from USD 52.69 billion
in 2015-16. However, the magnitude of trade deficit is exorbitant.
In 2016, India was the 7th largest export destination for Chinese products, and
the 27th largest exporter to China. India - China trade in the first four months of
2017 increased by 19.92% year-on- year toUSD 26.02billion. India’s exports to
China increased by45.29% year-on-year to USD 5.57 billion while India’s
imports from China saw a year-on-year growth of 14.48% to USD 20.45 billion.
The Indian trade deficit with China has further increased by 6.07% year-on-year
to USD 14.883 billion during the same period.
With industrialization gaining pace, India’s import pattern with China has shifted
dramatically from intermediate goods to capital goods. India’s import share of
capital goods from China jumped from 47% in 2011 to 57% in 2016 whereas
share of intermediate goods fell from 37% to 29% during the same period.
China has been able to enhance its footprint in India to a greater extent. The
intensity of Chinese products in Indian market has been continuously rising
since 2009.
Conversely, Indian products have a weak intensity in China’s market and have been
consistently falling over the years. Onthe diversification front, China’s basket of
exports to India is highly concentrated and intensive towards fewer selected
products. This enhances the situation of high volatility due to higher reliance on
fewer products.
Total FDI inflows from China to India between April 2000 and September 2017
stood at USD 1.738 billion wherein China’s share was roughly 0.49% which
rightfully indicates that China is not a significant and substantial investor in
India as compared to Singapore, Mauritius and Switzerland. Conversely, in
recent years, China has invested heavily in billions of dollars in various
22. countries.
Unlike trade, levels of investment between China and India remain relatively
low. Though an estimated 100 companies from each country have offices in the
other, cumulative bilateral FDI is less than USD 500 million. Cross-border
investment remains low because Chinese and Indian companies are still in the
early stages of learning how to operate and succeed in each other’s economies.
Due to cheap labor and economies of scale, china offers low-priced imports
such as textiles and clothing, electronic devices, machinery, etc. Further,
exploiting the huge Indian market to dump their products and indirectly killing
Indian units. Chinese products are affecting our manufacturing units and many
of them have had to shut their shops. There are so many Chinese toys in the
market that Indian toy industry is finding very hard to survive. In the last 5
years, many of the Indian toy companies have been shut down.
Going ahead, with the shift in taste and preferences for Chinese products
coupled with growing and competitive Indian production capabilities and shift
in the consumption patterns of Indian consumers, the fame of Chinese products
in Indian market will further witness a decline in the coming years.
23. BIBLOGRAPHY
WEBSITES
www.intracen.org
commerce.gov.in
dipp.gov.in
tradeind.govt.tt
www.mti.gov.sg
economictimes.com
www.moti.gov.gh
www.trademap.org
Blog.smallcase.com
www.foreignpolicy.com
www.moneycontrol.com
www.financialexpress.com
www.thewire.in
www.theoutlookindia.com
www.indatoday.com
www.globaltimes.com
www.wikipedia.com
www.researchdeptgovt.com
www.ncaer.org
Journals.sagepub.com
Edition.cnn.com
www.bloombergquint.com
www.livemint.com
www.phdcci.in
www.niti.gov.in.
BOOKS:
China’s India war: collision course of the roof of the world by Bertel Lintner
Fateful triangle: How china shaped US- India relations during the cold war by
Tanvi Madan.
India china relations: the border issues and beyond
China-India relations: Geo political relations, economic cooperation and cultural
exchange
Routledge handbook of China – India relations
India – China relations: Future Perspectives
China – Nepal -India Triangle: The Dark side of Indo- Nepal relations
Singh, Joginder (2014); A Comparative Study of India-China Bilateral Trade
Power shift: India- China relations in a multipolar world
Shifting superpowers by martin sieff
India-China relations in contemporary world by Yang Lu