
Recommended
More Related Content
Similar to Project profilevol 1
Similar to Project profilevol 1 (20)
Project profilevol 1
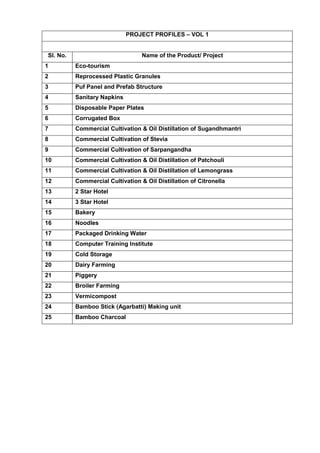
- 1. PROJECT PROFILES – VOL 1 Sl. No. Name of the Product/ Project 1 Eco-tourism 2 Reprocessed Plastic Granules 3 Puf Panel and Prefab Structure 4 Sanitary Napkins 5 Disposable Paper Plates 6 Corrugated Box 7 Commercial Cultivation & Oil Distillation of Sugandhmantri 8 Commercial Cultivation of Stevia 9 Commercial Cultivation of Sarpangandha 10 Commercial Cultivation & Oil Distillation of Patchouli 11 Commercial Cultivation & Oil Distillation of Lemongrass 12 Commercial Cultivation & Oil Distillation of Citronella 13 2 Star Hotel 14 3 Star Hotel 15 Bakery 16 Noodles 17 Packaged Drinking Water 18 Computer Training Institute 19 Cold Storage 20 Dairy Farming 21 Piggery 22 Broiler Farming 23 Vermicompost 24 Bamboo Stick (Agarbatti) Making unit 25 Bamboo Charcoal
- 2. 1.0 INTRODUCTION Eco-tourism is a concept developed around the idea of travelling to places of natural beauty, moving around and staying with the places of nature for a couple of days. It has the twin objectives of conserving environment and improving the welfare of the local people. Countries like Kenya, Costa Rica, and South Africa have already successfully promoted eco-tourism. Kerala presents a unique success story of eco-tourism in our country. On this similar line, North East States has immense scope for eco-tourism, as its natural beauty with diverse flora and fauna is vastly unexplored. The green forests, blue hills, enchanting rivers are the basis on which an eco-friendly tourism can be developed. For that a host of matters to be properly addressed, include: (a) development of a motorable road to the spots of tourist attraction, (b) creation of infra-structural facilities like good quality accommodation and fooding, (c) river cruising and water sports, bird watching towers, etc. These facilities are likely to attract eco-tourists. This project profile on Eco-tourism is for development of a river eco camp based around faciltiies of river rafting and angling. The unit will be set up with 7 nos of boats and 5 Nos of cottages. Each cottage will be double bedded, thus having accomodation capacity 10 persons per day. 2.0 MARKET POTENTIAL Adventure sports activities like rock-climbing, trekking, para-sailing, water sports, river rafting and angling are being promoted by different state governments of the North East Region. In Assam, there is an annual angling competition, which attracts not only the local enthusiasts but also participation from Indian and foreign tourists. With rising incomes, adventure and recreational activities like angling are being taken up by more and more people in the North East. As such, the target customer for the present project is not dependent on the tourists alone. 3.0 COST OF THE PROJECT The estimated project cost is given below. (Rs. in lacs) Particulars Amount (Rs) Land & Site Development 6.60 Building & Civil Works 27.01 Equipments 3.06 Misc. Fixed Assets 6.03 Preliminary & Pre-operative Expenses 1.36 Contingencies & Escalation @ 3% 1.28 Working Capital Margin 1.81 TOTAL 47.17 3.1 Land & Site Development: No cost has been cosidered for land. Expenses on site development are estimated as below. Particulars Area (rm) Rate (Rs) Amount (Rs) Motorable approach road 1000 400 400000 Gravel pathway 800 200 160000 Site levelling, etc LS LS 100000 TOTAL 660000 Say (Rs. in lacs) 6.60 3.2 Building & Civil Works: Details of building & civil works are given below. Particulars Area (Sqm) Rate (Rs) Amount (Rs) 5 Nos. of Cottages (Brick wall, CGI sheet roof, Concrete Floor) 210 6000 1260000
- 3. Restaurant (Brick wall, CGI sheet roof, Concrete Floor) 72 6000 432000 Staff Quarters & Store Room (Brick wall, CGI sheet roof, Concrete Floor) 120 6000 720000 Sub total 2412000 Add: Electrification, water supply and sanitation @ 12% 289440 TOTAL 2701440 Say (Rs. in lacs) 27.01 3.3 Equipments: Details of equipments are given below. Particulars Qty Rate (Rs) Amount (Rs) Boats (Dare Devils-6 Persons) 2 60000 120000 Boats (River Queen-4 Persons) 4 35000 140000 Life Jacket 15 800 12000 Miscellaneous items LS LS 10000 Sub total 282000 Add: Installation, transporation, etc @ 5% 14100 TOTAL 306100 Say (Rs. in lacs) 3.06 3.4 Misc. Fixed Assets: Details of miscellaneous fixed assets are given below. Particulars Qty Rate (Rs) Amount (Rs) 25 KVA DG Set 1 347000 347000 3 HP pump set (water supply system) 1 100000 100000 Ceiling Fans 11 1000 11486 Water Purifiers 5 7500 37500 Cots 31 1500 46500 Tables & Chairs 41 1000 41000 Miscellaneous items LS LS 10000 Sub total 593486 Add: Installation, transporation, etc @ 5% 29674 TOTAL 603486 Say (Rs. in lacs) 6.03 3.5 Preliminary & Pre-operative expenses: Details of preliminary & pre-operative expenses are given below. (Rs. In lacs) Particulars Amount (Rs) Travelling expenses 0.20 Professional & other fees 0.20 Interest during implementation 0.86 Miscellaneous expenses 0.10 TOTAL 1.36 3.6 Contingencies & Escalation: Contingencies & escalation has been assumed at 3% of the cost of land & site develepment, building & civil works, equipments and miscellaneous fixed assets. 3.7 Working Capital: Details of working capital are given below. (Rs. in lacs) Particulars Period (Days) Amount Year 1 Year 2 Year 3
- 4. Food & Provisions 30 0.25 0.32 0.39 Power & Fuel 30 0.23 0.30 0.37 Salary 30 1.33 1.33 1.34 Total 1.81 1.95 2.09 Working Capital Margin in Year 1 (100%) 1.81 4.0 MEANS OF FINANCE The means of finance for the project is estimated as below. (Rs. in lacs) Particulars Percent Amount EQUITY A. Equity from Promoters 40% 18.87 B. Subsidy from Central/ State Govt. - DEBT Term Loan from Banks/ FIs 60% 28.30 TOTAL 100% 47.17 5.0 PROFITABILITY STATEMENT (Rs. in lacs) Particulars Yr 1 Yr 2 Yr 3 Yr 4 Yr 5 Yr 6 Yr 7 A. INCOME Income at installed capacity (Rs lakhs) 72.74 72.74 72.74 72.74 72.74 72.74 72.74 Capacity utilisation 35% 45% 55% 55% 55% 55% 55% Income from sales/ annum 25.46 32.73 40.01 40.01 40.01 40.01 40.01 B. OPERATING EXPENSES Food & Provisions 3.02 3.89 4.75 4.75 4.75 4.75 4.75 Power & Fuel 2.83 3.64 4.45 4.45 4.45 4.45 4.45 Salary 16.20 16.23 16.26 16.30 16.33 16.36 16.40 Repair & Maintenance 0.42 0.46 0.51 0.56 0.62 0.68 0.75 Selling Expenses 0.25 0.33 0.40 0.40 0.40 0.40 0.40 Miscellaneous Expenses 0.13 0.16 0.20 0.20 0.20 0.20 0.20 Total Operating Expenses 22.86 24.72 26.58 26.66 26.75 26.84 26.94 Less: working expenses capitalised 1.81 0.00 0.00 0.00 0.00 0.00 0.00 Operating profit 4.41 8.02 13.43 13.35 13.26 13.16 13.06 C. FINANCIAL EXPENSES Depreciation 1.45 1.45 1.45 1.45 1.45 1.45 1.45 Interest on Term Loan 2.26 2.09 1.71 1.34 0.96 0.58 0.20 Net Profit 0.70 4.48 10.27 10.57 10.85 11.14 11.41 Net cash accruels 2.15 5.93 11.72 12.01 12.30 12.58 12.86 Principal Repayment 0.00 4.72 4.72 4.72 4.72 4.72 4.72 5.1 Income from sales: Income from sales at installed capacity is estimated as below. Income from Accomodation No. of cottages 5 No. of beds/ cottage 2 No. of days/ annum 360 Total rooms/ annum 3600 Rate (Rs/ day) 1200 Income from rooms at installed capacity (Rs) 4320000
- 5. Income from Boats No. of small boats 4 No. of large boats 2 Rate per Trip (full day) for Small Boat 550 Rate per Trip full day) for Large Boat 1100 No. of days/ annum 360 Income from boats at installed capacity (Rs) 794200 Income from Restaurant No. of guests/ annum at installed capacity 3600 Cost of fooding/ day 500 Other items like tea, snacks, etc per day 100 Income from restaurant at installed capacity (Rs) 2160000 Total income at installed capacity (Rs) 7274200 5.2 Food & Provisions: Expenses on food & provisions has been assumed @ 40% of income from restaurant. 5.3 Power & Fuel: Expenses on power & fuel at installed capacity is estimated as below. A. Expenses on power Particulars Quantity Power (Kw) Total (Kw) hrs/ day kwh/ day 3 HP water pump 1 2.24 2.24 3 6.71 Ceiling Fans 11 0.50 5.74 10 57.43 General Lighting 20 0.10 2.01 8 16.08 Miscellsneous 1.00 8 8.00 Total power requirement/ day (Kw) 88.22 Average load 70% Proportion running on power 80% Days/ annum 360 Rate per unit (Rs) 5.00 Expenses on power per annum (Rs) 88928 B: Estimate of Diesel required for Generator Hrs/ day 2 Diesel consumption (litres/ hr) 20 Days/ annum 360 Diesel Price per liter 50 Expenses on diesel (Rs) 720000 Expenses on power & fuel per annum at installed capacity (Rs) 808928 5.4 Salary: Expenses on salary salary in the 1st year is estimated as given below. It is assumed that salary expenses will increase @ 0.2% every subsequent year. Particulars of Employee Numbers Salary/ Month (Rs) Cost/ annum (Rs) Manager 1 15000 180000 Technicians/ skilled workers 10 8000 960000 Waiters/ attendants 5 5000 300000 Unskilled workers/ helpers 5 3000 180000 Expenses on salary in the 1st year (Rs) 1620000
- 6. 5.5 Repair & Maintenance: Expenses on repair & maintenance in the 1st year is estimated as given below. It is assumed that expenses on repair & maintenance will increase @ 10% every subsequent year. (Rs. in lacs) Particulars Cost (Rs) Rate Amount (Rs) Building & Civil Works 27.01 1% 0.27 Equipments 3.06 2% 0.06 Misc. Fixed Assets 6.03 2% 0.09 Expenses on repair & maintenance in year 1 0.42 5.6 Selling Expenses: Selling expenses have been assumed at 1% of sales. 5.7 Miscellaneous Expenses: Miscellaneous expenses have been assumed at 0.5% of sales. 5.8 Depreciation: Depreciation has been calculated by straight line method. The details of calculation are given below. (Rs in lacs) Description Cost (Rs) Rate Amount/ annum (Rs) Building & Civil Works 27.01 3.34% 0.90 Equipments 3.06 5.28% 0.16 Misc. Fixed Assets 6.03 6.33% 0.38 TOTAL 1.45 5.9 Interest on Term Loan & Principal Repayment: Interest rate has been assumed at 8%. Duration of Loan repayment has been considered for a period of 7 years including moratarium period of 1 year with equal monthly installments. The details of calculation are given below. (Rs in lakh) Year 1 2 3 4 5 6 7 Month 1 Opening balance 28.30 28.30 23.58 18.87 14.15 9.43 4.72 Repayment 0.00 0.39 0.39 0.39 0.39 0.39 0.39 Interest (8%) 0.19 0.19 0.16 0.13 0.09 0.06 0.03 Closing balance 28.30 27.91 23.19 18.47 13.76 9.04 4.32 Month 2 Opening balance 28.30 27.91 23.19 18.47 13.76 9.04 4.32 Repayment 0.00 0.39 0.39 0.39 0.39 0.39 0.39 Interest 0.19 0.19 0.15 0.12 0.09 0.06 0.03 Closing balance 28.30 27.51 22.80 18.08 13.36 8.65 3.93 Month 3 Opening balance 28.30 27.51 22.80 18.08 13.36 8.65 3.93 Repayment 0.00 0.39 0.39 0.39 0.39 0.39 0.39 Interest 0.19 0.18 0.15 0.12 0.09 0.06 0.03 Closing balance 28.30 27.12 22.40 17.69 12.97 8.25 3.54 Month 4 Opening balance 28.30 27.12 22.40 17.69 12.97 8.25 3.54 Repayment 0.00 0.39 0.39 0.39 0.39 0.39 0.39 Interest 0.19 0.18 0.15 0.12 0.09 0.06 0.02 Closing balance 28.30 26.73 22.01 17.30 12.58 7.86 3.14 Month 5 Opening balance 28.30 26.73 22.01 17.30 12.58 7.86 3.14 Repayment 0.00 0.39 0.39 0.39 0.39 0.39 0.39 Interest 0.19 0.18 0.15 0.12 0.08 0.05 0.02 Closing balance 28.30 26.34 21.62 16.90 12.19 7.47 2.75 Month 6 Opening balance 28.30 26.34 21.62 16.90 12.19 7.47 2.75 Repayment 0.00 0.39 0.39 0.39 0.39 0.39 0.39 Interest 0.19 0.18 0.14 0.11 0.08 0.05 0.02 Closing balance 28.30 25.94 21.23 16.51 11.79 7.08 2.36
- 7. Month 7 Opening balance 28.30 25.94 21.23 16.51 11.79 7.08 2.36 Repayment 0.00 0.39 0.39 0.39 0.39 0.39 0.39 Interest 0.19 0.17 0.14 0.11 0.08 0.05 0.02 Closing balance 28.30 25.55 20.83 16.12 11.40 6.68 1.97 Month 8 Opening balance 28.30 25.55 20.83 16.12 11.40 6.68 1.97 Repayment 0.00 0.39 0.39 0.39 0.39 0.39 0.39 Interest 0.19 0.17 0.14 0.11 0.08 0.04 0.01 Closing balance 28.30 25.16 20.44 15.72 11.01 6.29 1.57 Month 9 Opening balance 28.30 25.16 20.44 15.72 11.01 6.29 1.57 Repayment 0.00 0.39 0.39 0.39 0.39 0.39 0.39 Interest 0.19 0.17 0.14 0.10 0.07 0.04 0.01 Closing balance 28.30 24.76 20.05 15.33 10.61 5.90 1.18 Month 10 Opening balance 28.30 24.76 20.05 15.33 10.61 5.90 1.18 Repayment 0.00 0.39 0.39 0.39 0.39 0.39 0.39 Interest 0.19 0.17 0.13 0.10 0.07 0.04 0.01 Closing balance 28.30 24.37 19.65 14.94 10.22 5.50 0.79 Month 11 Opening balance 28.30 24.37 19.65 14.94 10.22 5.50 0.79 Repayment 0.00 0.39 0.39 0.39 0.39 0.39 0.39 Interest 0.19 0.16 0.13 0.10 0.07 0.04 0.01 Closing balance 28.30 23.98 19.26 14.54 9.83 5.11 0.39 Month 12 Opening balance 28.30 23.98 19.26 14.54 9.83 5.11 0.39 Repayment 0.00 0.39 0.39 0.39 0.39 0.39 0.39 Interest 0.19 0.16 0.13 0.10 0.07 0.03 0.00 Closing balance 28.30 23.58 18.87 14.15 9.43 4.72 0.00 Principal Repayment 0.00 4.72 4.72 4.72 4.72 4.72 4.72 Interest 2.26 2.09 1.71 1.34 0.96 0.58 0.20 6.0 DEBT SERVICE COVERAGE RATIO (DSCR) (Rs. in lacs) Year 1 2 3 4 5 6 7 TOTAL Profit After Tax (Net Profit) 0.70 4.48 10.27 10.57 10.85 11.14 11.41 Depreciation 1.45 1.45 1.45 1.45 1.45 1.45 1.45 Interest 2.26 2.09 1.71 1.34 0.96 0.58 0.20 Total 4.41 8.02 13.43 13.35 13.26 13.16 13.06 78.70 Interest 2.26 2.09 1.71 1.34 0.96 0.58 0.20 Loan repayment 0.00 4.72 4.72 4.72 4.72 4.72 4.72 Total 2.26 6.81 6.43 6.05 5.68 5.30 4.92 37.45 DSCR 1.95 1.18 2.09 2.21 2.34 2.48 2.65 Average DSCR = 2.10 7.0 BREAK EVEN POINT (BEP) (Rs. in lacs) Year 1 2 3 A. Net sales (Rs. lakh) 25.46 32.73 40.01 B. Variable cost Food & Provisions 3.02 3.89 4.75 Power & Fuel 2.83 3.64 4.45 Miscellaneous Expenses 0.13 0.16 0.20 Total variable cost 5.98 7.69 9.40 C. Contribution (A-B) 19.48 25.04 30.61
- 8. D. Fixed & Semi-fixed Costs Salary 16.20 16.23 16.26 Repair & maintenance 0.42 0.46 0.51 Interest on Term Loan 2.26 2.09 1.71 Depreciation 1.45 1.45 1.45 Total fixed cost 20.33 20.23 19.93 E. BREAKEVEN POINT 104.39% 80.80% 65.13% F. BEP at operating capacity 36.54% 36.36% 35.82% G. Cash BEP 33.94% 33.76% 33.22% 8.0 INTERNAL RATE OF RETURN (IRR) (Rs. in lacs) Year 0 1 2 3 4 5 6 7 CASH OUTFLOW Capital Expenditure 42.71 0.00 0.00 0.00 0.00 0.00 0.00 0.00 Working Capital 0.00 1.81 0.14 0.14 0.00 0.00 0.00 0.00 Total (A) 42.71 1.81 0.14 0.14 0.00 0.00 0.00 0.00 CASH INFLOW Profit After Tax 0.70 4.48 10.27 10.57 10.85 11.14 11.41 Add: Depreciation 1.45 1.45 1.45 1.45 1.45 1.45 1.45 Add: Interest 2.26 2.09 1.71 1.34 0.96 0.58 0.20 Add: Salvage Value (10%) 4.27 Total (B) 0.00 4.41 8.02 13.43 13.35 13.26 13.16 17.34 NET FLOW (B-A) -42.71 2.60 7.88 13.29 13.35 13.26 13.16 17.34 IRR = 15%
- 9. 1. INTRODUCTION Over the years, India has made significant progress in the industrial world with healthy economic growth. On purchase power parity basis, it is one of the top five global economics and is expected to be the third largest by the turn of this decade. Plastics, one of the fastest growing industries in India, have a vital role to play. Indian Plastics Industry is expanding at a phenomenal pace. Major international companies from various sectors such as automobiles, electronics, telecommunications, food processing, packing, healthcare etc. have set-up large manufacturing bases in India. Therefore, demand for plastics is rapidly increasing and soon India will emerge as one of the fastest growing markets in the world. The rising demand for plastic products around the world is giving a boost to the plastic industry. The next two decades are expected to offer unprecedented opportunities for the plastic industry in India. This would necessitate industry initiatives to foster investments, grow the market, upgrade quality standards, enhance global participation, encourage Indian industry, to adopt and adapt to world class technology and manufacturing practices. The Indian plastic processing industry is highly fragmented and comprises 25,000 firms. Barring 10% - 15% of the firms, which can be classified as medium scale operations, all the units operate on a small-scale basis. This project profile is for setting up of a Reprocessed Plastic Granules manufacturing unit with installed capacity of 324 MT per annum. 2. MARKET POTENTIAL In India, the top 100 players account for just 20% of the industry turnover. The total number of players in the sector is more than 25,000. Despite the small size of operations of the players, they are able to operate profitably. Further, the high growth in demand ensures that the market is able to absorb the excess capacity in quick time. Thus, there is scope for setting up more of small scale plastic processing units. 3. MANUFACTURING PROCESS The manufacturing process for Reprocessed Plactic Granues is described below. (a) Waste plastic scraps are collected and sorted as per colour and then washed in washing machine. (b) Washed scrap is dried under hydro dryer machine. (c) These dry scrap materials are put in the grinder machine, so that the scraps are cut down to small pieces. (d) The small pieces of plastic waste are put in the mixer machine so that the moisture is removed totally. (e) After removing moisture, these plastics are put in the extruder machine, goes through various processes inside it and results in the output as reprocessed plastic granules (dana). 4. COST OF THE PROJECT The estimated project cost is given below. (Rs. in lacs) Particulars Amount (Rs) Land & Site Development 3.00 Building & Civil Works 22.61 Plant & Machinery 17.48 Misc. Fixed Assets 13.42 Preliminary & Pre-operative Expenses 5.98 Contingencies & Escalation @ 3% 1.61 Working Capital Margin 5.79 TOTAL 69.88
- 10. 4.1 Land & Site Development: No cost has been considered for purchase of land. Details of expenses on site development are given below. Particulars Area (Sqm) Rate (Rs) Amount (Rs) Earth filling, boundary fencing, etc. LS LS 300000 Say (Rs. in lacs) 3.00 4.2 Building & Civil Works: Details of building & civil works are given below. Particulars Area (Sqm) Rate (Rs) Amount (Rs) Factory building (Open shed with CGI sheet roof, concrete floor) 450 3500 1575000 Store, office, labor quarters, etc (Brick wall, CGI sheet roof, concrete floor) 80 6000 480000 Sub total 2055000 Add: Electrification, sanitation, etc @ 10% 205500 TOTAL 2260500 Say (Rs. in lacs) 22.61 4.3 Plant & Machinery: Details of plant & machinery are given below. Particulars Qty Rate (Rs) Amount (Rs) Extruder 1 800000 800000 Scrap grinder 1 175000 175000 High speed mixer machine 1 150000 150000 Hydro dryer machine 1 95000 95000 Washing machine 1 200000 200000 Miscellaneous items LS LS 100000 Sub total 1520000 Add: Installation, transporation, taxes, etc @ 15% 228000 TOTAL 1748000 Say (Rs. in lacs) 17.48 4.4 Misc. Fixed assets: Details of miscellaneous fixed assets are given below. Particulars Qty Rate (Rs) Amount (Rs) Installation of Transformer (100 kva) 1 200000 200000 100 kva DG set 1 800000 800000 Weighing scale 1 20000 20000 Furniture & fixtures LS LS 100000 Miscellaneous items LS LS 100000 Sub total 1220000 Add: Installation, transporation, etc @ 10% 122000 TOTAL 1342000 Say (Rs. in lacs) 13.42 4.5 Preliminary & pre-operative expenses: Details of preliminary & pre-operative expenses are given below. (Rs. In lacs) Particulars Amount (Rs) Travelling expenses 1.00 Professional & other fees 1.00 Interest during implementation 3.48 Miscellaneous expenses 0.50
- 11. TOTAL 5.98 4.6 Contingencies & escalation: Contingencies & escalation has been assumed at 3% of the cost of land & site development, building & civil works, plant & machinery and miscellaneous fixed assets. 4.7 Working capital: Details of working capital are given below. (Rs. in lacs) Period (Days) Total Current Assets Year 1 Year 2 Year 3 Raw Materials 30 3.76 4.39 5.02 Power & fuel 30 0.45 0.52 0.60 Salary 30 1.27 1.28 1.29 Finished Goods 30 5.63 6.36 7.09 Receivables 15 3.36 3.82 4.37 Total 14.47 16.38 18.36 Working Capital Margin in Year 1 (40%) 5.79 5. MEANS OF FINANCE The means of finance for the project is estimated as below. (Rs. in lacs) Particulars Percent Amount EQUITY A. Equity from Promoters 40% 27.95 B. Subsidy from Central/ State Govt. - DEBT Term Loan from Banks/ FIs 60% 41.93 TOTAL 100% 69.88 6. PROFITABILITY STATEMENT (Rs. in lacs) Particulars Yr 1 Yr 2 Yr 3 Yr 4 Yr 5 Yr 6 Yr 7 A. INCOME Production capacity (MT) 324.00 324.00 324.00 324.00 324.00 324.00 324.00 Capacity utilisation 60% 70% 80% 80% 80% 80% 80% Production at CU (MT) 194.40 226.80 259.20 259.20 259.20 259.20 259.20 Sale price (Rs/ MT) 42000 41000 41000 41000 41000 41000 41000 Income from sales/ annum 81.65 92.99 106.27 106.27 106.27 106.27 106.27 B. OPERATING EXPENSES Raw Materials 45.80 53.44 61.07 61.07 61.07 61.07 61.07 Power & Fuel 5.47 6.38 7.30 7.30 7.30 7.30 7.30 Salary 15.48 15.56 15.64 15.71 15.79 15.87 15.95 Repair & Maintenance 0.54 0.59 0.65 0.71 0.78 0.86 0.95 Selling Expenses 0.82 0.93 1.06 1.06 1.06 1.06 1.06 Miscellaneous Expenses 0.41 0.46 0.53 0.53 0.53 0.53 0.53 Total Operating Expenses 68.52 77.36 86.25 86.39 86.54 86.70 86.86 Less working expenses capitalised 5.79 0.00 0.00 0.00 0.00 0.00 0.00 Operating profit 18.92 15.62 20.03 19.88 19.73 19.58 19.41 C. FINANCIAL EXPENSES Depreciation 2.53 2.53 2.53 2.53 2.53 2.53 2.53
- 12. Interest on Term Loan 5.66 5.23 4.28 3.34 2.40 1.45 0.51 Interest on Working Capital Loan 1.39 1.57 1.76 1.76 1.76 1.76 1.76 Net Profit 9.34 6.30 11.45 12.25 13.05 13.83 14.61 Net cash accruels 11.87 8.82 13.98 14.78 15.57 16.36 17.14 Principal Repayment 0.00 6.99 6.99 6.99 6.99 6.99 6.99 6.1 Estimation of Production: Production of plastic granules at installed capacity is estimated as below. Output of plastic granules per hr (kg) 135 Hrs/ day 8 Days/ annum 300 Production of plastic grabules per annum at installed capacity (Kg) 324000 6.2 Raw Materials: Expenses on raw materials at installed capacity is estimated as below. Plastic scrap (kg) 324000 Calcium carbonate @ 2% of scrap 6480 Raw material utilised (kg) 330480 Average price of raw materials (Rs/ kg) 22 Expenses on raw materials (Rs) 7270560 Add: Expenses on consumables, packing materials, etc @ 5% 363528 Expenses on raw materials & consumables at installed capacity (Rs) 7634088 6.3 Power & Fuel: Expenses on power & fuel at installed capacity is estimated as below. A. Expenses on power Connected load 100 Avg load factor 70% Proportion running on power 80% Hrs/ day 8 Days/ annum 300 Annual power consumption 134400 Rate (Rs/ unit) 5 Expenses on power per annum at 100% capacity (Rs) 672000 B: Estimate of Diesel Proportion running on fuel (diesel) 20% Hrs/ annum 480 Diesel consumption (litres/ hr) 10 Diesel Price per litre 50 Expenses on diesel per annum at 100% capacity (Rs) 240000 Expenses on power & fuel at 100% capacity (Rs) 912000 6.4 Salary: Expenses on salary in the 1st year is estimated as given below. It is assumed that salary expenses will increase @ 0.5% every subsequent year. Particulars of Employee Numbers Salary/ Month (Rs) Cost/ annum (Rs) Manager 1 25000 300000 Supervisor 1 12000 144000 Accounts Officer 1 12000 144000 Technicians/ machine operators 5 8000 480000 Sales staff 2 5000 120000 Unskilled workers/ helpers 10 3000 360000 Expenses on salary in the 1st year (Rs) 1548000
- 13. 6.5 Repair & Maintenance: Expenses on repair & maintenance in the 1st year is estimated as given below. It is assumed that expenses on repair & maintenance will increase @ 10% every subsequent year. (Rs. in lacs) Particulars Cost (Rs) Rate Amount (Rs) Building & Civil Works 22.61 1% 0.23 Plant & Machinery 17.48 1% 0.17 Misc. Fixed Assets 13.42 1% 0.13 Expenses on repair & maintenance in year 1 0.54 6.6 Selling Expenses: Selling expenses have been assumed at 1% of sales. 6.7 Miscellaneous Expenses: Miscellaneous expenses have been assumed at 0.5% of sales. 6.8 Depreciation: Depreciation has been calculated by straight line method. The details of calculation are given below. (Rs in lacs) Description Cost (Rs) Rate Amount/ annum (Rs) Building & Civil Works 22.61 3.34% 0.76 Plant & Machinery 17.48 5.28% 0.92 Misc. Fixed Assets 13.42 6.33% 0.85 TOTAL 2.53 6.9 Interest on Term Loan & Principal Repayment: Interest rate has been assumed at 13.5%. Duration of Loan repayment has been considered for a period of 7 years including moratarium period of 1 year with equal monthly installments. The details of calculation are given below. (Rs in lakh) Month Year 1 2 3 4 5 6 7 Month 1 Opening balance 41.93 41.93 34.94 27.95 20.96 13.98 6.99 Repayment 0.00 0.58 0.58 0.58 0.58 0.58 0.58 Interest (13.5%) 0.47 0.47 0.39 0.31 0.24 0.16 0.08 Closing balance 41.93 41.35 34.36 27.37 20.38 13.39 6.41 Month 2 Opening balance 41.93 41.35 34.36 27.37 20.38 13.39 6.41 Repayment 0.00 0.58 0.58 0.58 0.58 0.58 0.58 Interest 0.47 0.47 0.39 0.31 0.23 0.15 0.07 Closing balance 41.93 40.76 33.78 26.79 19.80 12.81 5.82 Month 3 Opening balance 41.93 40.76 33.78 26.79 19.80 12.81 5.82 Repayment 0.00 0.58 0.58 0.58 0.58 0.58 0.58 Interest 0.47 0.46 0.38 0.30 0.22 0.14 0.07 Closing balance 41.93 40.18 33.19 26.21 19.22 12.23 5.24 Month 4 Opening balance 41.93 40.18 33.19 26.21 19.22 12.23 5.24 Repayment 0.00 0.58 0.58 0.58 0.58 0.58 0.58 Interest 0.47 0.45 0.37 0.29 0.22 0.14 0.06 Closing balance 41.93 39.60 32.61 25.62 18.64 11.65 4.66 Month 5 Opening balance 41.93 39.60 32.61 25.62 18.64 11.65 4.66 Repayment 0.00 0.58 0.58 0.58 0.58 0.58 0.58 Interest 0.47 0.45 0.37 0.29 0.21 0.13 0.05 Closing balance 41.93 39.02 32.03 25.04 18.05 11.06 4.08 Month 6 Opening balance 41.93 39.02 32.03 25.04 18.05 11.06 4.08 Repayment 0.00 0.58 0.58 0.58 0.58 0.58 0.58 Interest 0.47 0.44 0.36 0.28 0.20 0.12 0.05 Closing balance 41.93 38.44 31.45 24.46 17.47 10.48 3.49 Month 7 Opening balance 41.93 38.44 31.45 24.46 17.47 10.48 3.49
- 14. Repayment 0.00 0.58 0.58 0.58 0.58 0.58 0.58 Interest 0.47 0.43 0.35 0.28 0.20 0.12 0.04 Closing balance 41.93 37.85 30.86 23.88 16.89 9.90 2.91 Month 8 Opening balance 41.93 37.85 30.86 23.88 16.89 9.90 2.91 Repayment 0.00 0.58 0.58 0.58 0.58 0.58 0.58 Interest 0.47 0.43 0.35 0.27 0.19 0.11 0.03 Closing balance 41.93 37.27 30.28 23.29 16.31 9.32 2.33 Month 9 Opening balance 41.93 37.27 30.28 23.29 16.31 9.32 2.33 Repayment 0.00 0.58 0.58 0.58 0.58 0.58 0.58 Interest 0.47 0.42 0.34 0.26 0.18 0.10 0.03 Closing balance 41.93 36.69 29.70 22.71 15.72 8.74 1.75 Month 10 Opening balance 41.93 36.69 29.70 22.71 15.72 8.74 1.75 Repayment 0.00 0.58 0.58 0.58 0.58 0.58 0.58 Interest 0.47 0.41 0.33 0.26 0.18 0.10 0.02 Closing balance 41.93 36.11 29.12 22.13 15.14 8.15 1.16 Month 11 Opening balance 41.93 36.11 29.12 22.13 15.14 8.15 1.16 Repayment 0.00 0.58 0.58 0.58 0.58 0.58 0.58 Interest 0.47 0.41 0.33 0.25 0.17 0.09 0.01 Closing balance 41.93 35.52 28.54 21.55 14.56 7.57 0.58 Month 12 Opening balance 41.93 35.52 28.54 21.55 14.56 7.57 0.58 Repayment 0.00 0.58 0.58 0.58 0.58 0.58 0.58 Interest 0.47 0.40 0.32 0.24 0.16 0.09 0.01 Closing balance 41.93 34.94 27.95 20.96 13.98 6.99 0.00 Principal Repayment 0.00 6.99 6.99 6.99 6.99 6.99 6.99 Interest 5.66 5.23 4.28 3.34 2.40 1.45 0.51 6.10 Interest on Working Capital Loan: Interest rate on working capital loan has been assumed at 16%. Details of calculation are given below. (Rs. in lacs) Particulars Year 1 Year 2 Year 3 Total current assets 14.47 16.38 18.36 Bank Loan (60%) 8.68 9.83 11.02 Interest @ 16% 1.39 1.57 1.76 7. DEBT SERVICE COVERAGE RATIO (DSCR) (Rs. in lacs) Year 1 2 3 4 5 6 7 TOTAL Profit After Tax (Net Profit) 9.34 6.30 11.45 12.25 13.05 13.83 14.61 Depreciation 2.53 2.53 2.53 2.53 2.53 2.53 2.53 Interest 5.66 5.23 4.28 3.34 2.40 1.45 0.51 Total 17.53 14.05 18.26 18.12 17.97 17.81 17.65 121.40 Interest 5.66 5.23 4.28 3.34 2.40 1.45 0.51 Loan repayment 0.00 6.99 6.99 6.99 6.99 6.99 6.99 Total 5.66 12.22 11.27 10.33 9.39 8.44 7.50 64.81 DSCR 3.10 1.15 1.62 1.75 1.91 2.11 2.35 Average DSCR = 1.87 8. BREAK EVEN POINT (BEP) (Rs. in lacs) Year 1 2 3 A. Net sales (Rs. lakh) 81.65 92.99 106.27
- 15. B. Variable cost Raw Materials 45.80 53.44 61.07 Power & Fuel 5.47 6.38 7.30 Selling Expenses 0.82 0.93 1.06 Miscellaneous Expenses 0.41 0.46 0.53 Interest on Working Capital Loan 1.39 1.57 1.76 Total variable cost 53.89 62.79 71.73 C. Contribution (A-B) 27.76 30.20 34.55 D. Fixed & Semi-fixed Costs Salary 15.48 15.56 15.64 Repair & maintenance 0.54 0.59 0.65 Interest on Term Loan 5.66 5.23 4.28 Depreciation 2.53 2.53 2.53 Total fixed cost 24.20 23.90 23.09 E. BREAKEVEN POINT 87.19% 79.15% 66.85% F. BEP at operating capacity 52.32% 55.40% 53.48% G. Cash BEP 46.85% 49.54% 47.63% 9. INTERNAL RATE OF RETURN (IRR) (Rs. in lacs) Year 0 1 2 3 4 5 6 7 CASH OUTFLOW Capital Expenditure 56.51 0.00 0.00 0.00 0.00 0.00 0.00 0.00 Working Capital 0.00 14.47 1.90 1.98 0.00 0.00 0.00 0.00 Total (A) 56.51 14.47 1.90 1.98 0.00 0.00 0.00 0.00 CASH INFLOW Profit After Tax 9.34 6.30 11.45 12.25 13.05 13.83 14.61 Add: Depreciation 2.53 2.53 2.53 2.53 2.53 2.53 2.53 Add: Interest 5.66 5.23 4.28 3.34 2.40 1.45 0.51 Add: Salvage Value Total (B) 0.00 17.53 14.05 18.26 18.12 17.97 17.81 17.65 NET FLOW (B-A) -56.51 3.06 12.15 16.28 18.12 17.97 17.81 17.65 IRR = 15%
- 16. 1.0 INTRODUCTION Polyurethane Foam (PUF) is a closed cell plastic capable of being molded into boards and blocks that can be used as a construction material, which is both low on maintenance and durable. PUF leads to energy saving and reduced heating/cooling loads. These are normally available in PPGI sandwiched options of varying length. PUF applications can found in cold rooms, refrigerated vehicles, Green buildings, warehousing and storage applications and low cost housing. As per the requirement Sandwiched PUF panels of different thickness and length can be manufactured with consistence chemical and physical properties as per relevant national and international standards. These PUF Panels are used in insulated buildings as Wall, Floor, and Roof Panels. The pre-engineered PUF Panels helps to reduce on site waste and ensure the quality of installation, greatly reducing the risk of air leakages, cold bridging and inconsistent insulation. PUF is base component for any of the applications, be it cold storage, doors, mobile vans or residential / office use. Though there are number of insulation solutions PUF is preferred over others because of it has better insulation characteristics. When PUF is sandwiched between two powder coated GI sheets, it gives mechanical strength also. That is why PUF panels are very good proposition for walls as well as roofs. There is extensive use of PUF panels in medical industry be it operation theaters or pharmaceutical plants. Pre-Engineered Building (PEB) based PUF insulated structures are widely used in defence, housing, warehousing etc. There is scope to customize all specific requirements with the proper technology The Puf Panels are generally used in the following: PUF Insulated Shelters / Barracks High Altitude Habitat Ultra Light Weight Structures Ground+1 PEB Structures with PUF Insulation Bullet Proof Shelters and Permanent Defense (PD) Aircraft Hangers Industrial Buildings and sheds - Low Cost Row Housing / Re-habilitation Colony. Prefab technology involves use of factory-manufactured components in buildings. In large construction projects, various modules of the structure are cast off-site in factories and then assembled on the site. In the process, prefab materials such as wall and terrace blocks, wall panels, steel frames and plaster boards are used along with innovations such as the dry-wall technique. Pre-engineered building is very easy and quick to build. They can be easily constructed even in the area with space constraints as assembling of various building components do not require much space. As pre-engineered metal building is made up of metal, it is corrosion resistant, has good solidity and longer durability and compared to standard buildings. They are planned, designed and almost pre-built at the factory itself. The building components just have to be assembled once they are transported to the desired location. They are pre-drilled, pre-cut and pre- welded and just need to be bolted together. This can often be done quickly and with a minimum of professional assistance. Pre engineered steel buildings provide the planner to have innovative designs and have them successfully implemented as they can be constructed at places which have space constraints because they use assembling process for construction. Pre-fabricated metal buildings have become a popular alternative to conventional buildings. This type of construction can be used for small storage buildings in a backyard to large industrial buildings. It also takes much less time to build these structures, compared to traditional buildings. With fewer components, the time it takes to complete a pre-engineered building is cut in half, compared to the time it takes to build a traditional structure. They require less maintenance than traditional buildings such as wood structures.
- 17. Some of the uses of Prefab structures are as given: Prefabricated Buildings Porta Cabins Security Guard Cabins Portable Toilets Labour Camps Cold Storages Portable Departmental Stores Pre Engineering Buildings Warehouse Factory This project profile is for setting up of a Puf Panel and Prefab Structure manufacturing unit with installed capacity of 7500 sq mtr and 1500 MT per annum respectively. 2.0 MARKET POTENTIAL The project is suitable in the North Eastern Region due to the growing construction sector which is yet to be properly tapped. The boost of governmental spending and increased demand for housing and construction activity continues unabated in this part of the Country. North East is one of the few markets where the public sector spending in infrastructure and housing is significant along with the real estate activity happening in the private sector. Prefab construction in this region till now had been restricted to constructing small units like project site offices, cold storages, exhibition halls, portable cabins, kiosks, workshops and warehouses. But now with the country witnessing an infrastructure boom, even flyover construction and the Metro are applying the prefab construction techniques for the simple reason that normal construction methods cannot be used due to safety issues at these sites and work can be finished faster and with ease. Some of the growth areas in the economy of the region which can lead to demand of prefabricated structures are as hereunder: The exhibition industry is in a modernization mode and growing at a rapid pace. New trade shows are being held, new exhibition centres have been constructed, and the market is opening up to foreign investors. The exhibition market witnessed significant growth in the last 15 years. Several new exhibition venues came up during this period in several cities. Education is one of the largest service sector industries characterized by a unique set of attributes. The formal education space is regulated and has a dominant share in the overall education market. Many corporate houses have / are planning to set up their own chain of pre- schools. Pre schools are viewed as attractive investment opportunities due to the growth potential. The Indian aviation industry is one of the fastest-growing aviation industries in the world with private airlines accounting for more than 75 per cent of the sector of the domestic aviation market. Over the past year investment in airport infrastructure in the region is growing. The Warehousing sector is growing at a rate of 35-40 per cent every year. The growth potential for this sector is huge with approximately significant nos of Govt initiated logistics parks are likely to come up. The residential segment leads the growth trajectory-nearly 75-80% of the total real estate space. Rapid urbanization, increase in number of households, rising income levels, and easy availability of housing finance are among the main reasons cited for this trend. Prefab structures and puf panels have their own positive aspect which is one of the major factors that is ensuring a demand for the products. Some of these are:
- 18. Reduced construction time: Buildings are typically delivered in just a few weeks after approval of drawings. Foundation and anchor bolts are cast parallel with finished, ready for the site bolting. Lower costs: Due to the systems approach, there is a significant saving in design, manufacturing and on site erection cost. The secondary members and cladding nest together reducing transportation cost. Flexibility of expansion: Buildings can be easily expanded in length by adding additional bays. Also expansion in width and height is possible by pre designing for future expansion. Large clear spans: Buildings can be supplied to around 80M clear spans. Quality control: As buildings are manufactured completely in the factory under controlled conditions the quality is assured. Low maintenance: Buildings are supplied with high quality paint systems for cladding and steel to suit ambient conditions at the site, which results in long durability and low maintenance coats. Energy efficient roofing and wall systems: Buildings can be supplied with polyurethane insulated panels or fiberglass blankets insulation to achieve required “U” values. Architectural versatility: Building can be supplied with various types of fascias, canopies, and curved eaves and are designed to receive pre cast concrete wall panels, curtain walls, block walls and other wall systems. Single source responsibility: As the complete building package is supplied by a single vendor, compatibility of all the building components and accessories is assured. This is one of the major benefits of the pre engineered building systemss like meat, fish, milk, etc. 3.0 MANUFACTURING PROCESS (i) PUF Panel: Foods Puf Panels are produced by the standard production process as per the set standard conforming to the requirement of the industry. The metal sheet is first profiled as per requirement of roof or wall or as per customer specification. Then the profiled sheet is cut to size in length and breadth with side 10 mm bent. The bed of the press is made ready for the given length and breadth and of desired thickness using spacer. After that the profiled sheets are kept in place in the adjusted area of the press platform that travels inside the press on either side along with the cam lock at cam stations. The platform is rolled in and the press is raised to close. There is small orifice at the length side of press through which polyurethane liquid is injected as per set programme. In both the panel of upper and lower the panel head in press for appx 20 mins and then moved out and removed from the platform so that new set of profiled sheets are put along with cam locks. On removing from the press the panels are put on even surface and allowed to cool and ready for shipment. This process will go on and can be varied in sizes for length, width or the thickness. (ii) Prefab Structure: The PFB production process primarily consists of FOUR major parallel processing lines, as under: Built-up members for Primary frame Cold forming for Secondary framing Profiling for Roof and Wall sheeting Accessories & Bracings like Gutters, down take pipes, ridge Vents, Skylights, clips etc. The production & shipment of these components for a PFB structure uses following processes: Plate cutting using Shear/Plasma/Multi-torch for optimized use of plate area. H-beam welding on automatic welding machines using SAW or MIG welding process Fabrication for fitments like end plates, stiffeners and connections cleats. Cleaning the surface for painting Slitting HR coils for cold forming operations to make Z and C sections with punching Cutting and threading sag rods and bracing rods Fabrication of Diagonal bracing angles or pipes
- 19. Profiling the Galvalume/Zincalume sheets for roofing and wall cladding Manufacturing Gutters, down take pipes in press bend Procuring and assigning required matching fasteners for connections Organizing some bought out accessories Quality control tests & inspection; and matching with project wise Bill of Quantities as given by the engineering department. Dispatching to project sites as per sequence of erection. 4.0 COST OF THE PROJECT The estimated project cost is given below: (Rs. in lacs) Particulars Amount (Rs) Land & Site Development 0.00 Building & Civil Works 20.30 Plant & Machinery 292.05 Misc. Fixed Assets 26.28 Preliminary & Pre-operative Expenses 14.39 Contingencies & Escalation @ 3% 10.16 Working Capital Margin 73.17 TOTAL 436.34 4.1 Land & Site Development: No cost has been considered for land & site development. It is assumed that the [roject will be set up in existingland. 4.2 Building & Civil Works: Details of building & civil works are given below. Particulars Area (Sqm) Rate (Rs) Amount (Rs) Factory building (Open shed with CGI sheet roof, concrete floor) 400 3500 1400000 Store (Brick wall, CGI sheet roof, concrete floor) 40 6000 240000 Labor querters 30 3500 105000 Weigh bridge platform LS LS 100000 Sub total 1845000 Add: Electrification, sanitation, etc @ 10% 184500 TOTAL 2029500 Say (Rs. in lacs) 20.30 4.3 Plant & Machinery: Details of plant & machinery are given below. Particulars Qty Rate (Rs) Amount (Rs) Double head decoiler 1 1900000 1900000 Cut to length machine 1 3900000 3900000 Ribbing profile machine 1 2500000 2500000 Compressor 1 180000 180000 Air drier 1 70000 70000 Carriage system 1 1230000 1230000 Hydraulic panel 1 4870000 4870000 Polyurethane Foaming machine 1 4830000 4830000 Welding machine 20 65000 1300000 Gas cutting set 3 26000 78000 Drill machine (big) 2 110000 220000 Drill machine (small) 2 92000 184000 Pipe cutting machine 6 14500 87000 Grinding machine (big) 6 17600 105600
- 20. Grinding machine (medium) 4 13900 55600 Grinding machine (small) 2 8400 16800 Sheet rolling machine 1 1710000 1710000 aluminium profile cutter 1 275000 275000 Hand drill 2 5600 11200 Magnetic drill 6 57000 342000 Hand held sheet cutting machine 2 6500 13000 Angle cutting machine 1 872500 872500 Thread cuttingmachine 1 645000 645000 Sub total 25395700 Add: Installation, transporation, taxes, etc @ 15% 3809355 TOTAL 29205055 Say (Rs. in lacs) 292.05 4.4 Misc. Fixed assets: Details of miscellaneous fixed assets are given below. Particulars Qty Rate (Rs) Amount (Rs) Installation of Transformer 1 1000000 1000000 250 kva DG set 1 889000 889000 Fire fighting equipments LS LS 100000 Workshop equipments LS LS 200000 Laboratory equipments LS LS 100000 Furniture & fixtures LS LS 50000 Miscellaneous items LS LS 50000 Sub total 2389000 Add: Installation, transporation, etc @ 10% 238900 TOTAL 2627900 Say (Rs. in lacs) 26.28 4.5 Preliminary & pre-operative expenses: Details of preliminary & pre-operative expenses are given below. (Rs. In lacs) Particulars Amount (Rs) Travelling expenses 1.00 Professional & other fees 1.00 Interest during implementation 11.89 Miscellaneous expenses 0.50 TOTAL 14.39 4.6 Contingencies & escalation: Contingencies & escalation has been assumed at 3% of the cost of land & site develepment, building & civil works, plant & machinery and miscellaneous fixed assets. 4.7 Working capital: Details of working capital are given below. (Rs. in lacs) Period (Days) Total Current Assets Year 1 Year 2 Year 3 Raw Materials 30 66.54 83.17 99.81 Power & fuel 30 0.60 0.75 0.90 Salary 30 3.55 3.57 3.59 Finished Goods/ in process 30 72.17 89.29 106.40 Receivables 15 40.07 50.09 60.10 Total 182.93 226.86 270.80
- 21. Working Capital Margin in Year 1 (40%) 73.17 5.0 MEANS OF FINANCE The means of finance for the project is estimated as below. (Rs. in lacs) Particulars Percent Amount EQUITY A. Equity from Promoters 40% 174.54 B. Subsidy from Central/ State Govt. - DEBT Term Loan from Banks/ FIs 60% 261.81 TOTAL 100% 436.34 6.0 PROFITABILITY STATEMENT (Rs. in lacs) Particulars Yr 1 Yr 2 Yr 3 Yr 4 Yr 5 Yr 6 Yr 7 A. INCOME Capacity utilisation 40% 50% 60% 60% 60% 60% 60% Income from sales/ annum 975.00 1218.75 1462.50 1462.50 1462.50 1462.50 1462.50 B. OPERATING EXPENSES Raw Materials 809.55 1011.94 1214.33 1214.33 1214.33 1214.33 1214.33 Power & Fuel 7.30 9.12 10.94 10.94 10.94 10.94 10.94 Salary 43.20 43.42 43.63 43.85 44.07 44.29 44.51 Repair & Maintenance 3.39 3.56 3.73 3.92 4.12 4.32 4.54 Selling Expenses 9.75 12.19 14.63 14.63 14.63 14.63 14.63 Miscellaneous Expenses 4.88 6.09 7.31 7.31 7.31 7.31 7.31 Total Operating Expenses 878.06 1086.31 1294.57 1294.98 1295.39 1295.82 1296.26 Less working expenses capitalised 73.17 0.00 0.00 0.00 0.00 0.00 0.00 Operating profit 170.11 132.44 167.93 167.52 167.11 166.68 166.24 C. FINANCIAL EXPENSES Depreciation 17.76 17.76 17.76 17.76 17.76 17.76 17.76 Interest on Term Loan 35.34 32.64 26.75 20.86 14.97 9.08 3.19 Interest on WC Loan 17.56 21.78 26.00 26.00 26.00 26.00 26.00 Net Profit 99.45 60.26 97.42 102.90 108.38 113.84 119.29 Net cash accruels 117.21 78.02 115.18 120.66 126.14 131.60 137.06 Principal Repayment 0.00 43.63 43.63 43.63 43.63 43.63 43.63 6.1 Income from Sales: Income from sales at installed capacity is estimated as below. Product Unit Installed Capacity (MT) Sale price (Rs/ unit) Amount (Rs) Puf panel Sqm 75000 1750 131250000 Prefab structure kg 1500000 75 112500000 Income from sales at installed capacity (Rs) 243750000 6.2 Raw Materials: Expenses on raw materials at installed capacity is estimated as below. Particulars Unit Qty required/ unit Rate (Rs) Amount (Rs) Puf panel Polyol litres 1.09 210 229 ISO litres 1.31 210 275
- 22. PPGI sqm 2.00 430 860 Clamp lock sqm 1.67 80 134 Expenses on raw materials per unit Puf panel (Rs) 1498 Add: Scaling loss @ 5% 75 Expenses on raw materials at installed capacity for Puf panel 117936000 Pre fab structures Pipe kg 0.88 54 48 Flat kg 0.07 50 4 Plate kg 0.05 52 3 Expenses on raw materials per unit Pre fab structures (Rs) 54 Add: Scaling loss @ 5% 3 Expenses on raw materials at installed capacity for Pre fab structures 84451500 Expenses on raw materials at installed capacity (Rs) 202387500 6.3 Power & Fuel: Expenses on power & fuel at installed capacity is estimated as below. A. Expenses on power Connected load 250 Avg load factor 70% Proportion running on power 80% Hrs/ day 8 Days/ annum 300 Annual power consumption 336000 Rate (Rs/ unit) 5 Expenses on power per annum at 100% capacity (Rs) 1680000 B: Estimate of Diesel Proportion running on fuel (diesel) 20% Hrs/ annum 480 Diesel consumption (litres/ hr) 6 Diesel Price per litre 50 Expenses on diesel per annum at 100% capacity (Rs) 144000 Expenses on power & fuel at 100% capacity (Rs) 1824000 6.4 Salary: Expenses on salary in the 1st year is estimated as given below. It is assumed that salary expenses will increase @ 0.5% every subsequent year. Particulars of Employee Numbers Salary/ Month (Rs) Cost/ annum (Rs) Manager 1 50000 600000 Supervisors 3 30000 1080000 Accounts Officer 1 25000 300000 Technicians/ machine operators 10 12000 1440000 Sales staff 3 5000 180000 Unskilled workers/ helpers 15 4000 720000 Expenses on salary in the 1st year (Rs) 4320000 6.5 Repair & Maintenance: Expenses on repair & maintenance in the 1st year is estimated as given below. It is assumed that expenses on repair & maintenance will increase @ 5% every subsequent year. (Rs. in lacs) Particulars Cost (Rs) Rate Amount (Rs) Building & Civil Works 20.30 1% 0.20 Plant & Machinery 292.05 1% 2.92 Misc. Fixed Assets 26.28 1% 0.26
- 23. Expenses on repair & maintenance in year 1 3.39 6.6 Selling Expenses: Selling expenses have been assumed at 1% of sales. 6.7 Miscellaneous Expenses: Miscellaneous expenses have been assumed at 0.5% of sales. 6.8 Depreciation: Depreciation has been calculated by straight line method. The details of calculation are given below. (Rs in lacs) Description Cost (Rs) Rate Amount/ annum (Rs) Building & Civil Works 20.30 3.34% 0.68 Plant & Machinery 292.05 5.28% 15.42 Misc. Fixed Assets 26.28 6.33% 1.66 TOTAL 17.76 6.9 Interest on Term Loan & Principal Repayment: Interest rate has been assumed at 13.5%. Duration of Loan repayment has been considered for a period of 7 years including moratarium period of 1 year with equal monthly installments. The details of calculation are given below. (Rs in lakh) Month Year 1 2 3 4 5 6 7 Month 1 Opening balance 261.81 261.81 218.17 174.54 130.90 87.27 43.63 Repayment 0.00 3.64 3.64 3.64 3.64 3.64 3.64 Interest (13.5%) 2.95 2.95 2.45 1.96 1.47 0.98 0.49 Closing balance 261.81 258.17 214.54 170.90 127.27 83.63 40.00 Month 2 Opening balance 261.81 258.17 214.54 170.90 127.27 83.63 40.00 Repayment 0.00 3.64 3.64 3.64 3.64 3.64 3.64 Interest 2.95 2.90 2.41 1.92 1.43 0.94 0.45 Closing balance 261.81 254.53 210.90 167.26 123.63 80.00 36.36 Month 3 Opening balance 261.81 254.53 210.90 167.26 123.63 80.00 36.36 Repayment 0.00 3.64 3.64 3.64 3.64 3.64 3.64 Interest 2.95 2.86 2.37 1.88 1.39 0.90 0.41 Closing balance 261.81 250.90 207.26 163.63 119.99 76.36 32.73 Month 4 Opening balance 261.81 250.90 207.26 163.63 119.99 76.36 32.73 Repayment 0.00 3.64 3.64 3.64 3.64 3.64 3.64 Interest 2.95 2.82 2.33 1.84 1.35 0.86 0.37 Closing balance 261.81 247.26 203.63 159.99 116.36 72.72 29.09 Month 5 Opening balance 261.81 247.26 203.63 159.99 116.36 72.72 29.09 Repayment 0.00 3.64 3.64 3.64 3.64 3.64 3.64 Interest 2.95 2.78 2.29 1.80 1.31 0.82 0.33 Closing balance 261.81 243.62 199.99 156.36 112.72 69.09 25.45 Month 6 Opening balance 261.81 243.62 199.99 156.36 112.72 69.09 25.45 Repayment 0.00 3.64 3.64 3.64 3.64 3.64 3.64 Interest 2.95 2.74 2.25 1.76 1.27 0.78 0.29 Closing balance 261.81 239.99 196.35 152.72 109.09 65.45 21.82 Month 7 Opening balance 261.81 239.99 196.35 152.72 109.09 65.45 21.82 Repayment 0.00 3.64 3.64 3.64 3.64 3.64 3.64 Interest 2.95 2.70 2.21 1.72 1.23 0.74 0.25 Closing balance 261.81 236.35 192.72 149.08 105.45 61.82 18.18 Month 8 Opening balance 261.81 236.35 192.72 149.08 105.45 61.82 18.18 Repayment 0.00 3.64 3.64 3.64 3.64 3.64 3.64 Interest 2.95 2.66 2.17 1.68 1.19 0.70 0.20 Closing balance 261.81 232.72 189.08 145.45 101.81 58.18 14.54 Month 9 Opening balance 261.81 232.72 189.08 145.45 101.81 58.18 14.54
- 24. Repayment 0.00 3.64 3.64 3.64 3.64 3.64 3.64 Interest 2.95 2.62 2.13 1.64 1.15 0.65 0.16 Closing balance 261.81 229.08 185.45 141.81 98.18 54.54 10.91 Month 10 Opening balance 261.81 229.08 185.45 141.81 98.18 54.54 10.91 Repayment 0.00 3.64 3.64 3.64 3.64 3.64 3.64 Interest 2.95 2.58 2.09 1.60 1.10 0.61 0.12 Closing balance 261.81 225.44 181.81 138.18 94.54 50.91 7.27 Month 11 Opening balance 261.81 225.44 181.81 138.18 94.54 50.91 7.27 Repayment 0.00 3.64 3.64 3.64 3.64 3.64 3.64 Interest 2.95 2.54 2.05 1.55 1.06 0.57 0.08 Closing balance 261.81 221.81 178.17 134.54 90.90 47.27 3.64 Month 12 Opening balance 261.81 221.81 178.17 134.54 90.90 47.27 3.64 Repayment 0.00 3.64 3.64 3.64 3.64 3.64 3.64 Interest 2.95 2.50 2.00 1.51 1.02 0.53 0.04 Closing balance 261.81 218.17 174.54 130.90 87.27 43.63 0.00 Principal Repayment 0.00 43.63 43.63 43.63 43.63 43.63 43.63 Interest 35.34 32.64 26.75 20.86 14.97 9.08 3.19 6.10 Interest on Working Capital Loan: Interest rate on working capital loan has been assumed at 16%. Details of calculation are given below. (Rs. in lacs) Particulars Year 1 Year 2 Year 3 Total current assets 182.93 226.86 270.80 Bank Loan (60%) 109.76 136.12 162.48 Interest @ 16% 17.56 21.78 26.00 7.0 DEBT SERVICE COVERAGE RATIO (DSCR) (Rs. in lacs) Year 1 2 3 4 5 6 7 TOTAL Net Profit 99.45 60.26 97.42 102.90 108.38 113.84 119.29 Depreciation 17.76 17.76 17.76 17.76 17.76 17.76 17.76 Interest 35.34 32.64 26.75 20.86 14.97 9.08 3.19 Total 152.55 110.66 141.93 141.53 141.11 140.68 140.25 968.71 Interest 35.34 32.64 26.75 20.86 14.97 9.08 3.19 Loan repayment 0.00 43.63 43.63 43.63 43.63 43.63 43.63 Total 35.34 76.28 70.39 64.50 58.61 52.72 46.82 404.65 DSCR 4.32 1.45 2.02 2.19 2.41 2.67 3.00 Average DSCR = 2.39 8.0 BREAK EVEN POINT (BEP) (Rs. in lacs) Year 1 2 3 A. Net sales (Rs. lakh) 975.00 1218.75 1462.50 B. Variable cost Raw Materials 809.55 1011.94 1214.33 Power & Fuel 7.30 9.12 10.94 Selling Expenses 9.75 12.19 14.63 Miscellaneous Expenses 4.88 6.09 7.31 Interest on Working Capital Loan 17.56 21.78 26.00 Total variable cost 849.03 1061.12 1273.20
- 25. C. Contribution (A-B) 125.97 157.63 189.30 D. Fixed & Semi-fixed Costs Salary 43.20 43.42 43.63 Repair & maintenance 3.39 3.56 3.73 Interest on Term Loan 35.34 32.64 26.75 Depreciation 17.76 17.76 17.76 Total fixed cost 99.69 97.38 91.88 E. BREAKEVEN POINT 79.14% 61.77% 48.54% F. BEP at operating capacity 31.66% 30.89% 29.12% G. Cash BEP 26.02% 25.25% 23.49% 9.0 INTERNAL RATE OF RETURN (IRR) (Rs. in lacs) Year 0 1 2 3 4 5 6 7 CASH OUTFLOW Capital Expenditure 338.62 0.00 0.00 0.00 0.00 0.00 0.00 0.00 Working Capital 0.00 182.93 43.94 43.94 0.00 0.00 0.00 0.00 Total (A) 338.62 182.93 43.94 43.94 0.00 0.00 0.00 0.00 CASH INFLOW Profit After Tax 99.45 60.26 97.42 102.90 108.38 113.84 119.29 Add: Depreciation 17.76 17.76 17.76 17.76 17.76 17.76 17.76 Add: Interest 35.34 32.64 26.75 20.86 14.97 9.08 3.19 Add: Salvage Value Total (B) 0.00 152.55 110.66 141.93 141.53 141.11 140.68 140.25 NET FLOW (B-A) -338.62 -30.37 66.72 97.99 141.53 141.11 140.68 140.25 IRR = 16%
- 26. 1.0 INTRODUCTION Throughout the centuries, a plethora of cultural and social taboos has been associated with menstruating girls and women, as well as menstrual health. In many parts of the world, women are still not allowed to leave the confines of their homes while menstruating. Deemed “impure” and “unclean,” they are not allowed to venture freely outside their homes. Thus, girls and women are deprived of opportunities in schools, workplaces, and social settings. In addition, this lack of control over their lives puts women at loss when it comes to gaining information on cost-effective, affordable menstrual health products. Such women often resort to horrific means such as repeatedly using the same unsterilized cloth during menstruation instead of sanitary napkins. Due to these unhygienic preventative methods, women are prey to a host of illnesses and fatalities. For example, out of every 10,000 women in India, 2000 women die during childbirth due to unhygienic menstrual practices. Although, there is a well-developed sanitary napkin industry in India, with major players such as Proctor & Gamble and Johnsons & Johnsons, these sanitary napkins are often unaffordable to the millions of Indian women living in low-income and under-privileged communities. This is primarily due to the cost of the sanitary napkins resulting from the use of expensive machinery and huge profit margins by these brand name companies. According to a study report undertaken by AC Nielsen, only 12% of India's 355 million menstruating women use sanitary napkins. The biggest barrier to using a sanitary napkin is affordability. Around 70% of women in India say their family cannot afford to buy them. This project profile is for setting up of sanitary napkin manufacturing unit with a cost-effective machine that can produce and market biodegradable sanitary napkins locally. This semi-automatic and portable machine can be accommodated in a small space of about 12 sqm. It works on single- phase electricity and has a production capacity of 2 napkins per minute. The machine incorporates pinewood fiber, a raw material, which goes through a 3 step process: (a) defibration, (b) core formation and then (c) sealing with soft touch sensitive heat control. This last step ensures the final shape of the napkins. The installed capacity of the unit is 11.52 lacs napkins per annum by using 4 machinery sets with 300 working days and 8 working hours. 2.0 MARKET POTENTIAL According to market research agency Nielsen, India's sanitary napkin market is largely untapped and is growing at a rate of 24% annually, and usage is close to 20% of potential customers. Most large brands such as 'Whisper' from P&G and 'Stayfree' from J&J have a strong presence in urban areas, leaving the field open for the entry of new players with low-cost solutions targeting semi-urban and rural areas. 3.0 MANUFACTURING PROCESS De fibration of wood pulp is done on the defibration machine. The de fibred wood pulp is measured on a weighing scale and the wood pulp is filled on a core block and pressed by core forming machine. After this, pressed cores are wrapped by non – woven fabric and sealed using napkin finishing machine (sealing machine). Then position sticker is pasted on the napkin and then packed. 4.0 COST OF THE PROJECT The estimated project cost is given below. (Rs. in lacs) Particulars Amount Land and Site Development - Building & Civil Works 4.42 Machinery & Equipments 3.35 Misc. Fixed Assets 0.30 Preliminary & Pre-operative Expenses 0.33
- 27. Contingencies & Escalation @ 3% 0.24 Working Capital 1.55 TOTAL 10.19 4.1 Land & Site Development: No cost has been considered for land & site development. It is assumed that the unit will be set up in own land. 4.2 Building & Civil Works: Details of building & civil works are given below. Particulars Area (Sqm) Rate (Rs) Amount (Rs) Work Shed (Brick wall, CGI sheet roof, concrete floor) 40 6000 267600 Store room (Brick wall, CGI sheet roof, concrete floor) 25 6000 133800 Sub total 401400 Add: Electrification, etc @ 10% 40140 TOTAL 441540 Say (Rs. in lacs) 4.42 4.3 Machinery & Equipments: Details of machinery & equipments are given below. Particulars Qty Rate (Rs) Amount (Rs) Defibering M/c 4 20200 80800 Soft touch sealing Machine 4 28000 112000 Core forming M/c 4 5500 22000 Core dies 20 625 12500 Ultra Violet Treatment Unit 4 10400 41600 Miscellaneous items LS LS 10000 Sub total 278900 Add: Transporation, installation, training, taxes, etc @ 20% 55780 TOTAL 334680 Say (Rs. in lacs) 3.35 4.4 Misc. Fixed Assets: Details of miscellaneous fixed assets are given below. Particulars Qty Rate (Rs) Amount (Rs) Furniture & fixtures LS LS 20000 Miscellaneous items LS LS 10000 TOTAL 30000 Say (Rs. in lacs) 0.30 4.5 Preliminary & Pre-operative expenses: Details of preliminary & pre-operative expenses are given below. (Rs. In lacs) Particulars Amount (Rs) Traveling expenses 0.20 Proffessional & other fees 0.10 Interest during implementation 0.23 Miscellaneous expenses 0.10 TOTAL 0.33 4.6 Contingencies & Escalation: Contingencies & escalation has been assumed at 3% of the building & civil works, machinery & equipments and miscellaneous fixed assets. 4.7 Working capital: Details of working capital are given below.
- 28. (Rs. In lacs) Period (Days) Amount (Rs) Yr 1 Yr 2 Yr 3 Raw materials & consumables 30 0.72 0.86 1.00 Power 30 0.01 0.01 0.01 Salary 30 0.24 0.24 0.24 Finished Goods 15 0.39 0.44 0.50 Receivables 7 0.21 0.25 0.29 Total 1.55 1.80 2.04 Working capital margin in Yr 1 (100%) 1.55 5.0 MEANS OF FINANCE The means of finance for the project is estimated as below. (Rs. in lacs) Particulars Percent Amount EQUITY A. Equity from Promoters 40% 4.07 B. Subsidy from Central/ State Govt. - DEBT Term Loan from Banks/ FIs 60% 6.11 TOTAL 100% 10.19 6.0 PROFITABILITY STATEMENT (Rs. in lacs) Particulars Yr 1 Yr 2 Yr 3 Yr 4 Yr 5 A. INCOME Production capacity (No. of packets/ annum) 144000 144000 144000 144000 144000 Capacity utilisation 50% 60% 70% 70% 70% Production/ annum at capacity utilisation 72000 86400 100800 100800 100800 Price (Rs/ packet) 15 15 15 15 15 Total income/ annum 10.80 12.96 15.12 15.12 15.12 B. OPERATING EXPENSES Raw Materials & Consumables 6.33 7.60 8.86 8.86 8.86 Power 0.07 0.08 0.09 0.09 0.09 Salary 2.88 2.89 2.91 2.92 2.94 Repair & Maintenance 0.08 0.09 0.10 0.11 0.12 Miscellaneous Expenses 0.11 0.13 0.15 0.15 0.15 Total Operating Expenses 9.46 10.79 12.11 12.13 12.16 Less: working expenses capitalised 1.55 0.00 0.00 0.00 0.00 Operating profit 2.89 2.17 3.01 2.99 2.96 C. FINANCIAL EXPENSES Depreciation 0.40 0.40 0.40 0.40 0.40 Interest on Term Loan 0.49 0.41 0.29 0.18 0.06 Net Profit 2.00 1.36 2.31 2.40 2.49 Net cash accruels 2.40 1.77 2.72 2.81 2.90 Principal Repayment 0.36 1.44 1.44 1.44 1.44 6.1 Production capacity: Total production of sanitary napkin packets at installed capacity is estimated as below.
- 29. Rated machine capacity (No. of napkins/ minute) 2 Working hrs/ day 8 No. of machines 4 Days/ annum 300 Total production 1152000 No. of napkins per packet 8 Total packets at installed capacity 144000 6.2 Raw material & Consumables: Expenses on raw material and consumables at installed capacity is estimated as below. Particulars Unit Rate/ napkin Quantity required Price (Rs/ unit) Amount (Rs) Wood Pulp kg 0.010 11600 55.00 638000 Top Layer metre 0.153 176000 2.00 352000 Back Layer grams 0.243 280000 0.20 56000 Release Paper sheets 0.010 12000 2.00 24000 Gum kg 0.001 800 110.00 88000 Packing Covers nos 0.125 144000 0.75 108000 Expenses on raw materials & consumables at installed capacity (Rs) 1266000 6.3 Power: Expenses on power at installed capacity is estimated as below. Particulars Quantity Power (Kw) Total (Kw) General Lighting 7 0.10 0.67 Machinery 16 0.50 8.00 Total power requirement/ day (Kw) 8.67 No. of days/ annum 300 Rate per unit (Rs) 5.00 Expenses on power per annum at installed capacity (Rs) 13004 6.4 Salary: Expenses on salary in the 1st year is estimated as given below. It is assumed that salary expenses will increase @ 0.5% every subsequent year. Particulars of Employee Numbers Salary/ Month (Rs) Cost/ annum (Rs) Manager (Self) 0 0 0 Machine operators/ helpers 12 2000 288000 Expenses on salary in the 1st year (Rs) 288000 6.5 Repair & Maintenance: Expenses on repair & maintenance in the 1st year is estimated as given below. It is assumed that expenses on repair & maintenance will increase @ 10% every subsequent year. (Rs. in lacs) Particulars Cost (Rs) Rate Amount Building & Civil Works 4.42 1% 0.04 Machinery & Equipments 3.35 1% 0.03 Misc. Fixed Assets 0.30 1% 0.00 Expenses on repair & maintenance in the 1st year (Rs) 0.08 6.6 Miscellaneous Expenses: Miscellaneous expenses have been assumed at 1% of sales. 6.7 Depreciation: Depreciation has been calculated by straight line method. The details of calculation are given below. (Rs in lacs) Description Cost (Rs) Rate Amount/ annum (Rs)
- 30. Building & Civil Works 4.42 3.34% 0.15 Machinery & Equipments 3.35 7.07% 0.24 Misc. Fixed Assets 0.30 6.23% 0.02 TOTAL 0.40 6.8 Interest on term loan & principal repayment: Interest rate has been assumed at 8%. Duration of Loan repayment has been considered for a period of 5 years including moratarium period of 9 months with equal monthly installments. The details of calculation are given below. (Rs in lakh) Month Year 1 2 3 4 5 Month 1 Opening balance 6.11 5.75 4.31 2.88 1.44 Repayment 0.00 0.12 0.12 0.12 0.12 Interest (8%) 0.04 0.04 0.03 0.02 0.01 Closing balance 6.11 5.63 4.19 2.76 1.32 Month 2 Opening balance 6.11 5.63 4.19 2.76 1.32 Repayment 0.00 0.12 0.12 0.12 0.12 Interest 0.04 0.04 0.03 0.02 0.01 Closing balance 6.11 5.51 4.07 2.64 1.20 Month 3 Opening balance 6.11 5.51 4.07 2.64 1.20 Repayment 0.00 0.12 0.12 0.12 0.12 Interest 0.04 0.04 0.03 0.02 0.01 Closing balance 6.11 5.39 3.96 2.52 1.08 Month 4 Opening balance 6.11 5.39 3.96 2.52 1.08 Repayment 0.00 0.12 0.12 0.12 0.12 Interest 0.04 0.04 0.03 0.02 0.01 Closing balance 6.11 5.27 3.84 2.40 0.96 Month 5 Opening balance 6.11 5.27 3.84 2.40 0.96 Repayment 0.00 0.12 0.12 0.12 0.12 Interest 0.04 0.04 0.03 0.02 0.01 Closing balance 6.11 5.15 3.72 2.28 0.84 Month 6 Opening balance 6.11 5.15 3.72 2.28 0.84 Repayment 0.00 0.12 0.12 0.12 0.12 Interest 0.04 0.03 0.02 0.02 0.01 Closing balance 6.11 5.03 3.60 2.16 0.72 Month 7 Opening balance 6.11 5.03 3.60 2.16 0.72 Repayment 0.00 0.12 0.12 0.12 0.12 Interest 0.04 0.03 0.02 0.01 0.00 Closing balance 6.11 4.91 3.48 2.04 0.60 Month 8 Opening balance 6.11 4.91 3.48 2.04 0.60 Repayment 0.00 0.12 0.12 0.12 0.12 Interest 0.04 0.03 0.02 0.01 0.00 Closing balance 6.11 4.79 3.36 1.92 0.48 Month 9 Opening balance 6.11 4.79 3.36 1.92 0.48 Repayment 0.00 0.12 0.12 0.12 0.12 Interest 0.04 0.03 0.02 0.01 0.00 Closing balance 6.11 4.67 3.24 1.80 0.36 Month 10 Opening balance 6.11 4.67 3.24 1.80 0.36 Repayment 0.12 0.12 0.12 0.12 0.12 Interest 0.04 0.03 0.02 0.01 0.00 Closing balance 5.99 4.55 3.12 1.68 0.24 Month 11 Opening balance 5.99 4.55 3.12 1.68 0.24 Repayment 0.12 0.12 0.12 0.12 0.12 Interest 0.04 0.03 0.02 0.01 0.00
- 31. Closing balance 5.87 4.43 3.00 1.56 0.12 Month 12 Opening balance 5.87 4.43 3.00 1.56 0.12 Repayment 0.12 0.12 0.12 0.12 0.12 Interest 0.04 0.03 0.02 0.01 0.00 Closing balance 5.75 4.31 2.88 1.44 0.00 Principal Repayment 0.36 1.44 1.44 1.44 1.44 Interest 0.49 0.41 0.29 0.18 0.06 7.0 DEBT SERVICE COVERAGE RATIO (DSCR) (Rs. in lacs) Year 1 2 3 4 5 TOTAL Profit After Tax (Net Profit) 2.00 1.36 2.31 2.40 2.49 Depreciation 0.40 0.40 0.40 0.40 0.40 Interest 0.49 0.41 0.29 0.18 0.06 Total 2.89 2.17 3.01 2.99 2.96 14.02 Interest 0.49 0.41 0.29 0.18 0.06 Loan repayment 0.36 1.44 1.44 1.44 1.44 Total 0.85 1.85 1.73 1.62 1.50 7.54 DSCR 3.42 1.18 1.74 1.85 1.97 Average DSCR = 1.86 8.0 BREAK EVEN POINT (BEP) (Rs. in lacs) Year 1 2 3 A. Net sales (Rs. lakh) 10.80 12.96 15.12 B. Variable cost Raw materials & consumables 6.33 7.60 8.86 Power 0.07 0.08 0.09 Miscellaneous expenses 0.11 0.13 0.15 Total variable cost 6.50 7.80 9.10 C. Contribution (A-B) 4.30 5.16 6.02 D. Fixed & Semi-fixed Costs Salary 2.88 2.89 2.91 Repair & maintenance 0.08 0.09 0.10 Interest on Term Loan 0.49 0.41 0.29 Depreciation 0.40 0.40 0.40 Total fixed cost 3.85 3.79 3.70 E. BREAKEVEN POINT 89.60% 73.57% 61.54% F. BEP at operating capacity 44.80% 44.14% 43.08% G. Cash BEP 40.11% 39.45% 38.39% 9.0 INTERNAL RATE OF RETURN (IRR) (Rs. in lacs) Year 0 1 2 3 4 5 CASH OUTFLOW Capital Expenditure 8.31 0.00 0.00 0.00 0.00 0.00 Working Capital 0.00 1.55 0.24 0.24 0.00 0.00 Total (A) 8.31 1.55 0.24 0.00 0.00 0.00
- 32. CASH INFLOW Profit After Tax 2.00 1.36 2.31 2.40 2.49 Add: Depreciation 0.40 0.40 0.40 0.40 0.40 Add: Interest 0.49 0.41 0.29 0.18 0.06 Add: Salvage Value (10%) 0.83 Total (B) 0.00 2.89 2.17 3.01 2.99 3.79 NET FLOW (B-A) -8.31 1.34 1.93 3.01 2.99 3.79 IRR = 15%
- 33. 1.0 INTRODUCTION Disposable paper plates are made out of special quality paper reinforced with polythene sheets to make it leak proof. These products are conveniently used for serving eatables during parties, functions, workshops, etc. Most of the sweet shops use it for serving their customers. These are a convenient replacement for crockery and utensils. These have many advantages over conventional crockery/ steel utensils. Whereas conventional utensils need care in handling, have to be cleaned before and after use need lot of space for storage and are difficult to handle, these products are light in weight, are disposable after use, cheaper and can be stored easily. This project profile is for production of disposable paper plates with installed capacity of 96 lacs plates per annum, based on 300 working days per annum and 8 working hours per day. 2.0 MARKET POTENTIAL These products have an urban as well as rural market. These products are mostly used during social functions, religious gatherings, parties, marriages, outings, in sweet shops, by caterers etc. The products have many advantages and are hence preferred as compared to standard utensils/ crockery for serving eatables. They can easily be disposed off after use and hence save a lot of labour as far as cleaning/ drying of utensils are concerned. These are easily transportable and easy to handle. In our country, people are religious and organize functions throughout the year. All such occasions call for social gathering and celebrations with meals, snacks sweets being served. Further, our vast population organizes marriages, celebrates birthdays and other family functions on a regular basis. Sweet shops and small eateries can be found at every street corner and all such joints use these disposable plates and bowls. Thus keeping in view the culture of the people and the habits there is a vast market for the products not only in urban areas but also in rural areas. 3.0 MANUFACTURING PROCESS The process of manufacturing is not complicated. The product is manufactured using the specific die. The paper and the polythene sheets are previously cut to size or can also be purchased as per the production requirement. The specific die is mounted on the press and the die is heated to the desired temperature. The two layers of paper and the polythene sheets are placed in between the male-female die parts and pressure is applied so that the product takes shape. The formed product is next removed and another set is loaded. The machine is an ordinary press with one fixed platform and another moving plunger. The movement of the plunger is through hydraulic mechanism. The formed products are collected and the edges are trimmed to give it a proper shape. The plates and bowls are packed separately and stocked for dispatch. 4.0 COST OF THE PROJECT The estimated project cost is given below: (Rs. in lacs) Particulars Amount (Rs) Land & Building 1.50 Machinery & Equipments 4.27 Misc. Fixed Assets 0.40 Preliminary & Pre-operative Expenses 0.46 Contingencies & Escalation @ 3% 0.19 Working Capital 3.72 TOTAL 10.53 4.1 Land & Building: No cost has been considered for land & construction of building. It is assumed that the unit will be set up on a leased premise. Expenses for renovation works is given below.
- 34. Particulars Area (Sqm) Rate (Rs) Amount (Rs) Renovation of premise 150 1000 150000 Say (Rs. in lacs) 1.50 4.2 Machinery & Equipments: Details of machinery & equipments are given below. Particulars Quantity Rate (Rs) Amount (Rs) Automatic paper plate making machine 2 180800 361600 Miscellaneous items LS LS 10000 Sub total 371600 Add: Transporation, taxes, etc @ 15% 55740 TOTAL 427340 Say (Rs. in lacs) 4.27 4.5 Misc. Fixed Assets: Details of miscellaneous fixed assets are given below. Particulars Qty Rate (Rs) Amount (Rs) Furniture & fixtures LS LS 20000 Miscellaneous items LS LS 20000 TOTAL 40000 Say (Rs. in lacs) 0.40 4.6 Preliminary & pre-operative expenses: Details of preliminary & pre-operative expenses are given below. (Rs. In lacs) Particulars Amount (Rs) Travelling expenses 0.20 Professional & other fees 0.10 Interest during implementation 0.06 Miscellaneous expenses 0.10 TOTAL 0.46 4.6 Contingencies & Escalation: Contingencies & escalation has been assumed at 3% of the cost of renovation works, machinery & equipments and miscellaneous fixed assets. 4.7 Working Capital: Details of working capital are given below. (Rs. In lacs) Period (Days) Amount (Rs) Year 1 Year 2 Year 3 Raw materials & consumables 30 1.44 1.73 2.02 Power 30 0.03 0.03 0.04 Rent 30 0.15 0.15 0.15 Salary 30 0.19 0.19 0.19 Finished Goods 15 0.92 1.07 1.23 Receivables 15 0.99 1.18 1.38 Total 3.72 4.36 5.00 Working Capital Margin in Yr 1 (100%) 3.72 5.0 MEANS OF FINANCE The means of finance for the project is estimated as below. (Rs. in lacs) Particulars Percent Amount
- 35. EQUITY A. Equity from Promoters 40% 4.21 B. Subsidy from Central/ State Govt. - DEBT Term Loan from Banks/ FIs 60% 6.32 TOTAL 100% 10.53 6.0 PROFITABILITY STATEMENT (Rs. in lacs) Particulars Yr 1 Yr 2 Yr 3 Yr 4 Yr 5 A. INCOME Production capacity (bundles/ annum) 192000 192000 192000 192000 192000 Capacity utilisation 50% 60% 70% 70% 70% Production/ annum at capacity utilisation 96000 115200 134400 134400 134400 Price of paper plate bundle (Rs/bundle) 25 25 25 25 25 Total income/ annum 24.00 28.80 33.60 33.60 33.60 B. OPERATING EXPENSES Raw Materials & Consumables 17.58 21.09 24.61 24.61 24.61 Power 0.32 0.39 0.45 0.45 0.45 Rent 1.80 1.80 1.80 1.80 1.80 Salary 2.28 2.29 2.30 2.31 2.33 Repair & Maintenance 0.11 0.12 0.14 0.16 0.19 Selling Expenses 0.24 0.29 0.34 0.34 0.34 Miscellaneous Expenses 0.12 0.14 0.17 0.17 0.17 Total Operating Expenses 22.45 26.13 29.81 29.85 29.88 Less: working expenses capitalised 3.72 0.00 0.00 0.00 0.00 Operating profit 5.27 2.67 3.79 3.75 3.72 C. FINANCIAL EXPENSES Depreciation 0.38 0.38 0.38 0.38 0.38 Interest on Term Loan 0.50 0.42 0.30 0.18 0.06 Net Profit 4.39 1.87 3.11 3.19 3.28 Net cash accruels 4.76 2.25 3.49 3.57 3.65 Principal Repayment 0.37 1.49 1.49 1.49 1.49 6.1 Production capacity: Total production of paper plate bundles at installed capacity is estimated as below. Rated machine capacity (No. of plates/ hr) 4000 No. of machines 2 No. of hrs/ day 8 No. of days/ annum 300 Total quantity of paper plates/ annum 19200000 No. of plates/ bundle 100 Total production of bundles per annum at installed capacity 192000 6.2 Raw material & consumables: Expenses on raw material and consumables at installed capacity is estimated as below. Total quantity of paper plates 19200000 Quantity of plates/ kg 250 Total production by weight (kg) 76800 Consumption of raw materials by weight (kg) including wastage @ 2% 78336
- 36. Proportion of paper by weight (%) 99% Proportion of plastic film by weight (%) 1% Total quantity of paper at 100% capacity (kg) 77553 Total quantity of plastic film at 100% capacity (kg) 783 Price of paper (Rs/ kg) 40 Price of plastic film (Rs/ kg) 120 Expenses on paper at 100% capacity (Rs) 3102106 Expenses on plastic film 94003 Expenses on raw materials 3196109 Add: Expenses on consumables @ 10% 319611 Expenses on raw material & consumables at installed capacity (Rs) 3515720 6.3 Power: Expenses on power at installed capacity is estimated as below. Particulars Quantity Power (Kw) Total (Kw) Automatic paper plate making machine 2 2.24 4.48 General Lighting 5 0.10 0.50 Others LS LS 1.00 Total power requirement/ day (Kw) 5.98 No. of hrs/ day 8 No. of days/ annum 300 Annual power requirement (kwh) 14342 Rate per unit (Rs) 4.50 Expenses on power at installed capacity (Rs) 64541 6.4 Rent: Monthly rent for the leased premise is estimated at Rs 15,000/- per month. 6.5 Salary: Expenses on salary in the 1st year are estimated as given below. It is assumed that salary expenses will increase @ 0.5% every subsequent year. Particulars of Employee Numbers Salary/ Month (Rs) Cost/ annum (Rs) Manager (Self) 0 0 0 Technicians/ machine operators 2 5000 120000 Sales Staff 1 4000 48000 Helpers 2 2500 60000 Expenses on salary in the 1st year (Rs) 228000 6.6 Repair & Maintenance: Expenses on repair & maintenance in the 1st year is estimated as given below. It is assumed that expenses on repair & maintenance will increase @ 15% every subsequent year. (Rs. in lacs) Particulars Cost (Rs) Rate Amount (Rs) Land & Building 1.50 1% 0.02 Machinery & Equipments 4.27 2% 0.09 Misc. Fixed assets 0.40 2% 0.01 Expenses on repair & maintenance in year 1 0.11 6.7 Selling Expenses: Selling expenses have been assumed at 1% of sales. 6.8 Miscellaneous Expenses: Miscellaneous expenses have been assumed at 0.5% of sales. 6.9 Depreciation: Depreciation has been calculated by straight line method. The details of calculation are given below. (Rs in lacs)
- 37. Description Cost (Rs) Rate Amount/ annum (Rs) Land & Building 1.50 3.34% 0.05 Machinery & Equipments 4.27 7.07% 0.30 Misc. Fixed assets 0.40 6.23% 0.02 TOTAL 0.38 6.10 Interest on term loan & principal repayment: Interest rate has been assumed at 8%. Duration of Loan repayment has been considered for a period of 5 years including moratarium period of 9 months with equal monthly installments. The details of calculation are given below. (Rs in lakh) Month Year 1 2 3 4 5 Month 1 Opening balance 6.32 5.95 4.46 2.97 1.49 Repayment 0.00 0.12 0.12 0.12 0.12 Interest (8%) 0.04 0.04 0.03 0.02 0.01 Closing balance 6.32 5.82 4.34 2.85 1.36 Month 2 Opening balance 6.32 5.82 4.34 2.85 1.36 Repayment 0.00 0.12 0.12 0.12 0.12 Interest 0.04 0.04 0.03 0.02 0.01 Closing balance 6.32 5.70 4.21 2.73 1.24 Month 3 Opening balance 6.32 5.70 4.21 2.73 1.24 Repayment 0.00 0.12 0.12 0.12 0.12 Interest 0.04 0.04 0.03 0.02 0.01 Closing balance 6.32 5.58 4.09 2.60 1.12 Month 4 Opening balance 6.32 5.58 4.09 2.60 1.12 Repayment 0.00 0.12 0.12 0.12 0.12 Interest 0.04 0.04 0.03 0.02 0.01 Closing balance 6.32 5.45 3.97 2.48 0.99 Month 5 Opening balance 6.32 5.45 3.97 2.48 0.99 Repayment 0.00 0.12 0.12 0.12 0.12 Interest 0.04 0.04 0.03 0.02 0.01 Closing balance 6.32 5.33 3.84 2.35 0.87 Month 6 Opening balance 6.32 5.33 3.84 2.35 0.87 Repayment 0.00 0.12 0.12 0.12 0.12 Interest 0.04 0.04 0.03 0.02 0.01 Closing balance 6.32 5.20 3.72 2.23 0.74 Month 7 Opening balance 6.32 5.20 3.72 2.23 0.74 Repayment 0.00 0.12 0.12 0.12 0.12 Interest 0.04 0.03 0.02 0.01 0.00 Closing balance 6.32 5.08 3.59 2.11 0.62 Month 8 Opening balance 6.32 5.08 3.59 2.11 0.62 Repayment 0.00 0.12 0.12 0.12 0.12 Interest 0.04 0.03 0.02 0.01 0.00 Closing balance 6.32 4.96 3.47 1.98 0.50 Month 9 Opening balance 6.32 4.96 3.47 1.98 0.50 Repayment 0.00 0.12 0.12 0.12 0.12 Interest 0.04 0.03 0.02 0.01 0.00 Closing balance 6.32 4.83 3.35 1.86 0.37 Month 10 Opening balance 6.32 4.83 3.35 1.86 0.37 Repayment 0.12 0.12 0.12 0.12 0.12 Interest 0.04 0.03 0.02 0.01 0.00 Closing balance 6.20 4.71 3.22 1.73 0.25 Month 11 Opening balance 6.20 4.71 3.22 1.73 0.25
- 38. Repayment 0.12 0.12 0.12 0.12 0.12 Interest 0.04 0.03 0.02 0.01 0.00 Closing balance 6.07 4.58 3.10 1.61 0.12 Month 12 Opening balance 6.07 4.58 3.10 1.61 0.12 Repayment 0.12 0.12 0.12 0.12 0.12 Interest 0.04 0.03 0.02 0.01 0.00 Closing balance 5.95 4.46 2.97 1.49 0.00 Principal Repayment 0.37 1.49 1.49 1.49 1.49 Interest 0.50 0.42 0.30 0.18 0.06 7.0 DEBT SERVICE COVERAGE RATIO (DSCR) (Rs. in lacs) Year 1 2 3 4 5 Total Profit After Tax (Net Profit) 4.39 1.87 3.11 3.19 3.28 Depreciation 0.38 0.38 0.38 0.38 0.38 Interest 0.50 0.42 0.30 0.18 0.06 Total 5.27 2.67 3.79 3.75 3.72 19.20 Interest 0.50 0.42 0.30 0.18 0.06 Loan repayment 0.37 1.49 1.49 1.49 1.49 Total 0.87 1.91 1.79 1.67 1.55 7.79 DSCR 6.02 1.40 2.12 2.25 2.40 Average DSCR = 2.46 8.0 BREAK EVEN POINT (BEP) (Rs. in lacs) Year 1 2 3 A. Net sales (Rs. lakh) 24.00 28.80 33.60 B. Variable cost Raw materials & consumables 17.58 21.09 24.61 Power 0.32 0.39 0.45 Other expenses 0.12 0.14 0.17 Total variable cost 18.02 21.63 25.23 C. Contribution (A-B) 5.98 7.17 8.37 D. Fixed & Semi-fixed Costs Rent 1.80 1.80 1.80 Salary 2.28 2.29 2.30 Repair & maintenance 0.11 0.12 0.14 Interest on Term Loan 0.50 0.42 0.30 Depreciation 0.38 0.38 0.38 Total fixed cost 3.27 3.21 3.13 E. BREAKEVEN POINT 54.67% 44.80% 37.34% F. BEP at operating capacity 27.33% 26.88% 26.14% G. Cash BEP 24.18% 23.73% 22.99% 9.0 INTERNAL RATE OF RETURN (IRR) (Rs. in lacs) Year 0 1 2 3 4 5 CASH OUTFLOW Capital Expenditure 6.17 0.00 0.00 0.00 0.00 0.00
- 39. Working Capital 0.00 3.72 0.64 0.64 0.00 0.00 Total (A) 6.17 3.72 0.64 0.64 0.00 0.00 CASH INFLOW Profit After Tax 4.39 1.87 3.11 3.19 3.28 Add: Depreciation 0.38 0.38 0.38 0.38 0.38 Add: Interest 0.50 0.42 0.30 0.18 0.06 Add: Salvage Value Total (B) 0.00 5.27 2.67 3.79 3.75 3.72 NET FLOW (B-A) -6.17 1.55 2.03 3.14 3.75 3.72 IRR = 30%
- 40. 1.0 INTRODUCTION Corrugated Box is the most popular shipping container, now-a-days. The box is manufactured from corrugated board, which consists of 3 or more layers of kraft paper. The middle fluted layer is pasted with two flat parallel sheets of paper. The boxes find their number of applications in the packaging of chemicals & drugs, tobacco, engineering goods, canned & bottled goods, food products, lamps, electrical appliances, glasswares etc. Corrugated boxes have replaced wooden boxes & crates in many applications. Today, about 80% of all shipments in the world are being made in fibre board boxes. Corrugated fibre board consists of a flat layer of paper sheet (liner) glued on one or both sides of a corrugated paper (medium). The corrugated board is made by passing two layers of paper (usually kraft) through corrugating machine. One layer of paper becomes corrugated after being passed through the heated rolls and other is brought into contact with it after the former having glued at tips. The corrugating 'medium' is generally made from a 0.009" thick (9 caliper) or 0.23 mm. The glue frequently used is starch or silicate of soda adhesive. When only one liner is used, the product is known as "Single face" or "two ply" board. This board is flexible in one direction. When the corrugated medium is combined on both sides with flat sheets, it is known as double faced or "3- ply board". This project profile is for setting up of a corrugated box manufactuirng unit with single face fibreboards having installed capacity of 900 tonnes per annum, based on 300 working days per annum and 8 working hours per day. 2.0 MARKET POTENTIAL Packaging industry has witnessed a substantial turnaround in India during the past years considering the changes in the lifestyle as well as development of the economy. It is among the high growth industries and a high degree of potential exists for almost all user segments, which are expanding appreciably. Corrugated boxes market in India was estimated at ~INR 108 Billion in FY 2012. Market size of corrugated boxes has grown at a CAGR of ~12% over the period FY 2008-12. Market size of the corrugated box industry is estimated to grow at a CAGR of ~14% over the period FY 2012-15 to reach ~INR 159 Billion by FY 2014. India’s per capita consumption of corrugated boxes is just 1.5 kg while the global average is close to 15 kg and the US average 80 kg. According to a study, about 95 per cent of all products are packed in corrugated boxes in the US, an indication of the vast potential in the business. 3.0 MANUFACTURING PROCESS The process of manufacture of corrugated fibreboard & boxes comprises of two sections viz. corrugated board making and box making section. Manufacture of corrugated board: Corrugated board is made of a corrugated paper sheet of paper glued to the facings of flat-paper, usually kraft. A corrugating machine is employed for the corrugation of flat sheet and preparation of corrugated flexible 2 ply board. The machine is called as single-face corrugating machine. One layer of paper becomes corrugated after passing through the heated fluted rolls and the other is brought in contact with the former having been glued at the tips. These two sheets get pasted together and are wound in rolls. The resulting roll is known as single face or 2-ply corrugated board. By cutting this roll with board cutter machine, glueing the corrugated side on pasting machine & then placing 3rd ply of paper over it, double face or 3-ply corrugated board is produced. Similarly, board to board can be pasted to form thicker boards i.e. 5-ply, 7-ply and 9-ply boards. Manufacture of boxes: The corrugated board produced as above is dried (for drying of glue) and may now be processed further to produce-corrugated boxes. The size of a box is always given in terms of the inside dimensions, with the longer dimension (length) of the opening given first followed by width and depth. The most economical box for a
- 41. given cubic contents has the proportions of 2:1:2 (L:W:D). However, other proportions may also be used. For manufacturing boxes of any particular dimensions, it is first decided as to how the blanks for the boxes should be cut to minimise the wastage. The various steps involved in the fabrication of corrugated fibre board boxes are: Slitting & creasing; slotting; flap or corner cutting and stitching or gluing. Cutting and creasing are simultaneously carried out over a rotary cutting & creasing machine. The trimmed and creased sheet is slotted and flapped out on an eccentric slotter. Finally, it is either stitched using stiching machine or glued/taped manually. The boxes are shiped in the form of flat tube, which is set up and closed by the packer. Printing: There are different methods of printing the corrugated boxes. Some of the small scale manufacturers are printing the boxes after fabrication, by the technique of screen printing. However, printing can be done in a printer slotter machine. In this machine, the blanks are printed using soft rubber dies and the body score or vertical score and slots are introduced in the board. Printing can also be performed on the paper sheet, before making corrugated sheet/board. The layer of paper, which will come outside of the box, is printed on flexographic machine. The formed products are collected and the edges are trimmed to give it a proper shape. The plates and bowls are packed separately and stocked for dispatch. 4.0 COST OF THE PROJECT The estimated project cost is given below: (Rs. in lacs) Particulars Amount (Rs) Land & Site Development 5.60 Building & civil works 30.03 Plant & Machinery 41.75 Misc. Fixed assets 11.00 Preliminary & pre-operative expenses 7.38 Contingencies & escalation @ 3% 2.65 Working capital margin 6.47 TOTAL 104.88 4.1 Land & Site Development: No cost has been considered for land. Expenses on site development are estimated as below. Particulars Area (Sqm) Rate (Rs) Amount (Rs) Internal roads 100 400 40000 Boundary wall 140 rm 3000 420000 Site levelling, Gate, etc. LS LS 100000 TOTAL 560000 Say (Rs. in lacs) 5.60 4.2 Building & Civil Works: Details of building & civil works are given below. Particulars Area (Sqm) Rate (Rs) Amount (Rs) Workshed (Open shed, CGI sheet roof, concrete floor) 300 3500 1050000 Store room (Brick wall, CGI sheet roof, concrete floor) 150 6000 900000 Labor quarters (Brick wall, CGI sheet roof, concrete floor) 80 6000 480000 Administrative Room (Brick wall, CGI sheet roof, concrete floor) 50 6000 300000 Sub total 2730000 Add: Electrification, water supply and sanitation @ 10% 273000
- 42. TOTAL 3003000 Say (Rs. in lacs) 30.03 4.3 Plant & Machinery: Details of plant & machinery are given below. Particulars Qty Rate (Rs) Amount (Rs) Single face corrugating machine 1 400000 400000 Reel to sheet cutting machine 1 200000 200000 Creasing and cutting machine 1 250000 250000 Eccentric slotter 1 250000 250000 Partition slotter 1 80000 80000 Stitching machine 2 50000 100000 Vertical Bending machine 1 200000 200000 Single slotting machine 1 30000 30000 Multi color offset printing machine 1 1500000 1500000 Screen printing equipment 1 100000 100000 Grammage tester 1 10000 10000 Bursting Strength factor tester 1 50000 50000 Puncture Resistance teste 1 60000 60000 Compression Strength Tester 1 300000 300000 Miscellaneous items LS LS 100000 Sub total 3630000 Add: Installation, transporation, taxes, etc @ 15% 544500 TOTAL 4174500 Say (Rs. in lacs) 41.75 4.4 Misc. Fixed Assets: Details of miscellaneous fixed assets are given below. Particulars Qty Rate (Rs) Amount (Rs) Installation of tubewell 1 150000 150000 Transformer & power connection 1 300000 300000 40 KVA DG Set 1 300000 300000 Weighing machine 2 50000 100000 Fire fighting equipments LS LS 50000 Furniture & fixtures LS LS 50000 Miscellaneous items LS LS 50000 Sub total 1000000 Add: Installation, transporation, taxes etc @ 10% 100000 TOTAL 1100000 Say (Rs. in lacs) 11.00 4.5 Preliminary & Pre-operative Expenses: Details of preliminary & pre-operative expenses are given below. (Rs. in lacs) Particulars Amount (Rs) Travelling expenses 1.00 Professional & other fees 1.00 Interest during implementation 4.88 Miscellaneous expenses 0.50 TOTAL 7.38 4.6 Contingencies & Escalation: Contingencies & escalation has been assumed at 3% of the cost of site development, building & civil works, plant & machinery and miscellaneous fixed assets.
- 43. 4.7 Working Capital: Details of working capital are given below. (Rs. in lacs) Period (Days) Amount (Rs) Year 1 Year 2 Year 3 Raw Materials & Consumables 15 4.27 5.13 5.98 Power & fuel 30 0.17 0.20 0.24 Salary 30 0.77 0.77 0.78 Finished Goods 15 4.87 5.75 6.65 Receivables 15 6.10 6.66 7.77 Total 16.18 18.51 21.41 Working Capital Margin in Year 1 (40%) 6.47 5.0 MEANS OF FINANCE The means of finance for the project is estimated as below. (Rs. in lacs) Particulars Percent Amount EQUITY A. Equity from Promoters 40% 41.95 B. Subsidy from Central/ State Govt. - DEBT Term Loan from Banks/ FIs 60% 62.93 TOTAL 100% 104.88 6.0 PROFITABILITY STATEMENT (Rs. in lacs) Particulars Yr 1 Yr 2 Yr 3 Yr 4 Yr 5 Yr 6 Yr 7 A. INCOME Installed capacity (tonnes/ annum) of corrugated boxes 900 900 900 900 900 900 900 Capacity utilisation 50% 60% 70% 70% 70% 70% 70% Total production at capacity utilisation 450 540 630 630 630 630 630 Sale price (Rs/ tonne) 33000 30000 30000 30000 30000 30000 30000 Income from sales/ annum 148.50 162.00 189.00 189.00 189.00 189.00 189.00 B. OPERATING EXPENSES Raw Materials & Consumables 103.95 124.74 145.53 145.53 145.53 145.53 145.53 Power & fuel 2.06 2.48 2.89 2.89 2.89 2.89 2.89 Salary 9.36 9.41 9.45 9.50 9.55 9.60 9.64 Repair & Maintenance 0.83 0.91 1.00 1.10 1.21 1.33 1.47 Selling & administrative expenses 1.49 1.62 1.89 1.89 1.89 1.89 1.89 Miscellaneous Expenses 0.74 0.81 0.95 0.95 0.95 0.95 0.95 Total Operating Expenses 118.43 139.96 161.71 161.86 162.02 162.18 162.37 Less: working expenses capitalised 6.47 0.00 0.00 0.00 0.00 0.00 0.00 Operating profit 36.54 22.04 27.29 27.14 26.98 26.82 26.63 C. FINANCIAL EXPENSES Depreciation 3.90 3.90 3.90 3.90 3.90 3.90 3.90 Interest on Term Loan 8.47 7.53 6.17 4.81 3.45 2.10 0.74 Interest on Working Capital 1.55 1.78 2.06 2.06 2.06 2.06 2.06
- 44. Loan Net Profit 22.62 8.82 15.16 16.37 17.57 18.76 19.94 Net cash accruels 26.52 12.73 19.06 20.27 21.47 22.67 23.84 Principal Repayment 2.52 10.07 10.07 10.07 10.07 10.07 10.07 6.1 Raw material & consumables: Expenses on raw material and consumables at installed capacity is estimated as below. Installed production capacity (Tonnes) 900 Scaling loss 5% Total consumption of raw materials & consumables (Tonnes) 945 Avg price (Rs/ tonne) 22000 Expenses on raw materials & consumables at installed capacity (Rs) 20790000 6.2 Power: Expenses on power at installed capacity is estimated as below. A. Expenses on power Connected load (kw) 40 Avg load factor 70% Proportion running on power (%) 80% Hrs/ day 8 Days/ annum 300 Annual power consumption 53760 Rate (Rs/ unit) 5 Expenses on power (Rs) 268800 B: Estimate of Diesel required for Generator Proportion running on diesel (%) 20% Hrs/ annum 480 Consumption (litres/ hr) 6 Price (Rs/ litre) 50 Expenses on diesel (Rs) 144000 Expenses on power & fuel at installed capacity (Rs) 412800 6.3 Salary: Expenses on salary in the 1st year are estimated as given below. It is assumed that salary expenses will increase @ 0.5% every subsequent year. Particulars of Employee Numbers Salary/ Month (Rs) Cost/ annum (Rs) Plant Manager 1 10000 120000 Supervisor 1 8000 96000 Technicians/ machine operators 4 6000 288000 Sales staff/ administrative staff 3 4000 144000 Unskilled workers/ helpers 8 3000 288000 Expenses on salary in the 1st year (Rs) 936000 6.4 Repair & Maintenance: Expenses on repair & maintenance in the 1st year is estimated as given below. It is assumed that expenses on repair & maintenance will increase @ 10% every subsequent year. (Rs. in lacs) Particulars Cost (Rs) Rate Amount (Rs) Building & civil works 30.58 1% 0.31 Plant & Machinery 41.75 1% 0.42 Misc. Fixed assets 11.00 1% 0.11 Expenses on repair & maintenance in year 1 0.83
- 45. 6.5 Selling & Administrative Expenses: Selling expenses have been assumed at 1% of sales. 6.6 Miscellaneous Expenses: Miscellaneous expenses have been assumed at 0.5% of sales. 6.7 Depreciation: Depreciation has been calculated by straight line method. The details of calculation are given below. (Rs in lacs) Description Cost (Rs) Rate Amount/ annum (Rs) Building & civil works 30.03 3.34% 1.00 Plant & Machinery 41.75 5.28% 2.20 Misc. Fixed Assets 11.00 6.33% 0.70 TOTAL 3.90 6.8 Interest on Working Capital Loan: Interest rate on working capital loan has been assumed at 16%. The details of calculation are given below. (Rs. in lacs) Particulars Year 1 Year 2 Year 3 Total current assets 16.18 18.51 21.41 Bank Loan (60%) 9.71 11.11 12.84 Interest @ 16% 1.55 1.78 2.06 6.9 Interest on term loan & principal repayment: Interest rate on term loan has been assumed at 13.5%. Duration of Loan repayment has been considered for a period of 7 years including moratarium period of 12 months with equal monthly installments. The details of calculation are given below. (Rs in lakh) Month Year 1 2 3 4 5 6 7 Month 1 Opening balance 62.93 60.41 50.34 40.27 30.21 20.14 10.07 Repayment 0.00 0.84 0.84 0.84 0.84 0.84 0.84 Interest (13.5%) 0.71 0.68 0.57 0.45 0.34 0.23 0.11 Closing balance 62.93 59.57 49.50 39.44 29.37 19.30 9.23 Month 2 Opening balance 62.93 59.57 49.50 39.44 29.37 19.30 9.23 Repayment 0.00 0.84 0.84 0.84 0.84 0.84 0.84 Interest 0.71 0.67 0.56 0.44 0.33 0.22 0.10 Closing balance 62.93 58.73 48.67 38.60 28.53 18.46 8.39 Month 3 Opening balance 62.93 58.73 48.67 38.60 28.53 18.46 8.39 Repayment 0.00 0.84 0.84 0.84 0.84 0.84 0.84 Interest 0.71 0.66 0.55 0.43 0.32 0.21 0.09 Closing balance 62.93 57.89 47.83 37.76 27.69 17.62 7.55 Month 4 Opening balance 62.93 57.89 47.83 37.76 27.69 17.62 7.55 Repayment 0.00 0.84 0.84 0.84 0.84 0.84 0.84 Interest 0.71 0.65 0.54 0.42 0.31 0.20 0.08 Closing balance 62.93 57.06 46.99 36.92 26.85 16.78 6.71 Month 5 Opening balance 62.93 57.06 46.99 36.92 26.85 16.78 6.71 Repayment 0.00 0.84 0.84 0.84 0.84 0.84 0.84 Interest 0.71 0.64 0.53 0.42 0.30 0.19 0.08 Closing balance 62.93 56.22 46.15 36.08 26.01 15.94 5.87 Month 6 Opening balance 62.93 56.22 46.15 36.08 26.01 15.94 5.87 Repayment 0.00 0.84 0.84 0.84 0.84 0.84 0.84 Interest 0.71 0.63 0.52 0.41 0.29 0.18 0.07 Closing balance 62.93 55.38 45.31 35.24 25.17 15.10 5.03 Month 7 Opening balance 62.93 55.38 45.31 35.24 25.17 15.10 5.03 Repayment 0.00 0.84 0.84 0.84 0.84 0.84 0.84
- 46. Interest 0.71 0.62 0.51 0.40 0.28 0.17 0.06 Closing balance 62.93 54.54 44.47 34.40 24.33 14.26 4.20 Month 8 Opening balance 62.93 54.54 44.47 34.40 24.33 14.26 4.20 Repayment 0.00 0.84 0.84 0.84 0.84 0.84 0.84 Interest 0.71 0.61 0.50 0.39 0.27 0.16 0.05 Closing balance 62.93 53.70 43.63 33.56 23.49 13.42 3.36 Month 9 Opening balance 62.93 53.70 43.63 33.56 23.49 13.42 3.36 Repayment 0.00 0.84 0.84 0.84 0.84 0.84 0.84 Interest 0.71 0.60 0.49 0.38 0.26 0.15 0.04 Closing balance 62.93 52.86 42.79 32.72 22.65 12.59 2.52 Month 10 Opening balance 62.93 52.86 42.79 32.72 22.65 12.59 2.52 Repayment 0.84 0.84 0.84 0.84 0.84 0.84 0.84 Interest 0.71 0.59 0.48 0.37 0.25 0.14 0.03 Closing balance 62.09 52.02 41.95 31.88 21.82 11.75 1.68 Month 11 Opening balance 62.09 52.02 41.95 31.88 21.82 11.75 1.68 Repayment 0.84 0.84 0.84 0.84 0.84 0.84 0.84 Interest 0.70 0.59 0.47 0.36 0.25 0.13 0.02 Closing balance 61.25 51.18 41.11 31.05 20.98 10.91 0.84 Month 12 Opening balance 61.25 51.18 41.11 31.05 20.98 10.91 0.84 Repayment 0.84 0.84 0.84 0.84 0.84 0.84 0.84 Interest 0.69 0.58 0.46 0.35 0.24 0.12 0.01 Closing balance 60.41 50.34 40.27 30.21 20.14 10.07 0.00 Principal Repayment 2.52 10.07 10.07 10.07 10.07 10.07 10.07 Interest 8.47 7.53 6.17 4.81 3.45 2.10 0.74 7.0 DEBT SERVICE COVERAGE RATIO (DSCR) (Rs. in lacs) Year 1 2 3 4 5 6 7 TOTAL Profit After Tax (Net Profit) 22.62 8.82 15.16 16.37 17.57 18.76 19.94 Depreciation 3.90 3.90 3.90 3.90 3.90 3.90 3.90 Interest 8.47 7.53 6.17 4.81 3.45 2.10 0.74 Total 34.99 20.26 25.23 25.09 24.93 24.76 24.58 179.84 Interest 8.47 7.53 6.17 4.81 3.45 2.10 0.74 Loan repayment 2.52 10.07 10.07 10.07 10.07 10.07 10.07 Total 10.98 17.60 16.24 14.88 13.52 12.16 10.80 96.20 DSCR 3.19 1.15 1.55 1.69 1.84 2.04 2.27 Average DSCR = 1.87 8.0 BREAK EVEN POINT (BEP) (Rs. in lacs) Year 1 2 3 A. Net sales (Rs. lakh) 148.50 162.00 189.00 B. Variable cost Raw Materials & Consumables 103.95 124.74 145.53 Power & fuel 2.06 2.48 2.89 Selling & administrative expenses 1.49 1.62 1.89 Miscellaneous expenses 0.74 0.81 0.95 Interest on Working Capital Loan 1.55 1.78 2.06 Total variable cost 109.79 131.42 153.31
- 47. C. Contribution (A-B) 38.71 30.58 35.69 D. Fixed & Semi-fixed Costs Salary 9.36 9.41 9.45 Repair & maintenance 0.83 0.91 1.00 Interest on Term Loan 8.47 7.53 6.17 Depreciation 3.90 3.90 3.90 Total fixed cost 22.56 21.75 20.53 E. BREAKEVEN POINT 58.28% 71.15% 57.53% F. BEP at operating capacity 29.14% 42.69% 40.27% G. Cash BEP 24.10% 35.03% 32.61% 9.0 INTERNAL RATE OF RETURN (IRR) (Rs. in lacs) Year 0 1 2 3 4 5 6 7 8 9 10 CASH OUTFLOW Capital Expenditure 88.38 0.00 0.00 0.00 0.00 0.00 0.00 0.00 0.00 0.00 0.00 Working Capital 0.00 16.18 2.33 2.90 0.00 0.00 0.00 0.00 0.00 0.00 0.00 Total (A) 88.38 16.18 2.33 2.90 0.00 0.00 0.00 0.00 0.00 0.00 0.00 CASH INFLOW Profit After Tax 22.62 8.82 15.16 16.37 17.57 18.76 19.94 20.48 20.27 20.04 Add: Depreciation 3.90 3.90 3.90 3.90 3.90 3.90 3.90 3.90 3.90 3.90 Add: Interest 8.47 7.53 6.17 4.81 3.45 2.10 0.74 0.00 0.00 0.00 Add: Salvage Value Total (B) 0.00 34.99 20.26 25.23 25.09 24.93 24.76 24.58 24.38 24.17 23.95 NET FLOW (B-A) -88.38 18.81 17.93 22.34 25.09 24.93 24.76 24.58 24.38 24.17 23.95 IRR = 21%