The document outlines an educational project focused on creating geographic and thematic map projections, requiring students to generate a reference map featuring their hometown along with a thematic map based on poverty rates in a selected country. It involves understanding and comparing different coordinate systems (geographic, UTM, state plane), documenting map projections and their properties, and submitting a comprehensive report with visuals. The project emphasizes accuracy, proper citation, and a detailed understanding of cartographic techniques to meet assignment criteria.
![Project 1: Plotting Coordinates and Projections
[Your Name]
Part A: Reference Map Projection
[Your first map image(s) should include a descriptive caption
with appropriate source citation.]
[Replace the example map shown above with one you create
using the Interactive Album of Map Projections. Like the
sample map, yours should highlight the location of your home
town. Generate at least on map projection that is different than
the one above and that is suited to a reference map focused on
the part of the glob you chose to depict (your map does not need
to cover the entire world). Feel free to include distortion
ellipses if you wish. After you've replaced the sample map,
replace this text with your own description of the map
projection you created. State which geometric properties of the
globe (i.e., sizes, shapes, distances, and directions) that your
projection preserves, and which it distorts. (One way to earn
“above and beyond” points is to explain the distortion pattern
represented in the ellipses.) If you choose to show only a
portion of the globe that frames your particular country or
region of interest, specify the bounding coordinates used.]
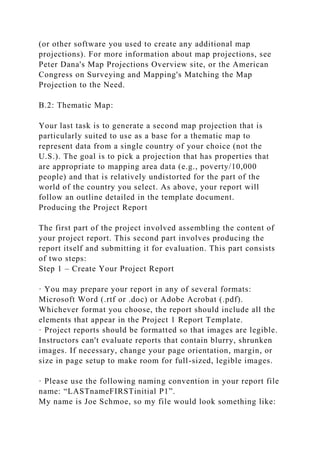
Geographic Coordinates
The place name shown on the map above represents the location
of my hometown. The geographic coordinates of my home town
are:
Latitude: _____° _____' _____" N, Longitude: _____° _____'
_____" W
[Describe the geographic coordinate system in your own words.
Why are latitude and longitude coordinates expressed in degrees](https://image.slidesharecdn.com/project1plottingcoordinatesandprojectionsyournamepa-221026043722-617f3f94/85/Project-1-Plotting-Coordinates-and-Projections-Your-Name-Pa-docx-1-320.jpg)
![rather than distance units? Are latitude and longitude
coordinates projected? If so, how? How does the concept of a
"horizontal datum" relate to the geographic coordinate system?]
UTM Coordinates
The UTM coordinates (NAD83 or NAD27) of my hometown are:
Easting: _____________ meters, Northing: _____________
meters, Zone: __________
[Describe the UTM coordinate system in your own words. Why
are eastings and northings expressed in meters rather than
degrees? Are UTM coordinates projected? How? Do the UTM
coordinates cover the entire globe? Are there any disadvantages
to using the UTM coordinate system?]
State Plane Coordinates
The State Plane coordinates of my hometown are:
Easting: _____________ meters, Northing: _____________
meters, Zone: __________
[Describe the State Plane Coordinate system (or your national
or local coordinate system) in your own words. Why are
eastings and northings expressed in meters rather than degrees?
Are SPC coordinates projected? How? How do State Plane
Coordinate systems’ projections differ among the 50 US States?
Why?]
Comparison
[Finally, compare and contrast the three coordinate systems in
your own words—consider appropriate usage, accuracy, and
ease of calculation. Why are some coordinates projected and
others not? What geometric property is preserved in projected
coordinate systems, and why? Explain the difference between
NAD83 and NAD27. Why are different horizontal datums in](https://image.slidesharecdn.com/project1plottingcoordinatesandprojectionsyournamepa-221026043722-617f3f94/85/Project-1-Plotting-Coordinates-and-Projections-Your-Name-Pa-docx-2-320.jpg)
![use?]
Part B: Thematic Map Projection
[Next, you will select and generate a map projection that would
be a good choice as a base for a thematic map (of poverty
rate/10,000 people) in any country in the world other than the
U.S. First, select and name a country to pick a map projection
for].
The map in this part of the report is generated for use as a base
to represent [list the country]
[Next use the Interactive Album of Map Projections tool to
create a base map centered on the country you selected and
using a map projection that would be appropriate as a base to
generate a poverty map. Focus the map you generate on the
country you are focused on. It is OK to include some
surrounding context, but do not use a map of the entire world.
As above, copy and save at least one screen capture that shows
the map you generated.]
[Insert the screen capture(s) into your report and add an
appropriate caption(s).]
[Create a short report on the projection (e.g., what is its central
meridian, what are its lat-long bounds, were any specific
parameters applied (other than the central meridian). Then,
explain in your own words why the projection generated and
illustrated would be particularly good as the base of a poverty
map for your country of choice. Which properties does the
projection have and why are they important for this thematic
map? Which properties does the projection not have and why is
it OK that they are not present for this thematic map?]
Sources [Edit as appropriate]](https://image.slidesharecdn.com/project1plottingcoordinatesandprojectionsyournamepa-221026043722-617f3f94/85/Project-1-Plotting-Coordinates-and-Projections-Your-Name-Pa-docx-3-320.jpg)
![Getty Research Institute (2000). Getty Thesaurus of Geographic
Names. Retrieved July 7, 2007, from
http://www.getty.edu/research/tools/vocabulary/tgn/index.html
[Use this to find geographic coordinates for international
locations.]
National Geodetic Survey (no date) NADCON - North American
Datum Conversion Utility. Retrieved July 7, 2007, from
http://www.ngs.noaa.gov/TOOLS/Nadcon/Nadcon.html
National Geodetic Survey (2004). SPC Utilities. Retrieved
July 7, 2007, from http://www.ngs.noaa.gov/TOOLS/spc.html
National Geodetic Survey (2004). UTM Utilities. Retrieved
July 7, 2007, from http://www.ngs.noaa.gov/TOOLS/utm.html
Penn State Online GIS Education (2005). Interactive Album of
Map Projections. Retrieved July 7, 2007, from
http://projections.mgis.psu.edu
United States Geological Survey (2006). Geographic Names
Information System. Retrieved July 7, 2007, from
http://geonames.usgs.gov [Use this to find geographic
coordinates for U.S. locations.]
United States Geological Survey (2006). Map Projections
Poster. Retrieved July 7, 2007, from
http://erg.usgs.gov/isb/pubs/MapProjections/projections.html
[More information about projections here.]
This document is published in fulfillment of an assignment by a
student enrolled in an educational offering of The Pennsylvania
State University. The student, named above, retains all rights to
the document and responsibility for its accuracy and originality.
Project 1: Plotting Coordinates and Projections
Original version by David DiBiase and Hank Rademacher,](https://image.slidesharecdn.com/project1plottingcoordinatesandprojectionsyournamepa-221026043722-617f3f94/85/Project-1-Plotting-Coordinates-and-Projections-Your-Name-Pa-docx-4-320.jpg)


![referenced. At least two in-line citations included. Active
hyperlinks to websites included in source section. Source access
dates correct. (Quality)
8
Prose quality (complete sentences, student’s own words,
punctuation and spelling)
10
“ABOVE AND BEYOND”
Examples include adding and commenting upon distortion
ellipses, multiple projections, or other supplemental
illustrations
10
TOTAL maximum score
100
Instructions
The Project 1 Report Template includes a map of the world with
State College, Pennsylvania, labeled as the home town.
Following the map is text that you will edit, substituting
information about your own map for blanks ("___") and
instructions [in brackets]. There are three sections dealing with
the location of your home town. Then, there is a section dealing
with picking a projection for a thematic map focused on a
country other than the U.S.
Project 1 Report Template
· You should consider the Report Template a suggested guide in](https://image.slidesharecdn.com/project1plottingcoordinatesandprojectionsyournamepa-221026043722-617f3f94/85/Project-1-Plotting-Coordinates-and-Projections-Your-Name-Pa-docx-9-320.jpg)


![· Define map extents to "zoom in" to a larger-scale view. Most
map projections allow you to specify extents as latitude and
longitude coordinates (in decimal degree format). Some
projections require you to define extents in terms of meters
from the projection center. (Remember to click Redraw Map to
display your changes.)
To convert from degrees minutes and seconds to decimal
degrees, refer back to Chapter 2 in your online text or search for
an online conversion utility.
· Plot a location using the geographic coordinates you recorded
earlier. Be sure to convert your coordinates to decimal degree
format before you plot them. (Remember to click Redraw Map
to display your changes.)
· Take note of your final specifications on a piece of paper (or
print the Interactive Atlas screen).
You will need to refer to the specifications to in your project
report.
· Once you have produced a satisfactory map, save it as a PNG
(Portable Network Graphics) file. (Don't save it as a bitmap
[.bmp]; such files are very large.) Place your mouse pointer
over the map in your browser, depress the right mouse button,
and save the image using the command in the popup menu.
Name the file something like "Project1map.png", then save the
file on your hard drive making note of the location. You will
insert this image in your project report.
3. Compile selected metadata for your map.
As requested in the paragraph that follows the map in the report
template, identify the map projection you selected (pick on
different from that shown in the sample report). You should
state which geometric properties of the globe (i.e., sizes,
shapes, distances, and directions) are preserved and which are
distorted. If you choose to show only a portion of the globe that
frames your particular country or region of interest, specify the
bounding coordinates used. Acknowledge the Interactive Atlas](https://image.slidesharecdn.com/project1plottingcoordinatesandprojectionsyournamepa-221026043722-617f3f94/85/Project-1-Plotting-Coordinates-and-Projections-Your-Name-Pa-docx-13-320.jpg)