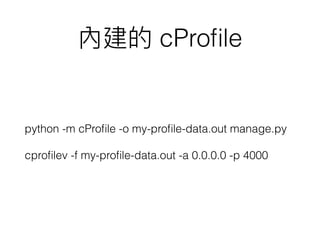
Download as PDF, PPTX


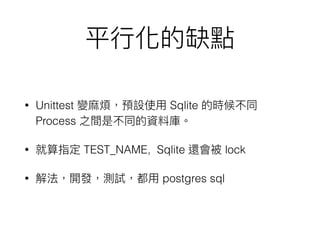
![1. models = MyModel.object.all()
2. filtered = models.filter( size__lte=20 )
3. fronts = filtered[:9]
4. print(fronts[0].attribute)](https://image.slidesharecdn.com/profiledjango-160112121159/85/Profile-django-2-320.jpg)

![code snippet
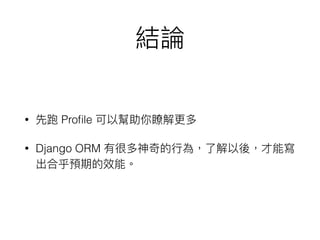
def store_conversion(post_back, conversion_type):
time_stamp = dateutil.parser.parse(post_back['at'])
nested_data = post_back['data']
if not nested_data:
return
try:
ConversionRecord.objects.create( time_stamp=time_stamp )
except IntegrityError:
pass](https://image.slidesharecdn.com/profiledjango-160112121159/85/Profile-django-22-320.jpg)


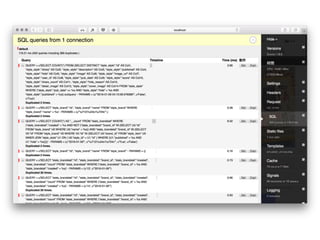
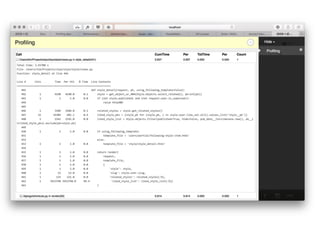
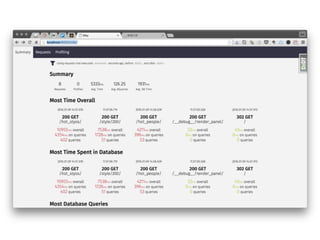
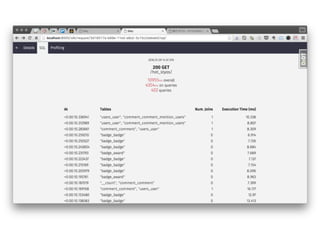
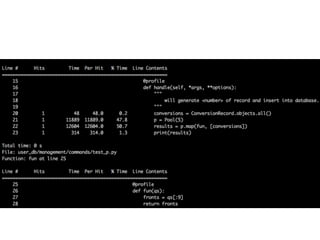
This document discusses various techniques for profiling Django applications, including: 1. Using the Django debug toolbar to profile views and SQL queries. 2. Using cProfile and kernprof to profile Python code like Django commands and functions. This helps identify slow parts of code. 3. Benchmarking queries, bulk create operations, and the ORM to find performance bottlenecks in database interactions. Unittests on SQLite can also help profile code.