Download as PDF, PPTX


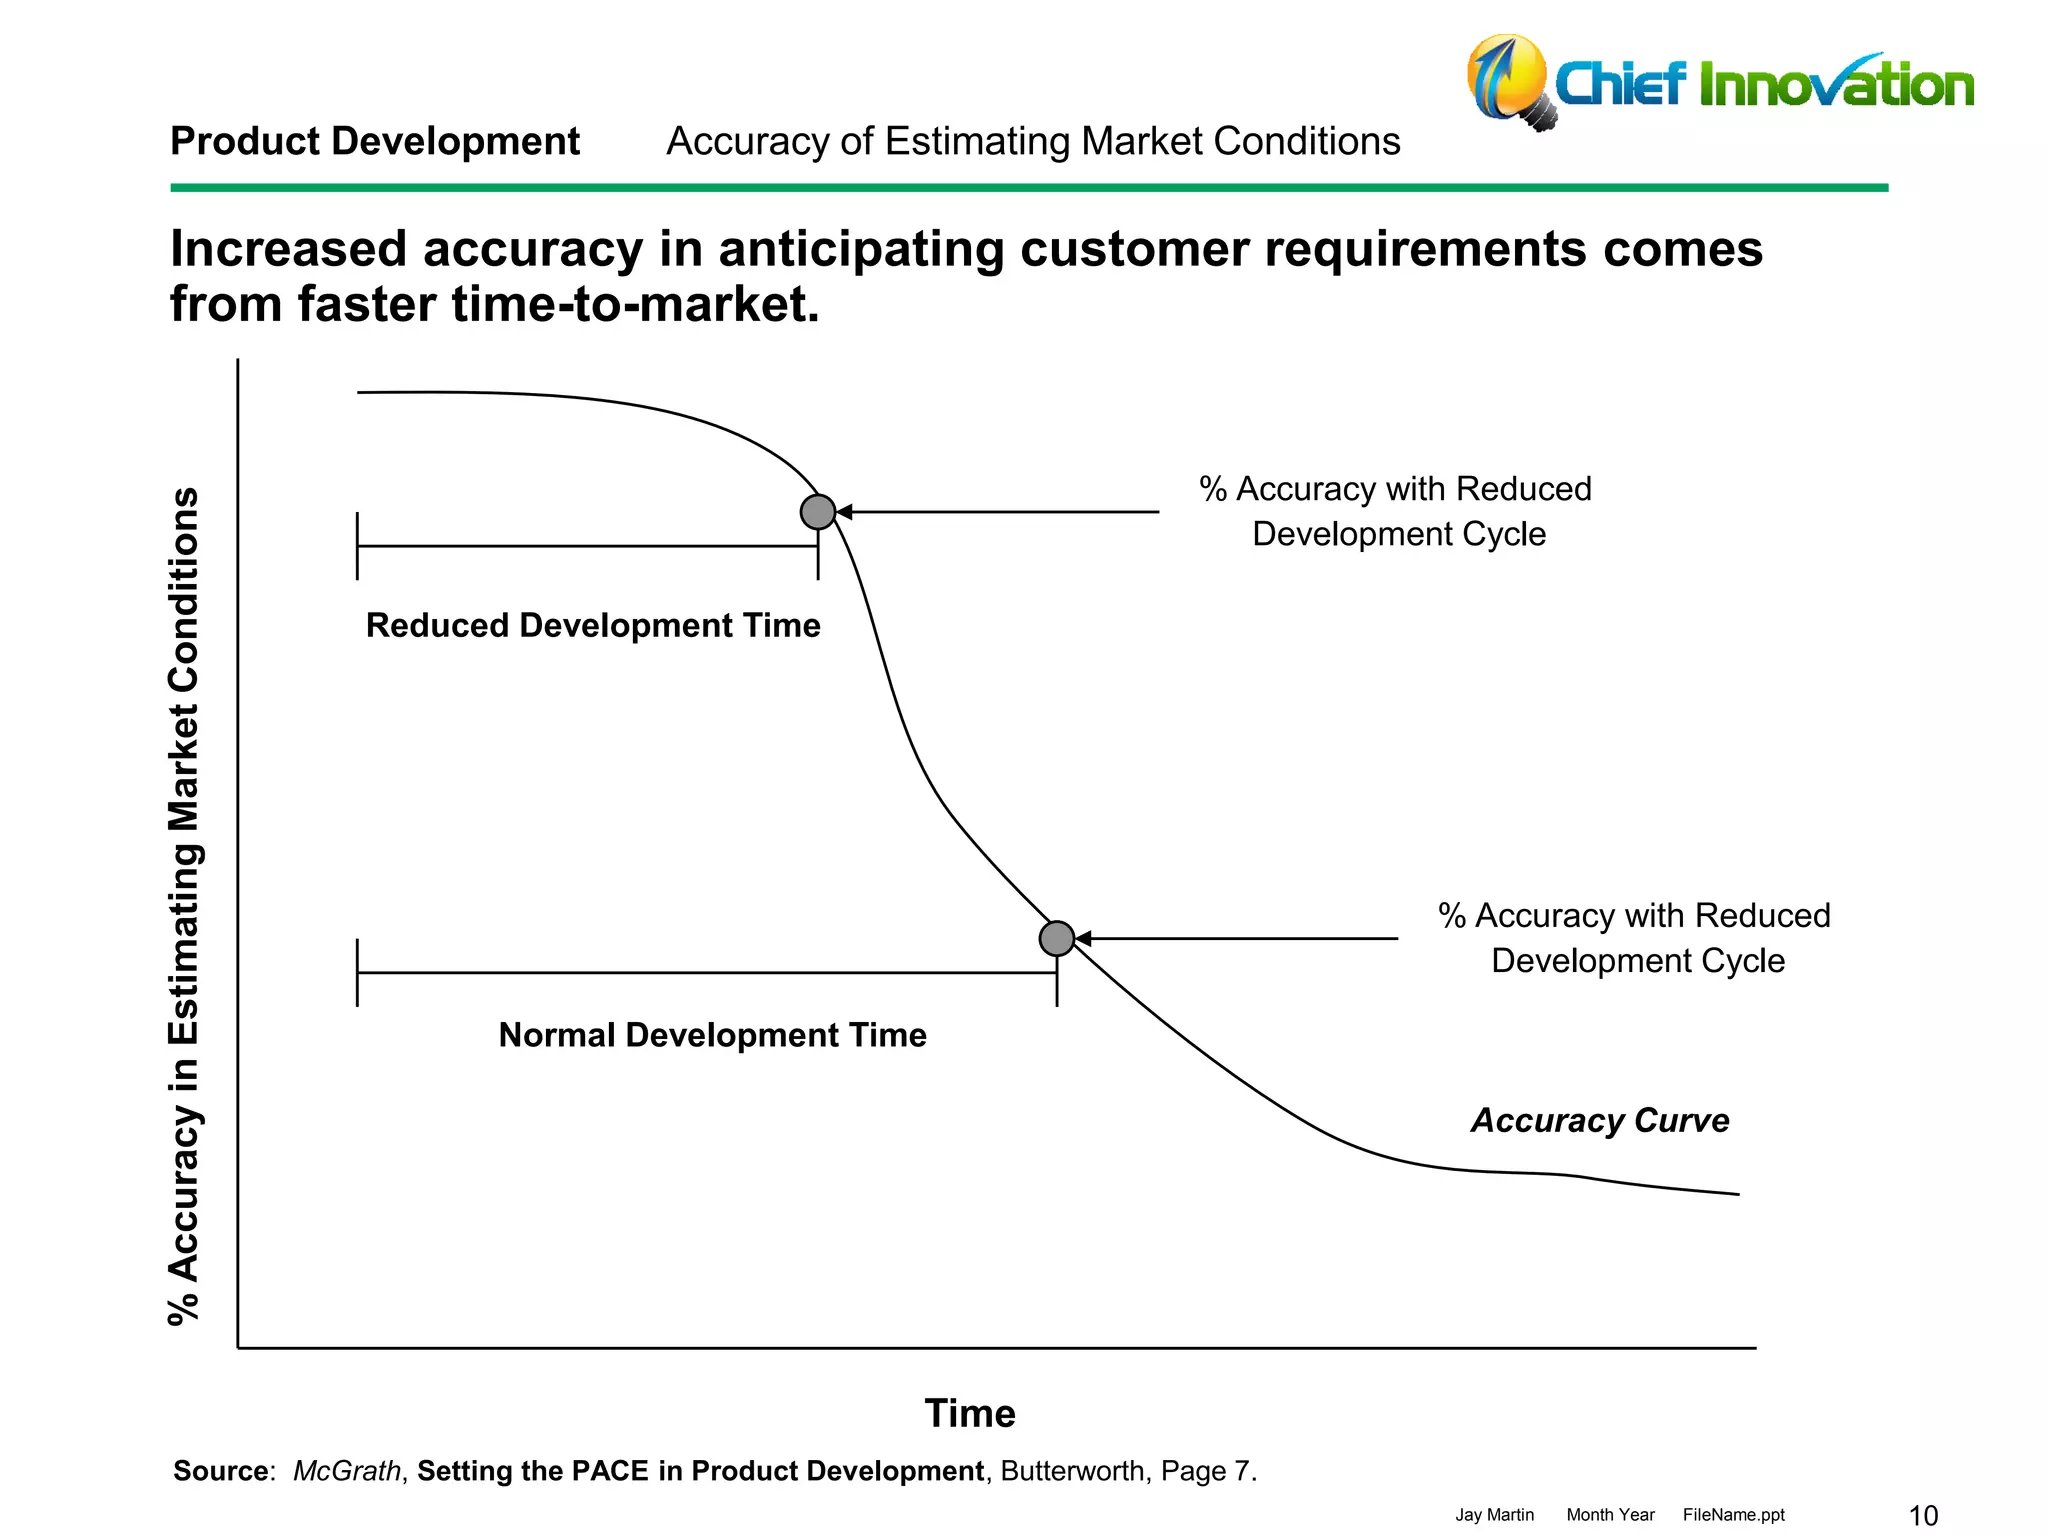
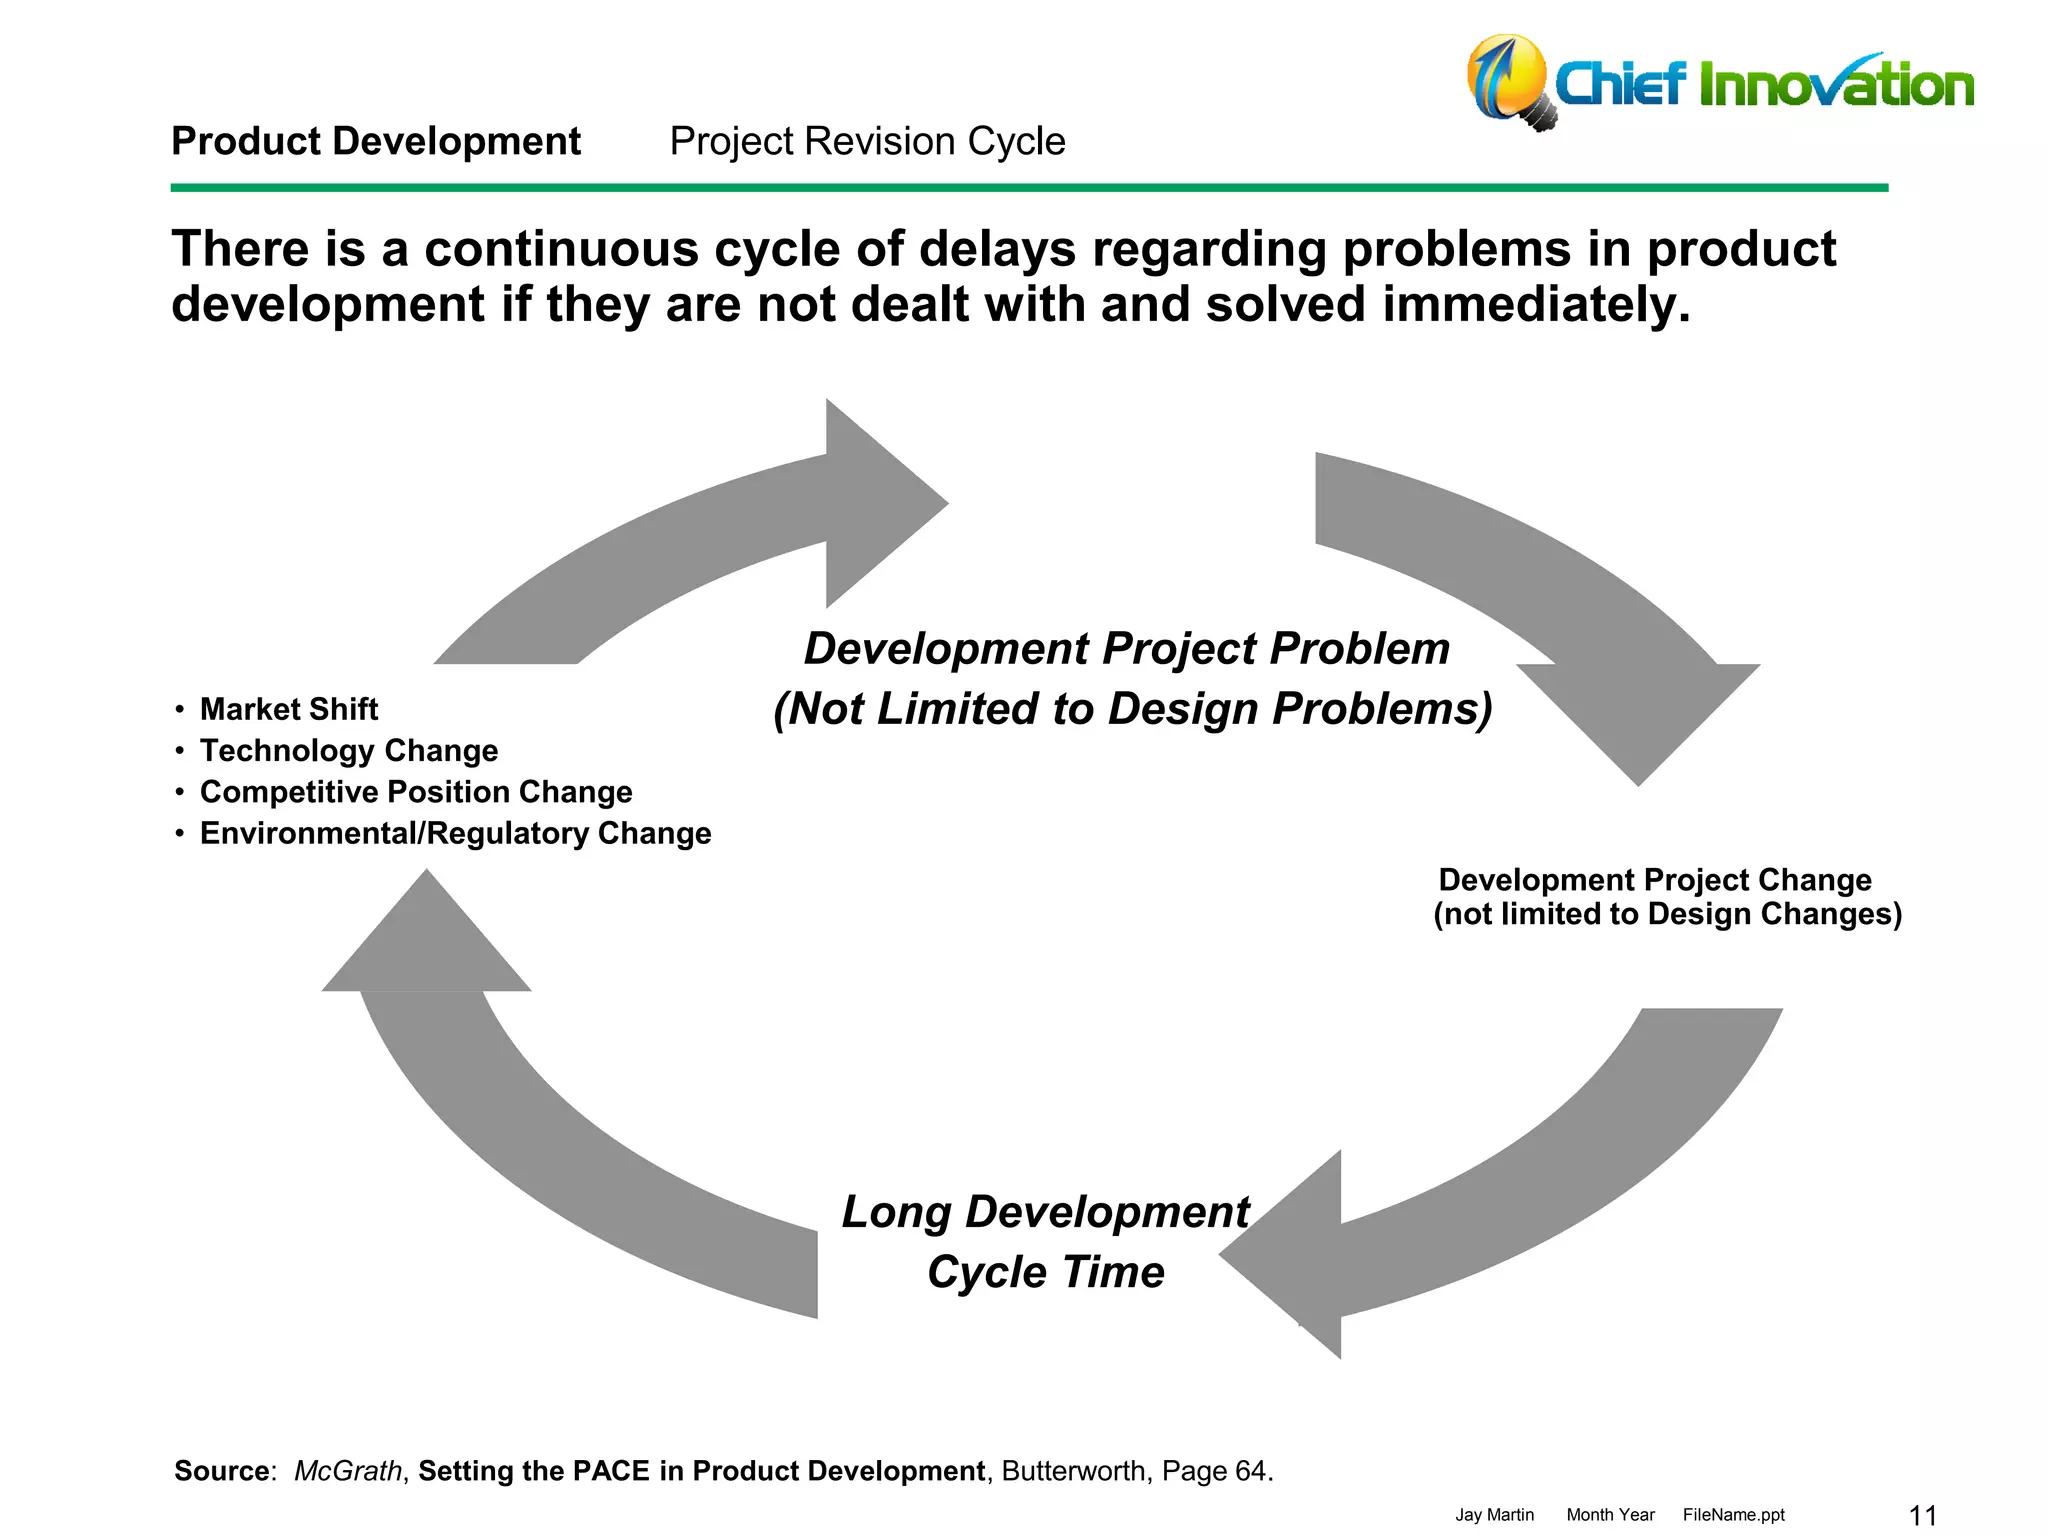
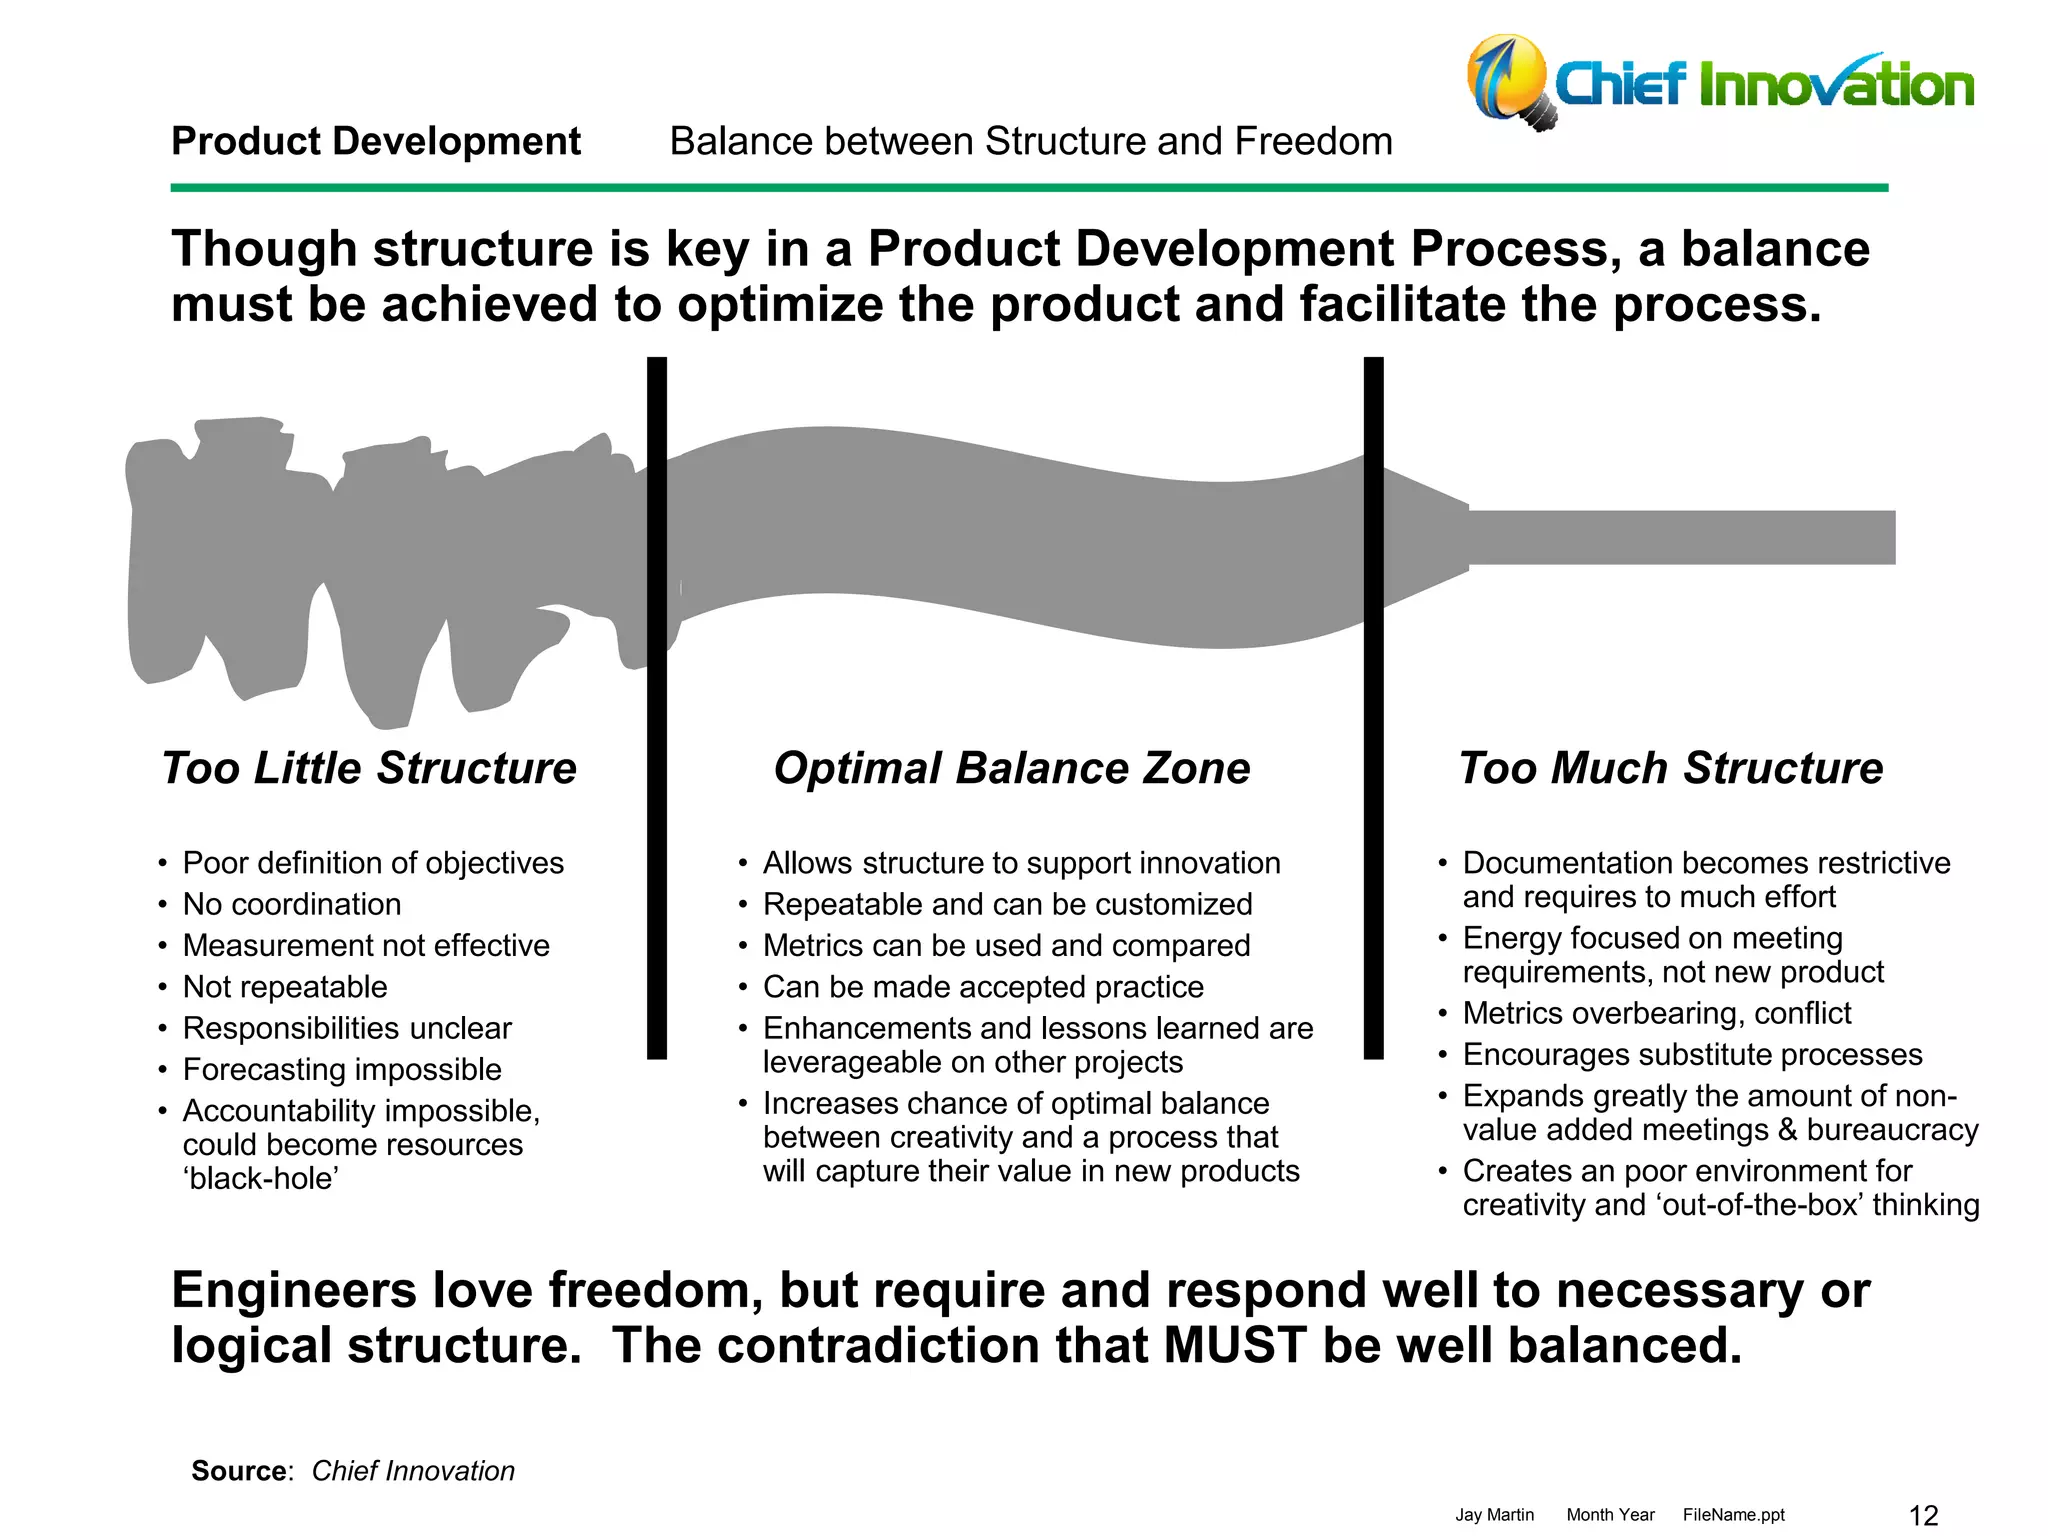

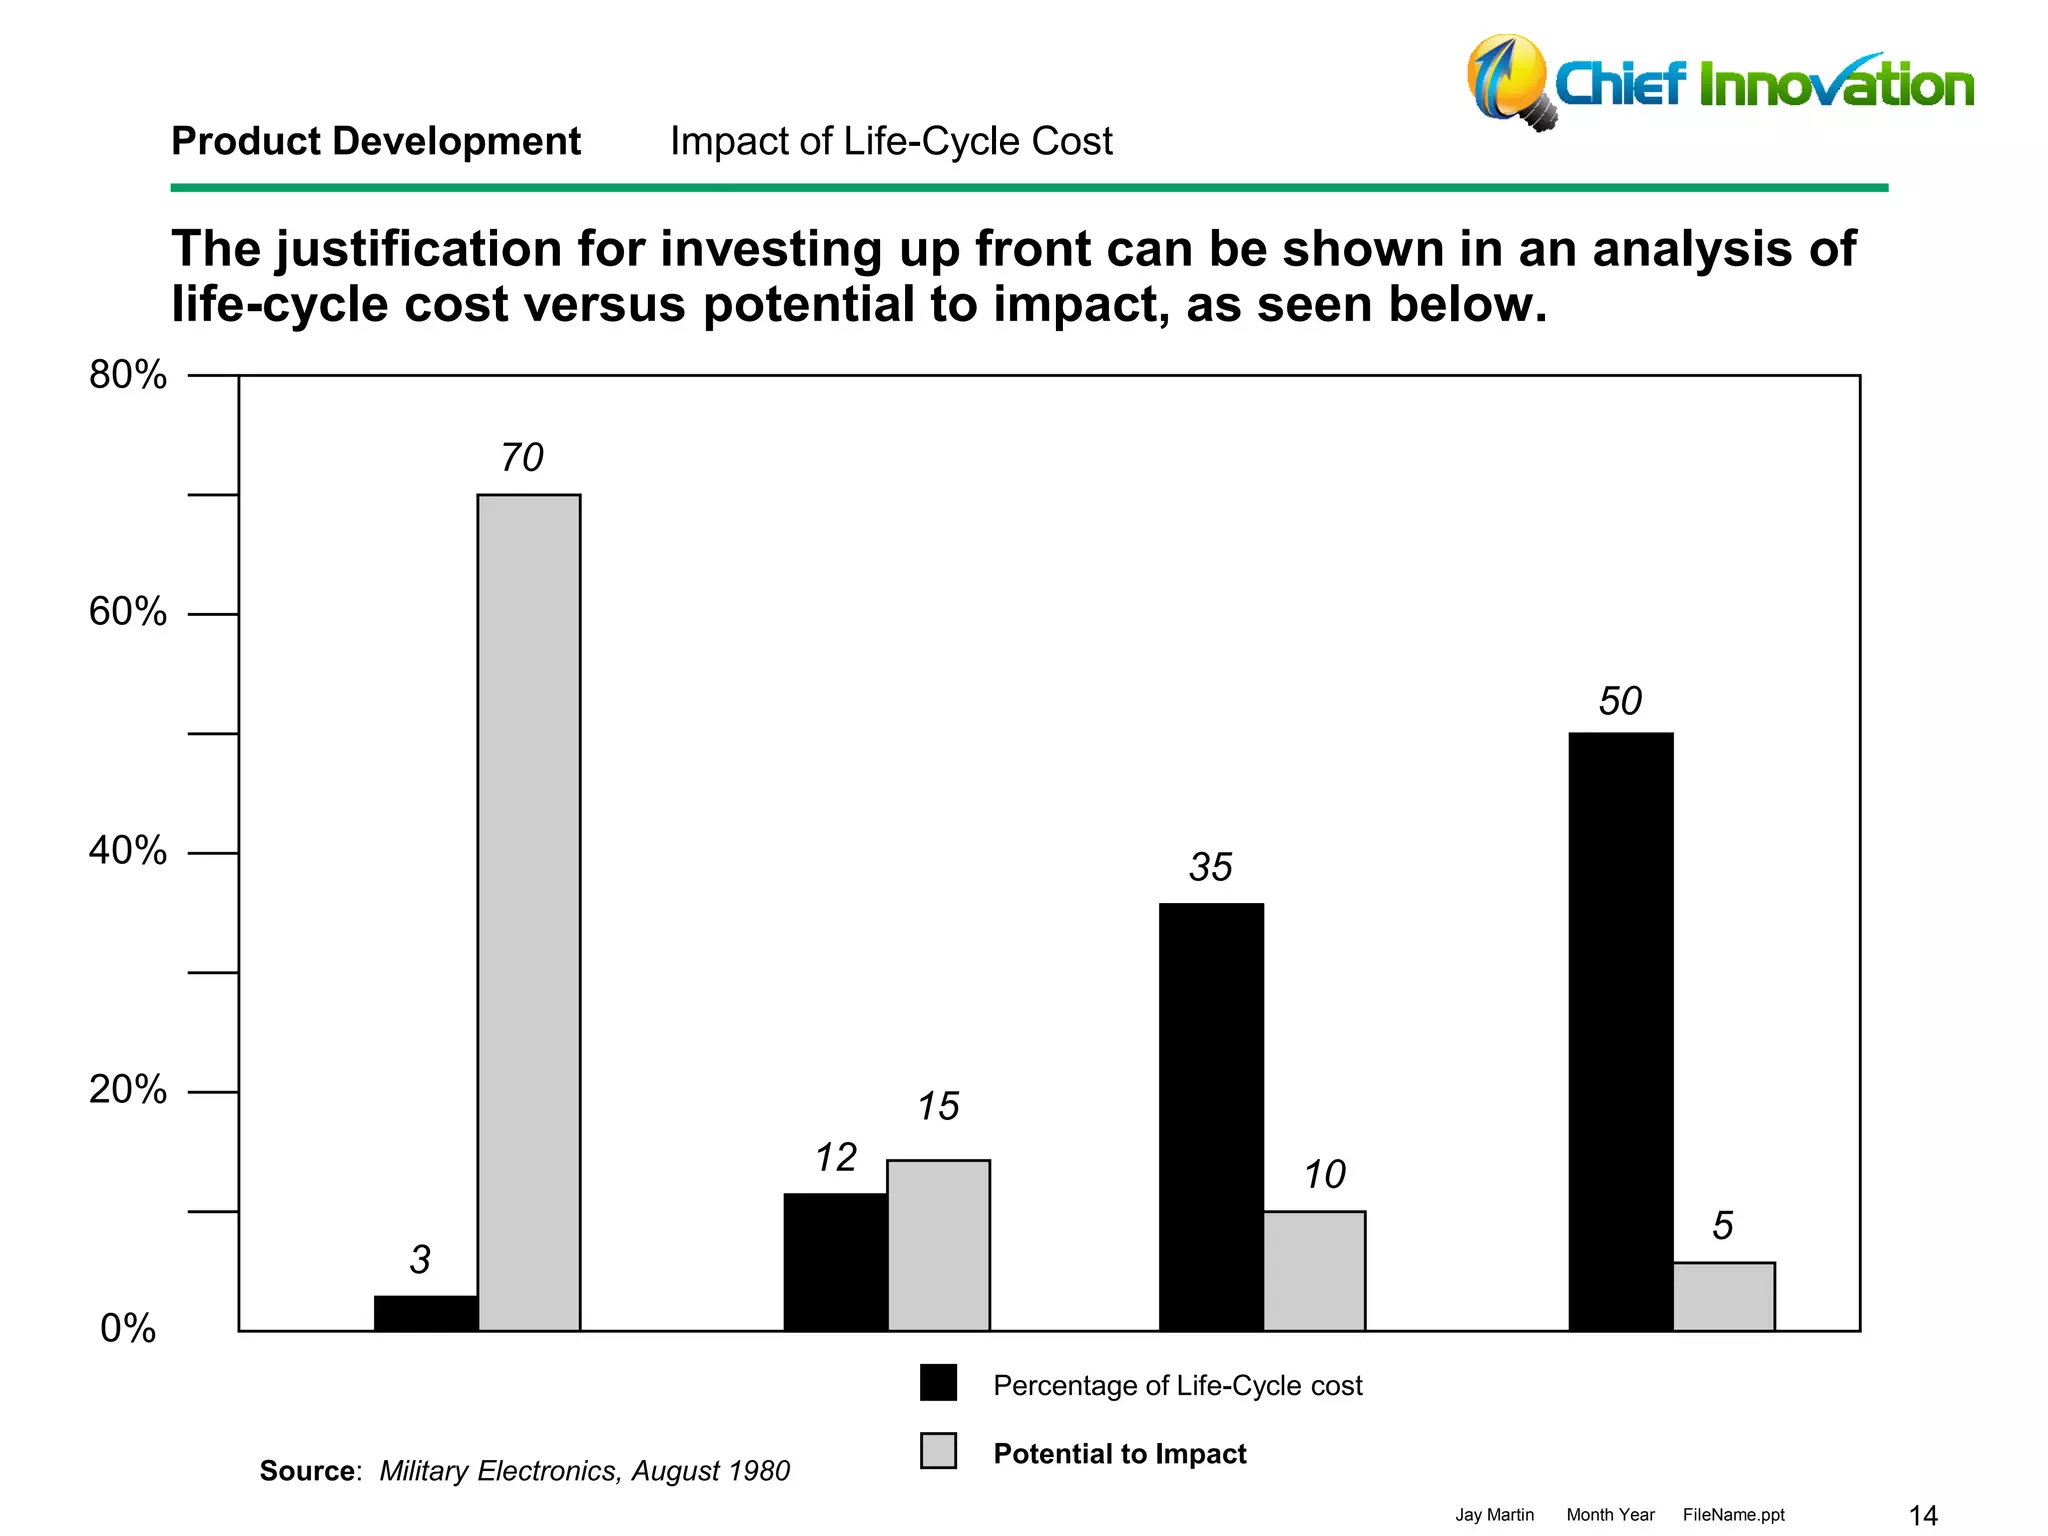
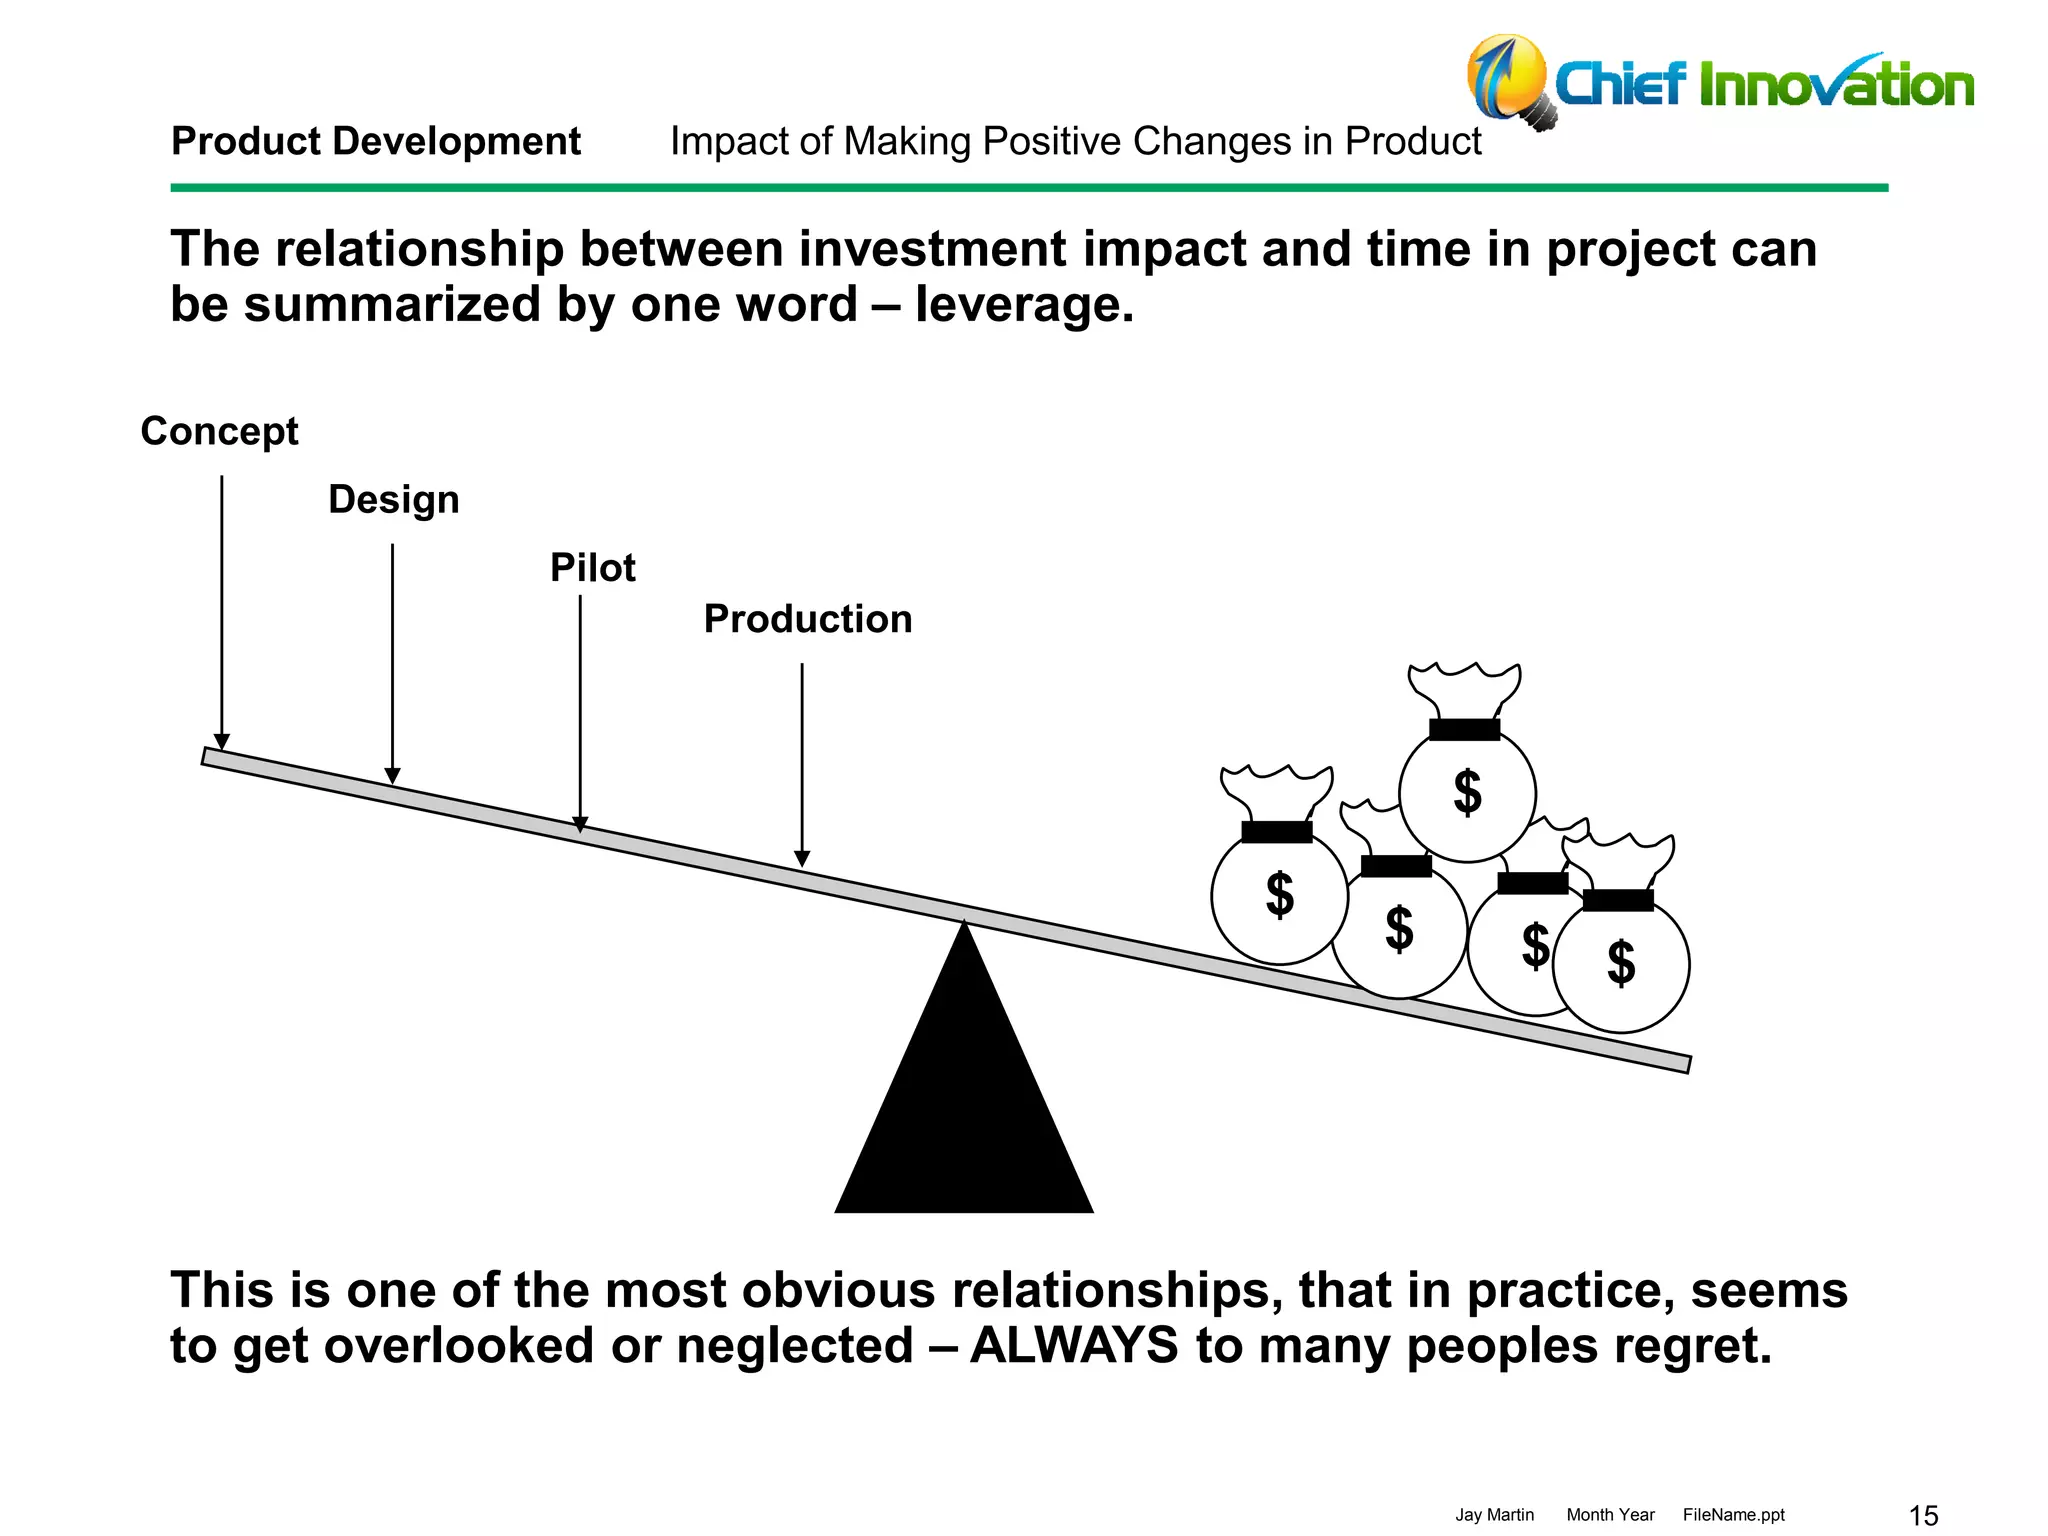


The document discusses key aspects of product development, including management involvement, project complexity, and metrics for balancing speed, cost, performance, and expenses. It highlights the importance of customer involvement and risk management throughout the development process, as well as the relationship between life-cycle costs and the timing of product changes. Additionally, it emphasizes the necessity of structure and flexibility in engineering to foster creativity while maintaining effective processes.