Download to read offline

![Telecom fiber can be
customized on the basis of
physical utilization of an
ROI in terms of updated inventory individual section and the
of cable assets like physical logical utilization of rings.
utilization of Active and Dark
cable (OFC/Copper/HFC) for sales Fiber can be edited on web
team to sell instantly and O&M for updation in section
team for easy maintenance etc. attributes such as ring
name, active equipment
and customers etc.
Centralized Network data on Web
for Decision Making and
Business Planning
3D building Data on Hosted
On-site real-time updation of
Physical Utilization of Cable
Model - Find the best
feasible option (highest
building or existing tower)
available for los within the
defined territory in the form
Planning over the updated
Inventory of telecom assets
of radial distance.
Real-time view of Bandwidth
utilization of Telecom Assets
Fibre and Attribute editing on
Web
Display Wireless coverage
plot (3G, WIMAX, LTE etc.)
to see the type of signal at
the Area of Interest.
Quickly identify the location of a
Different color zones define
fiber break by entering OTDR
measurements
types of signal level - Blue
to Yellow [good to average
signal].
Filter search i.e. optimize the
search for connections, length
and attenuation
About Company
Company Software is a leading global provider of innovative IT solutions and Services, offering a broad portfolio of business
Status report - what would and technology solutions, enabling improved business performance for clients worldwide leveraging on its deep domain
happen if the cable had a failure expertise in location intelligence space.
or break?
In short span of time, Company has created a distinct niche for itself, making the company a preferred business partner for
many of the key customers across the globe.
It has extensive domain expertise across multi verticals like Telecom, BFSI, FMCG/Retail, Energy and Utilities, Government
& Defense, Life sciences & Healthcare, Automotive. It represents global leaders in Geospatial industry such as Google and
Pitney Bowes.
Company is an ISO 9001:2008 (QMS) company driven by commitment to highest standards in product quality and
processes.
Contact
XXXXXXXXXXXXXXXXXXXXXXXXX
XXXXXXXXXXX](https://image.slidesharecdn.com/prodbrochure-121214012336-phpapp01/85/Prod-brochure-2-320.jpg)

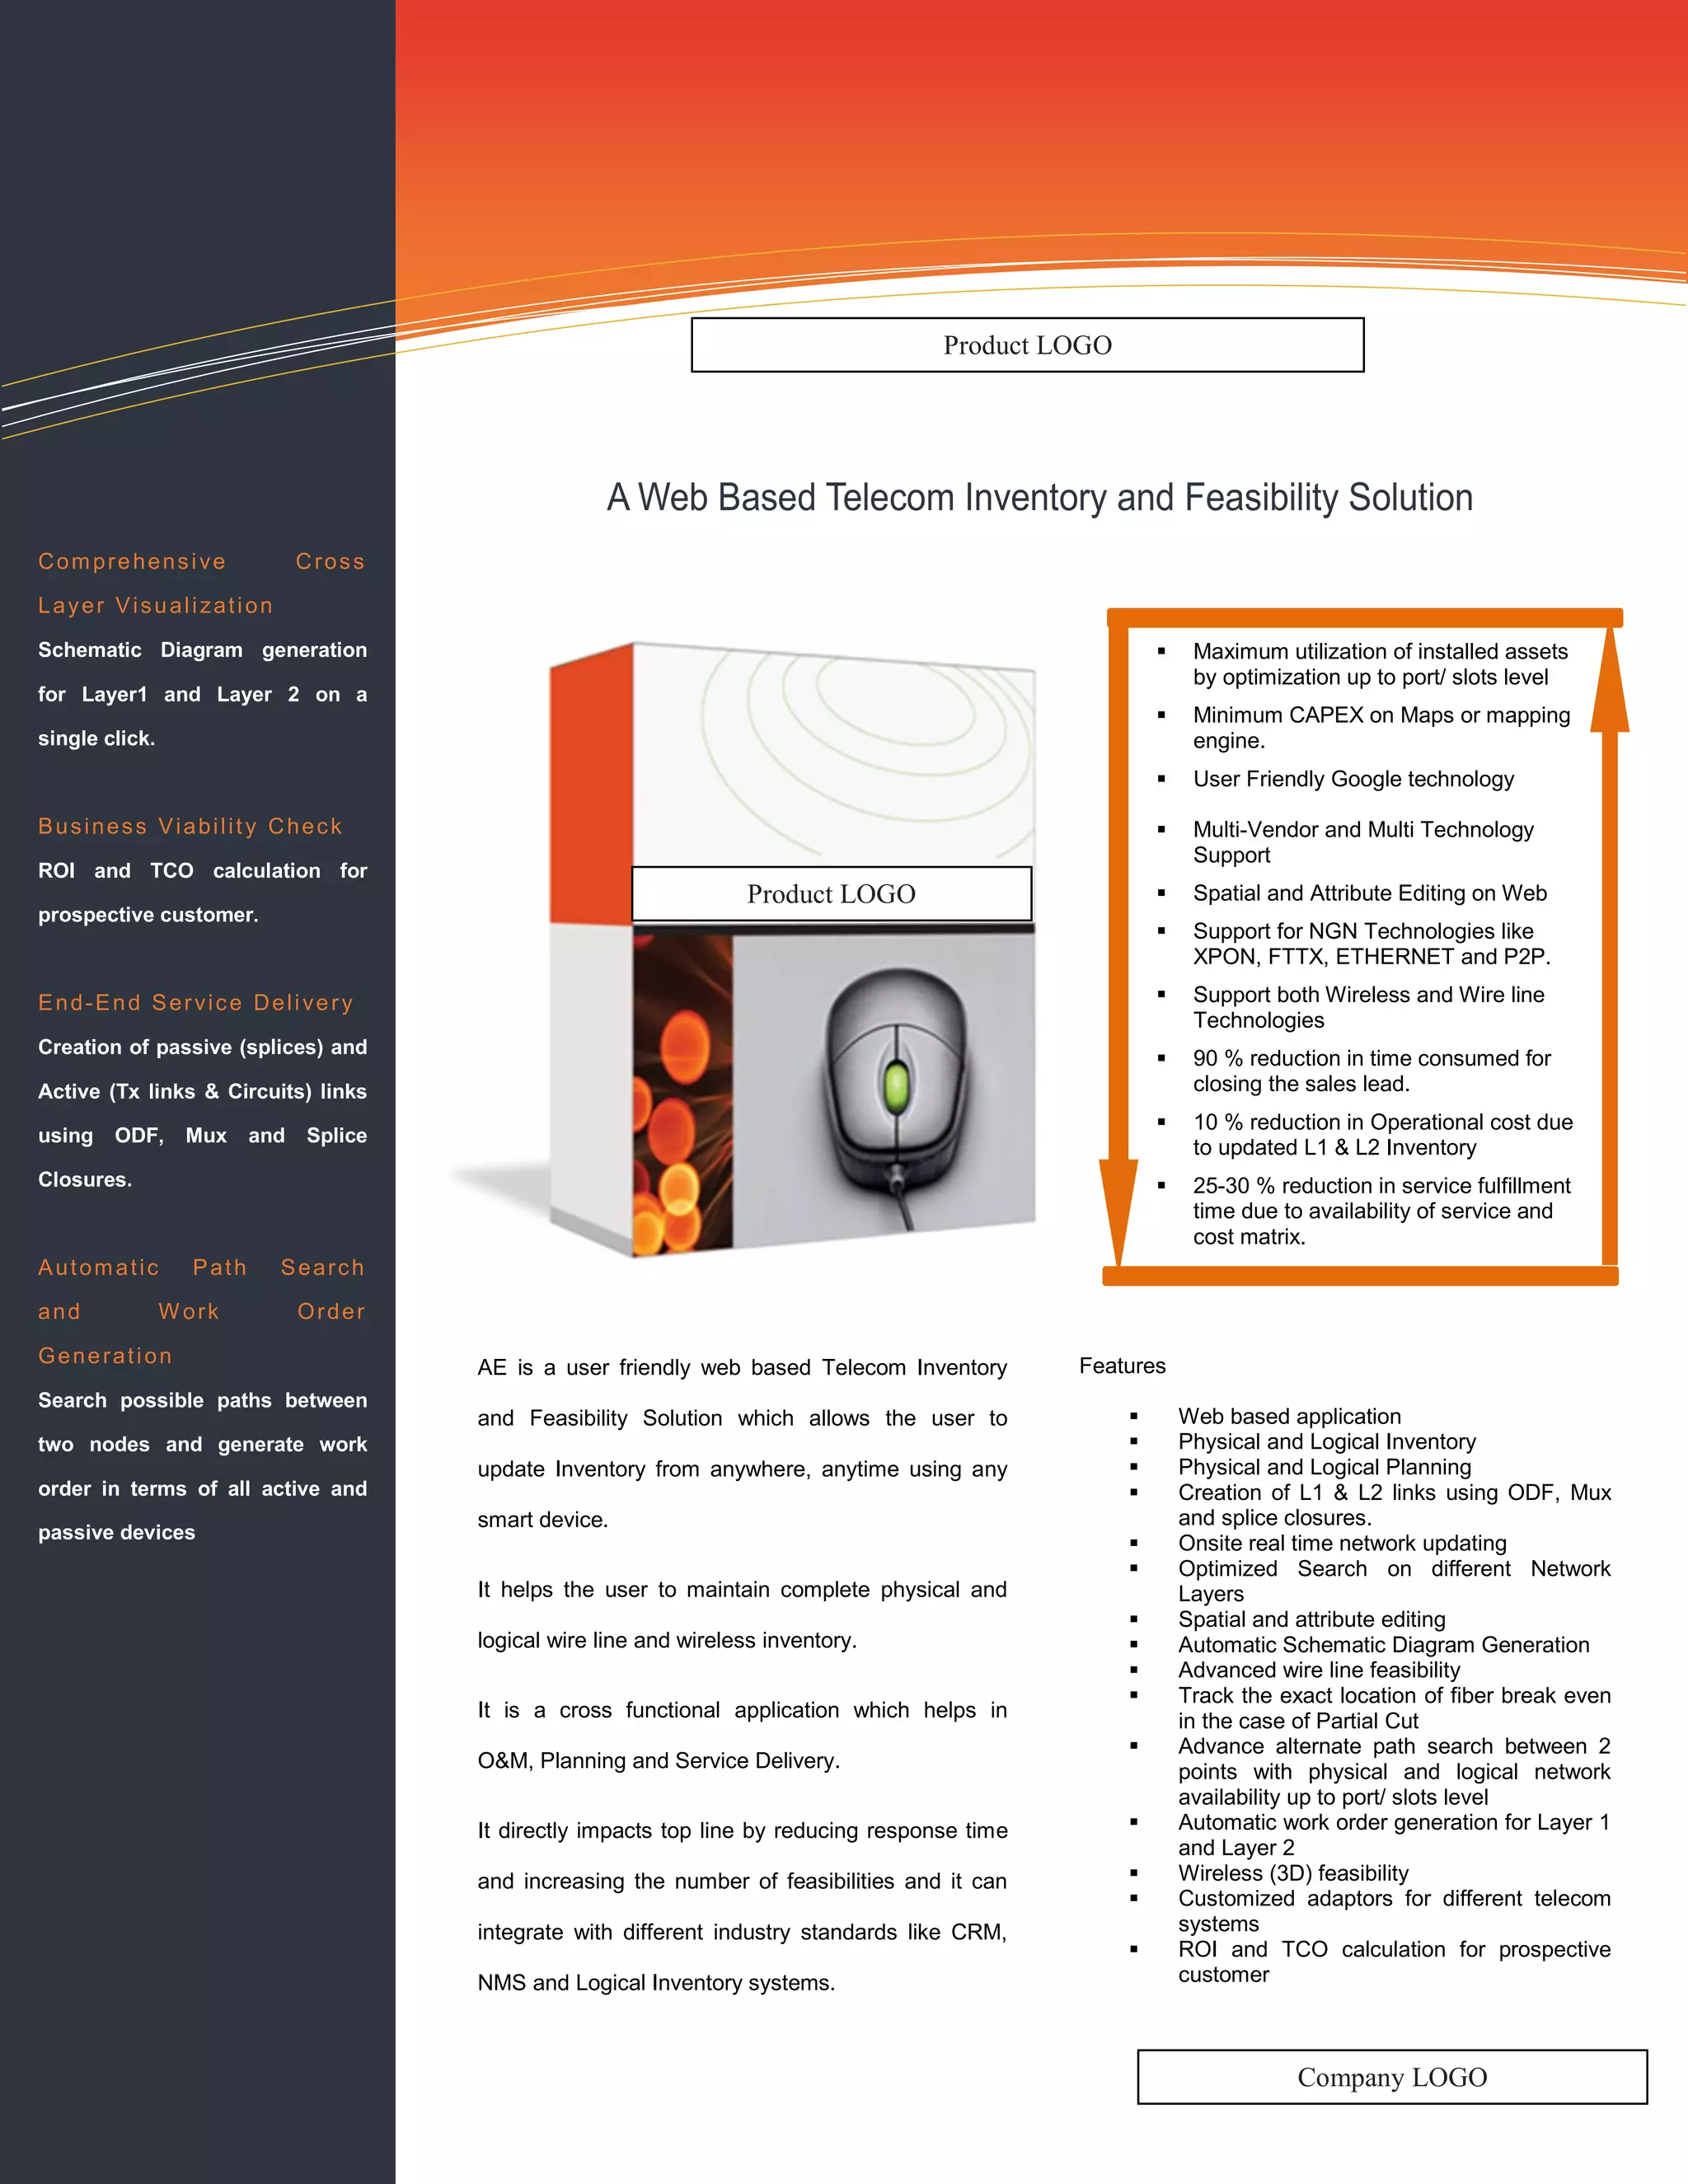
This document describes a web-based telecom inventory and feasibility solution called AE. AE allows users to update inventory from any device, maintain complete physical and logical wireline and wireless networks. It helps with operations and maintenance, planning, and service delivery. AE directly impacts revenue by reducing response times and increasing feasibility studies. It integrates with CRM, NMS, and logical inventory systems.


