Download as PDF, PPTX


![Understand, share, explain
Semantic DMN 17
Cer. Exp.
(date)
Length
(m)
Draft
(m)
Capacity
(TEU)
Cargo
(mg/cm2)
0 0 0 0 0
Enter
y, n
Ship Clearance
today
> today < 260 < 10 < 1000
> today < 260 < 10 1000
> today < 260 [10,12] < 4000 0.75
> today < 260 [10,12] < 4000 > 0.75
> today [260,320) (10,13] < 6000 0.5
> today [260,320) (10,13] < 6000 > 0.5
> today [320,400) 13 > 4000 0.25
> today [320,400) 13 > 4000 > 0.25
n
y
n
y
n
y
n
y
n
Table 1: DMN representation of the ship clearance decision of Figure 1b
Enter Length
(m)
Cargo
(mg/cm2)
y,n 0 0
Refuel Area
none, indoor, outdoor
U
Refuel area determination
n
y 350
y > 350 0.3
y > 350 > 0.3
none
indoor
indoor
outdoor
1
2
3
4
Ship
id-code
name
Certificate
exp-date
Harbor
location
Attempt
when
outcome
tried entering into
owns
1
0..1
* *
receive
entrance request
record
ship info
inspect ship
ship id
acquire
certificate
record
cargo
residuals
record
exp. date
cargo residuals
certificate exp. date
decice
clearance
enter
refuel area
enter?
send
refusal
send
fuel area info
open
dock
N
Y
ship type (short name)](https://image.slidesharecdn.com/fit-for-digital-2019-montali-191031155445/75/Processes-and-organizations-a-look-behind-the-paper-wall-8-2048.jpg)
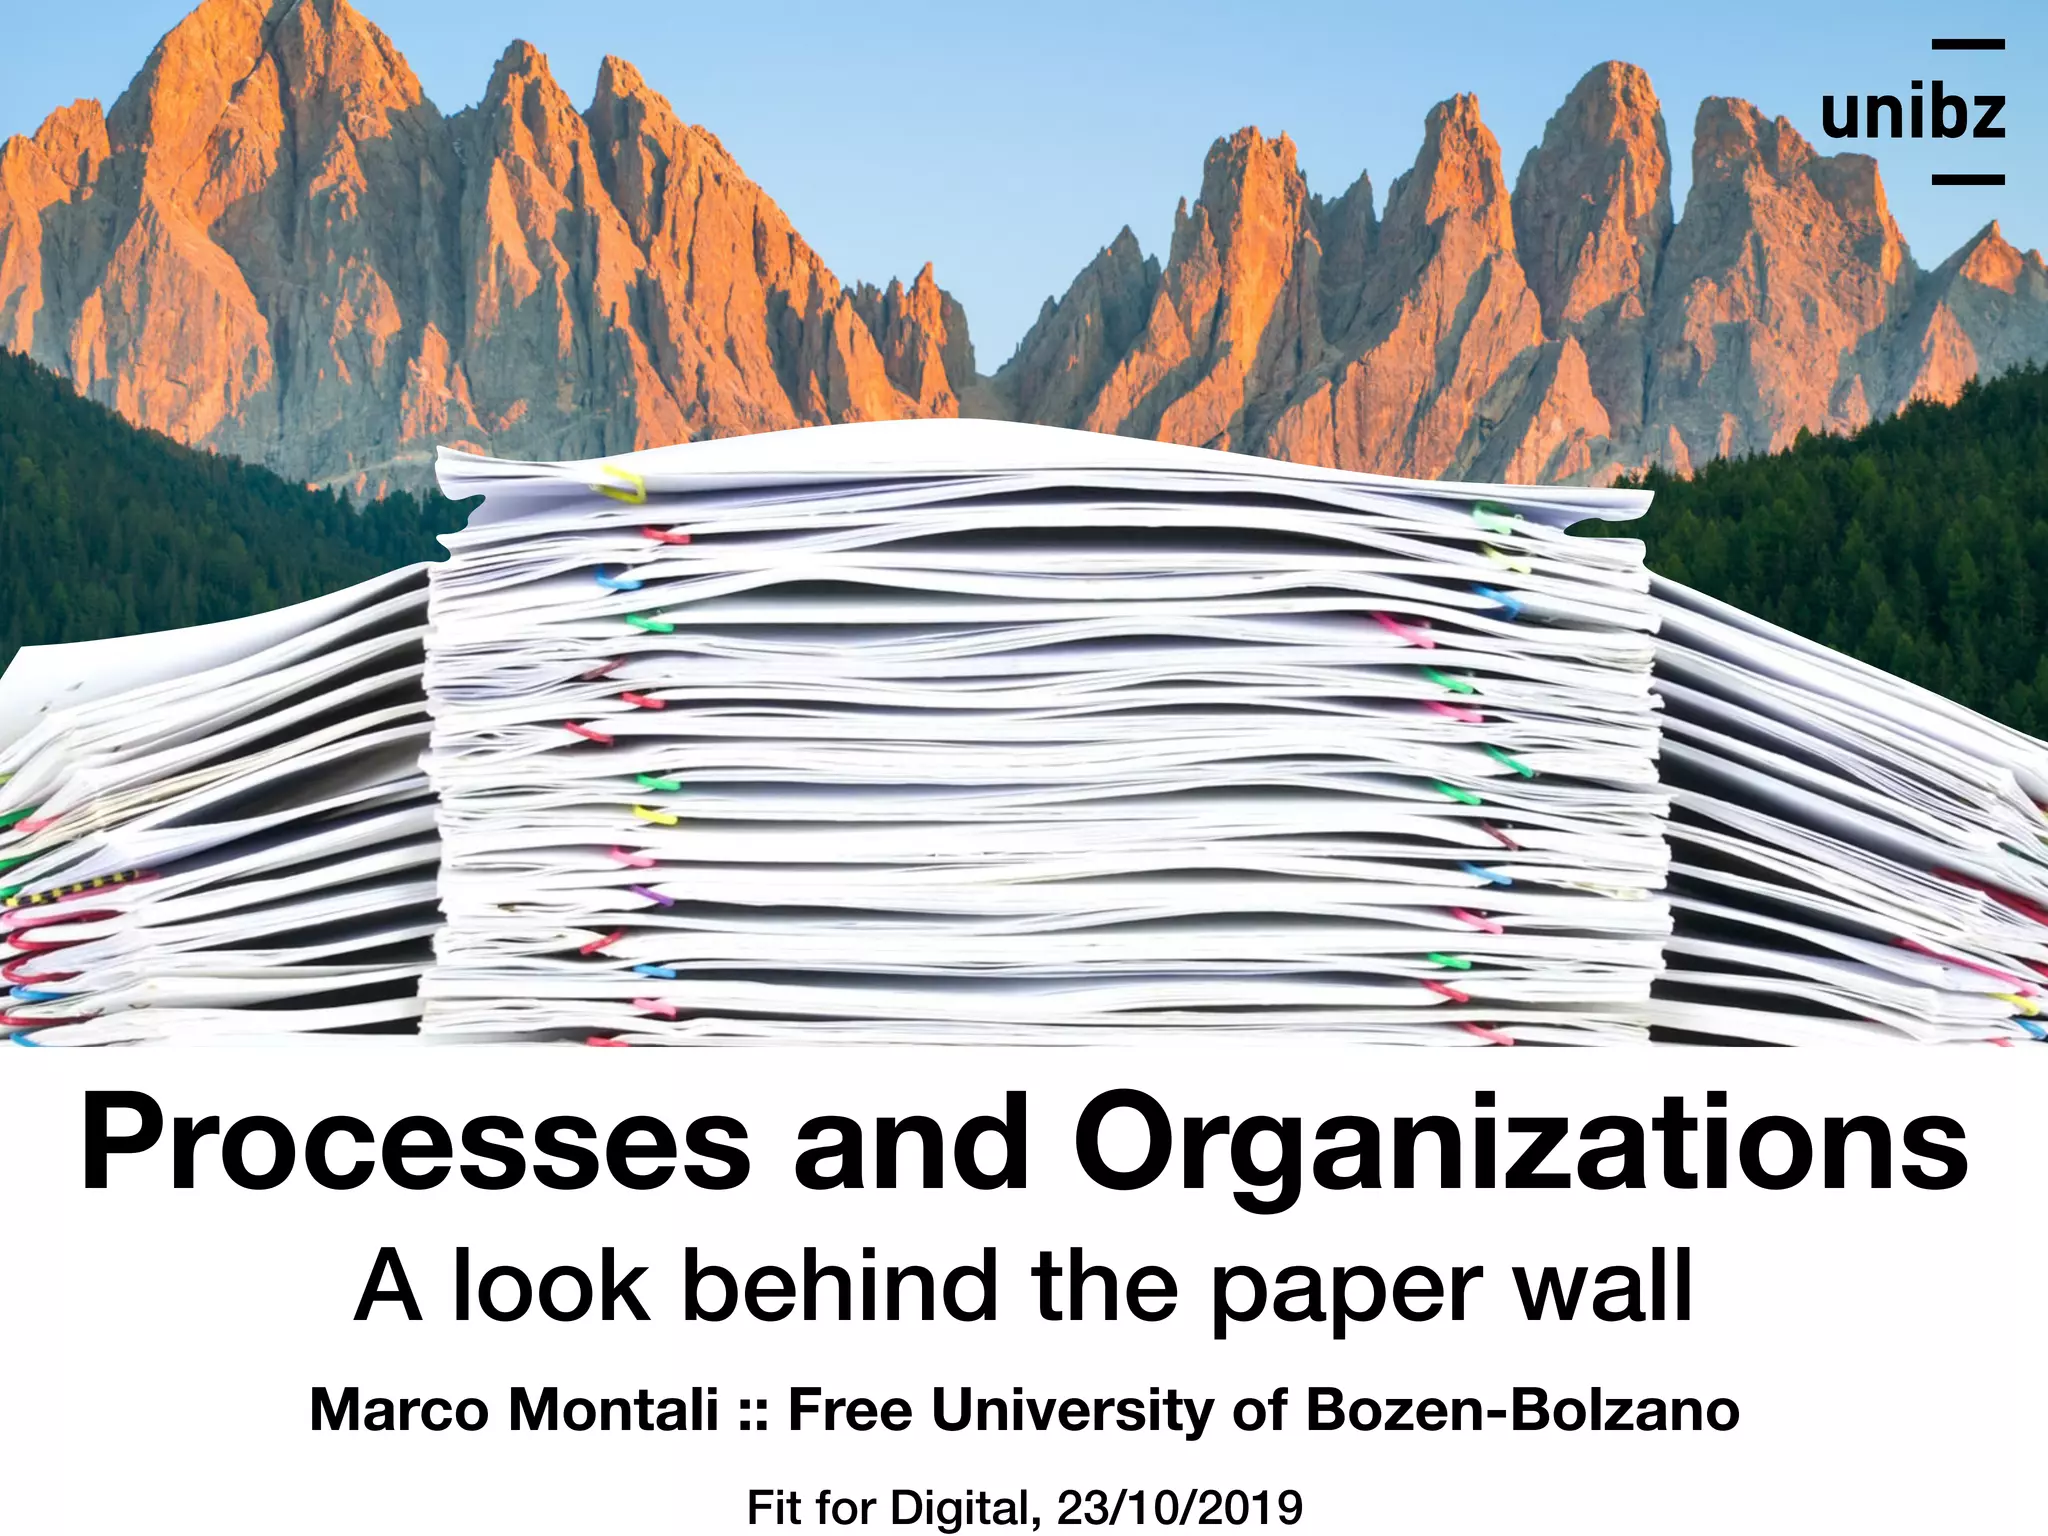
![Understand, share, explain
receive
entrance request
record
ship info
inspect ship
ship id
acquire
certificate
record
cargo
residuals
record
exp. date
cargo residuals
certificate exp. date
decice
clearance
enter
refuel area
enter?
send
refusal
send
fuel area info
open
dock
N
Y
ship type (short name)
Semantic DMN 17
Cer. Exp.
(date)
Length
(m)
Draft
(m)
Capacity
(TEU)
Cargo
(mg/cm2)
0 0 0 0 0
Enter
y, n
Ship Clearance
today
> today < 260 < 10 < 1000
> today < 260 < 10 1000
> today < 260 [10,12] < 4000 0.75
> today < 260 [10,12] < 4000 > 0.75
> today [260,320) (10,13] < 6000 0.5
> today [260,320) (10,13] < 6000 > 0.5
> today [320,400) 13 > 4000 0.25
> today [320,400) 13 > 4000 > 0.25
n
y
n
y
n
y
n
y
n
Table 1: DMN representation of the ship clearance decision of Figure 1b
Enter Length
(m)
Cargo
(mg/cm2)
y,n 0 0
Refuel Area
none, indoor, outdoor
U
Refuel area determination
n
y 350
y > 350 0.3
y > 350 > 0.3
none
indoor
indoor
outdoor
1
2
3
4
Ship
id-code
name
Certificate
exp-date
Harbor
location
Attempt
when
outcome
tried entering into
owns
1
0..1
* *
internal members
(management, IT, domain experts)
external stakeholders
(customers, citizens, auditors)
digital agents
(applications, robots, …)](https://image.slidesharecdn.com/fit-for-digital-2019-montali-191031155445/75/Processes-and-organizations-a-look-behind-the-paper-wall-9-2048.jpg)


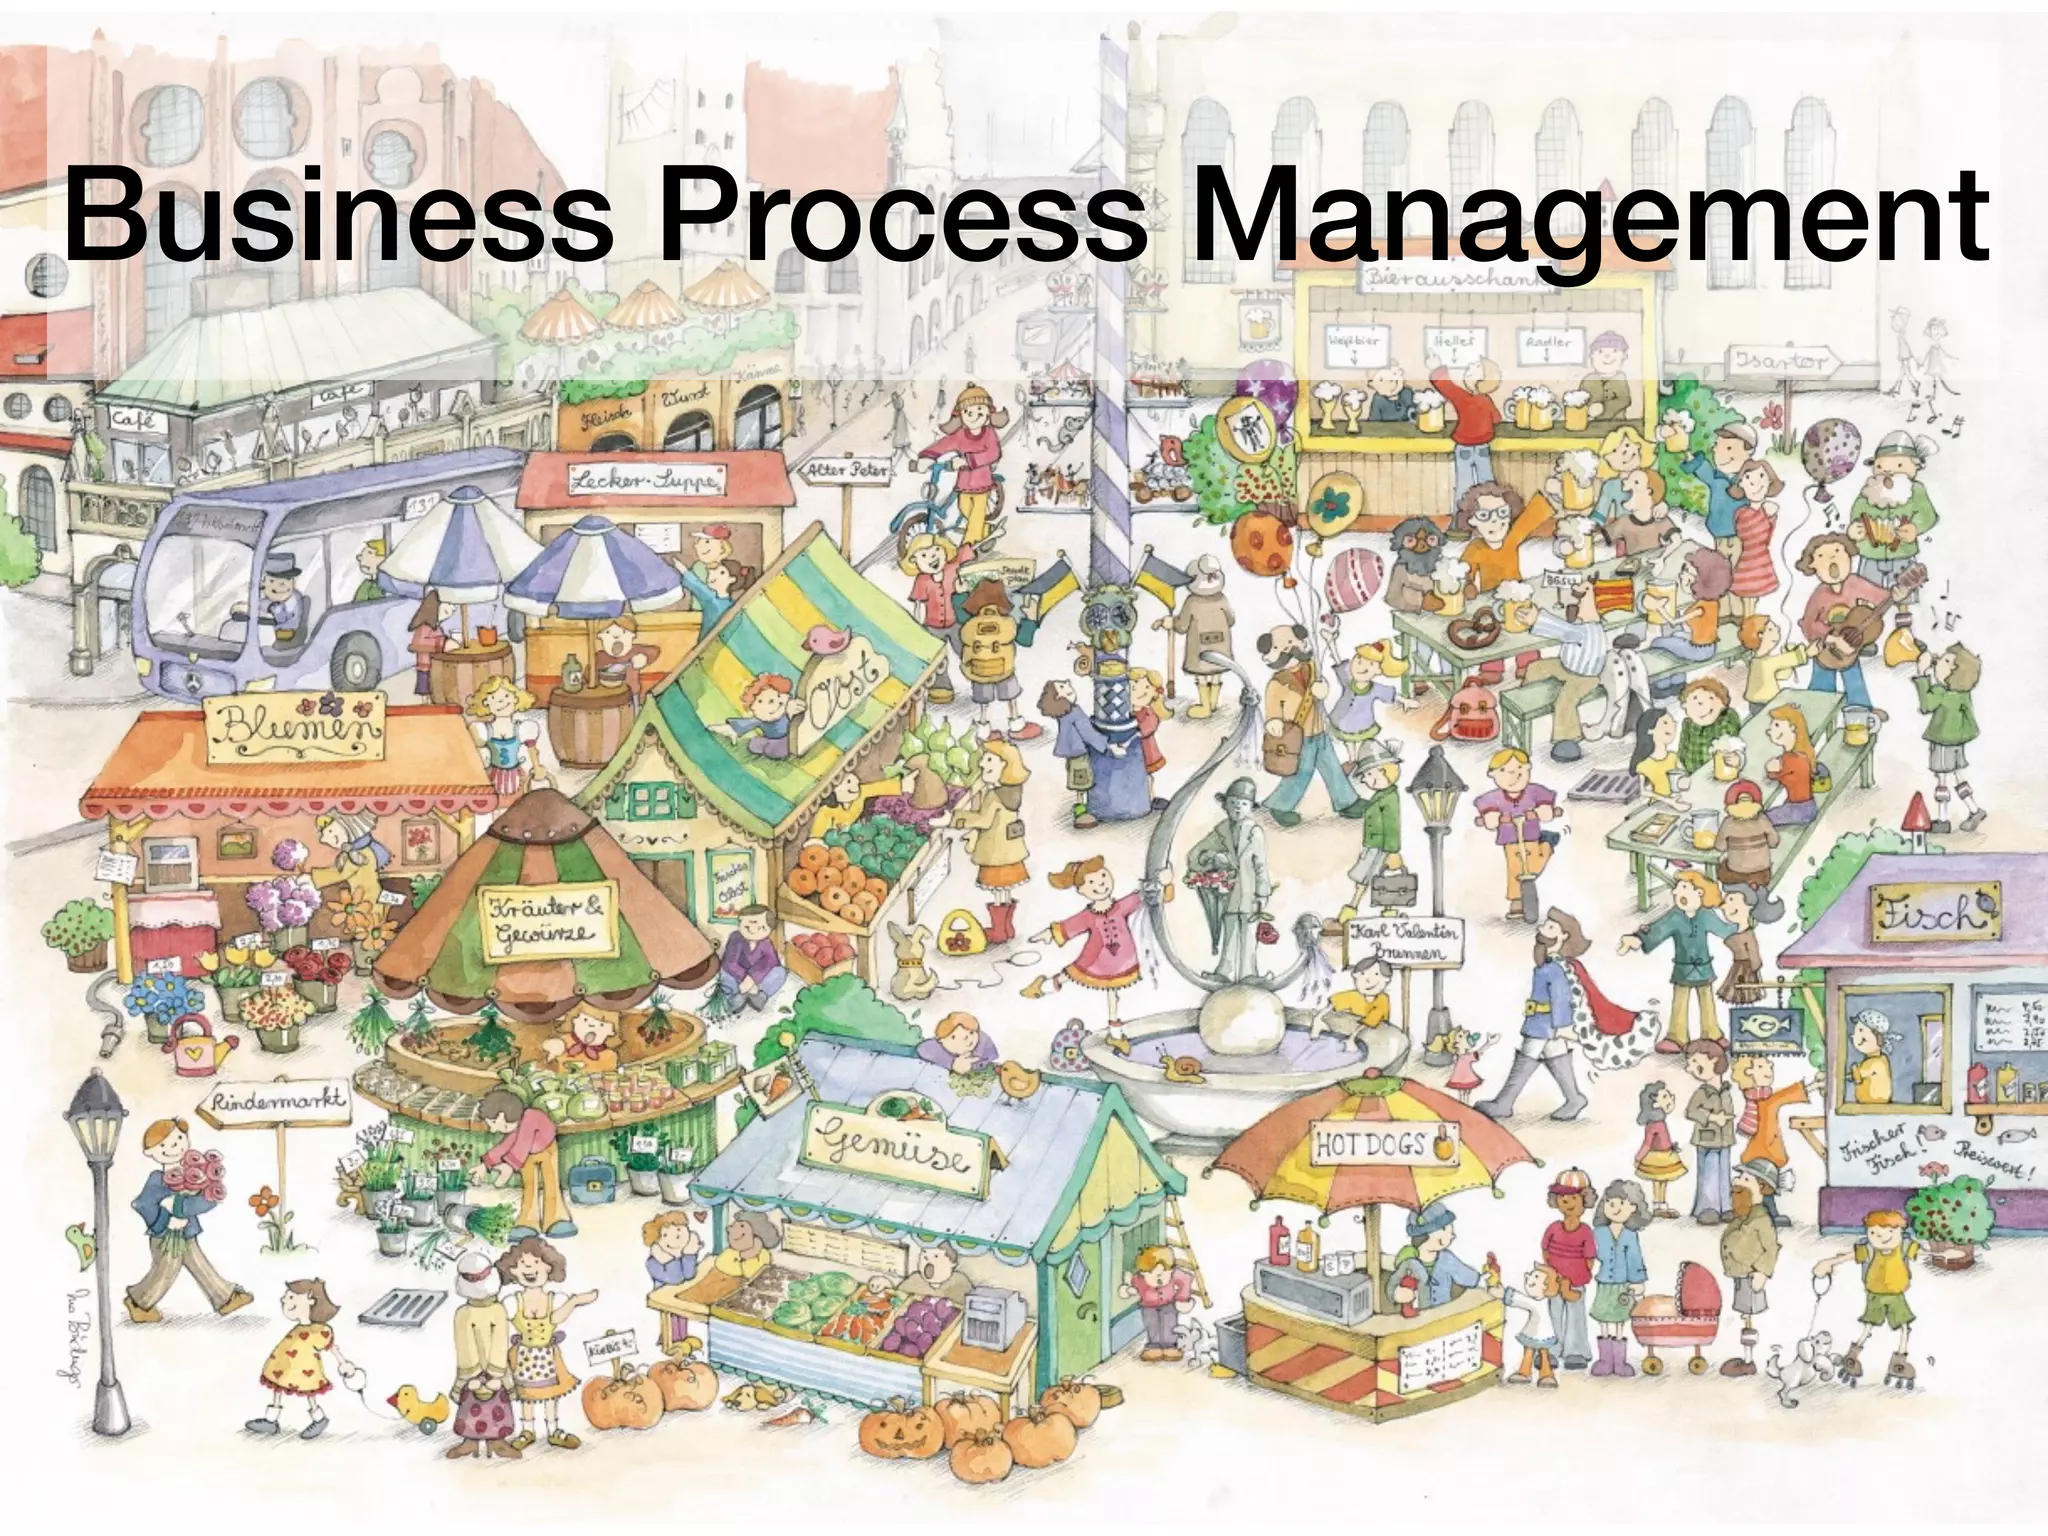
![Dutch Municipalities28 Ube van der Ham
[van der Ham, BPI Challenge 2015]](https://image.slidesharecdn.com/fit-for-digital-2019-montali-191031155445/75/Processes-and-organizations-a-look-behind-the-paper-wall-25-2048.jpg)
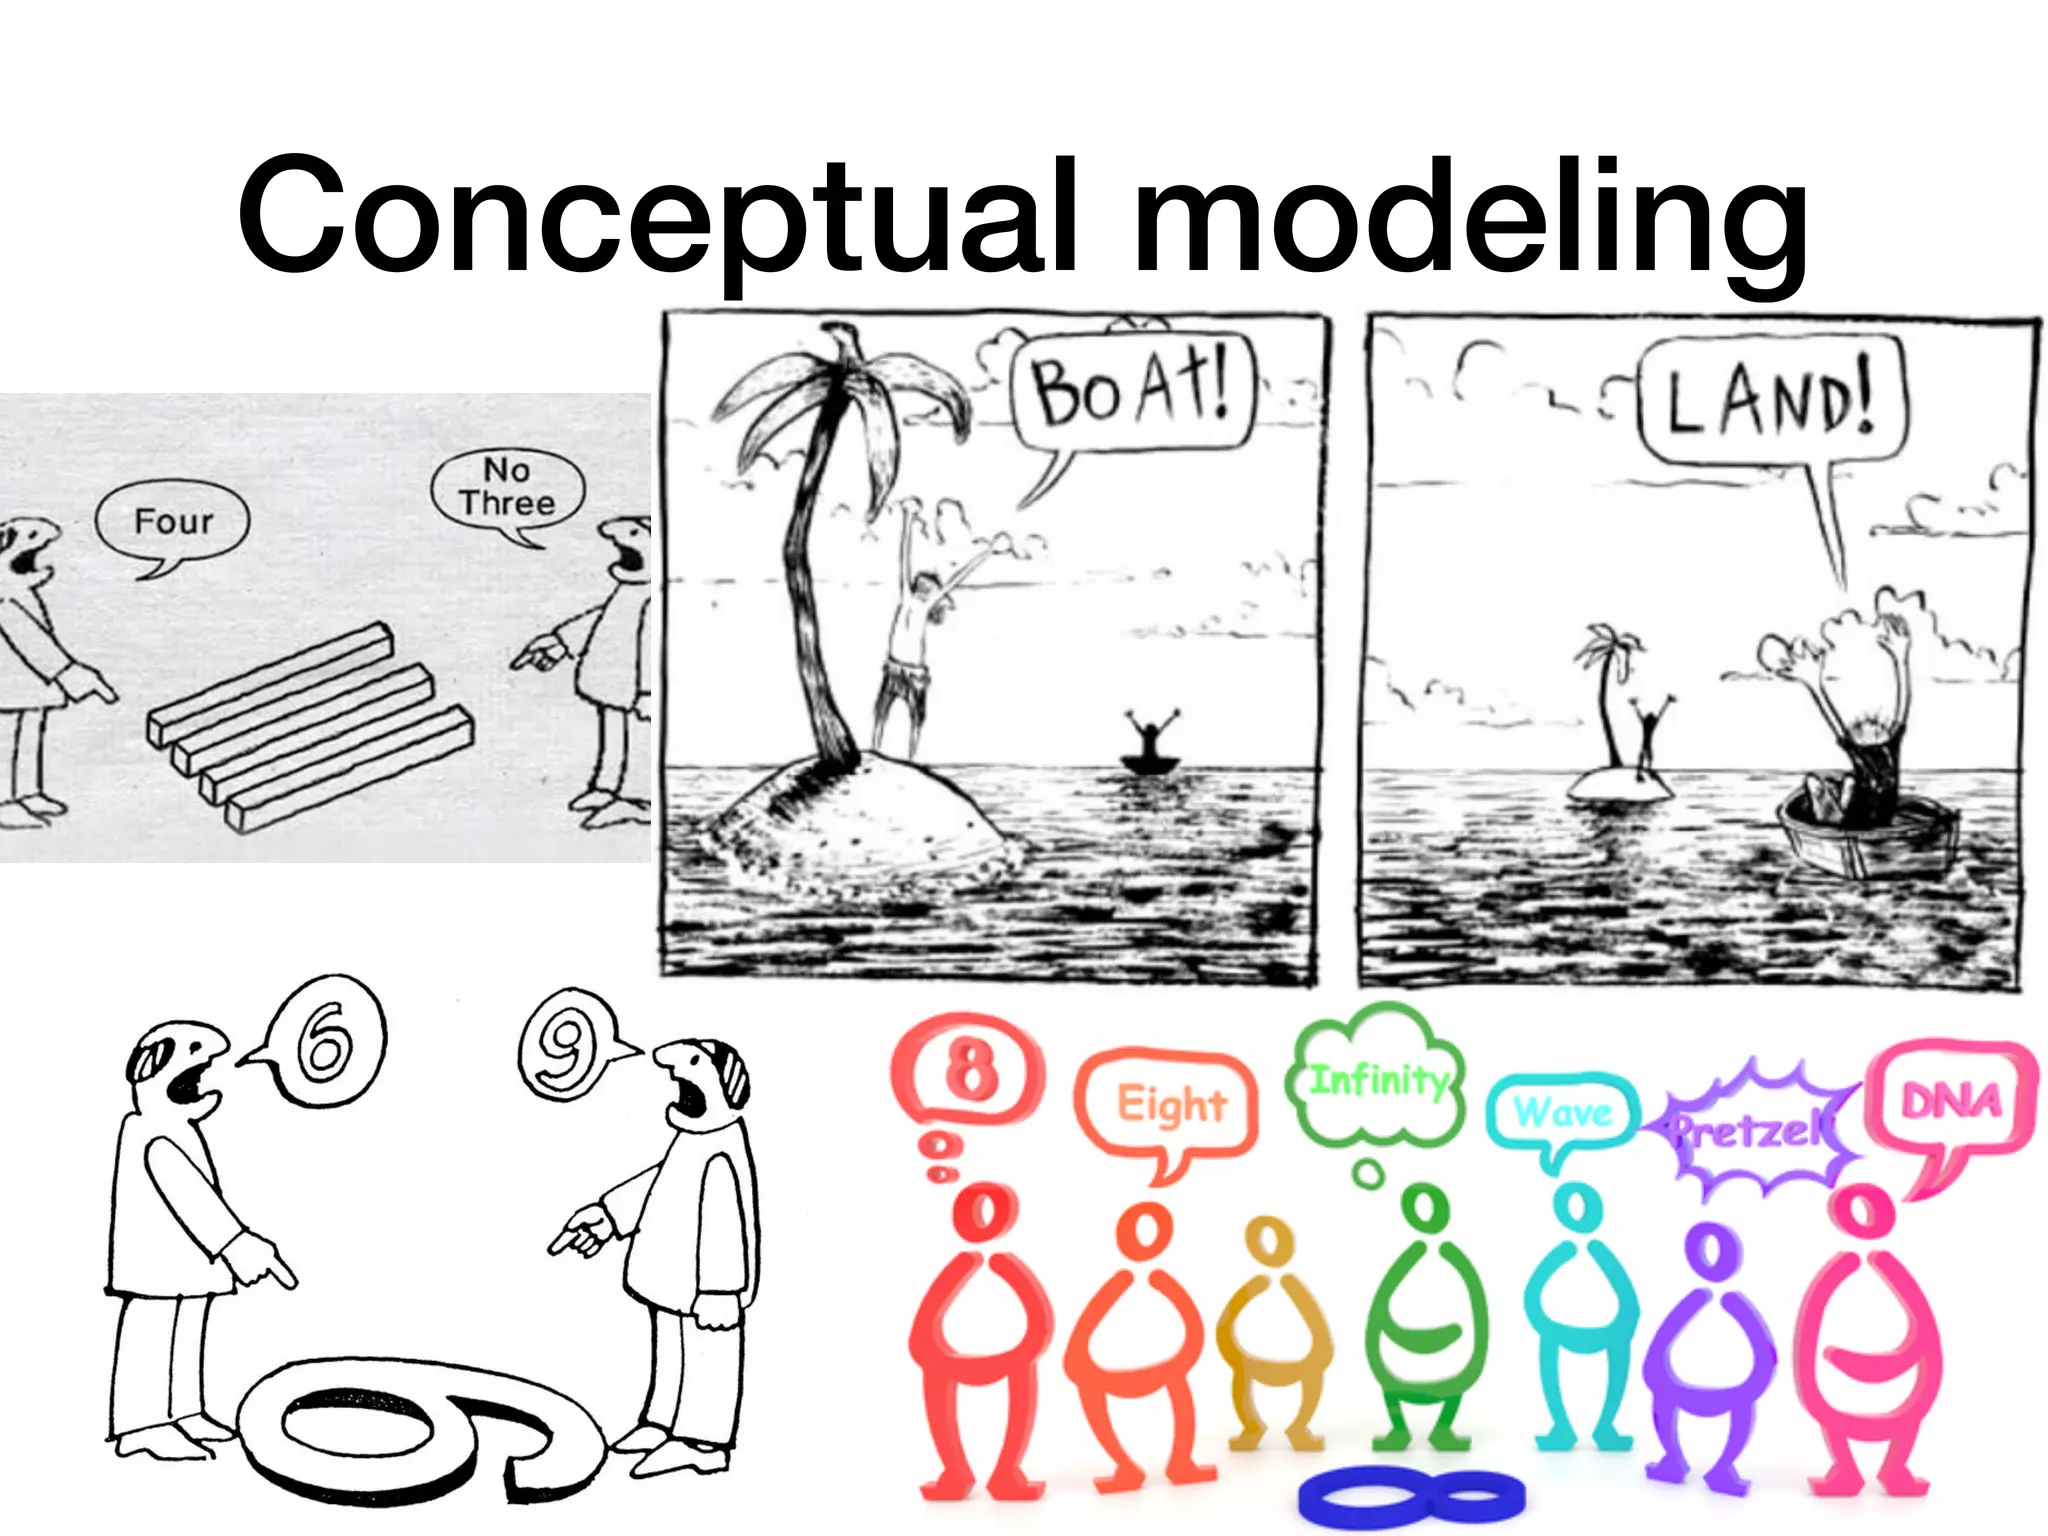
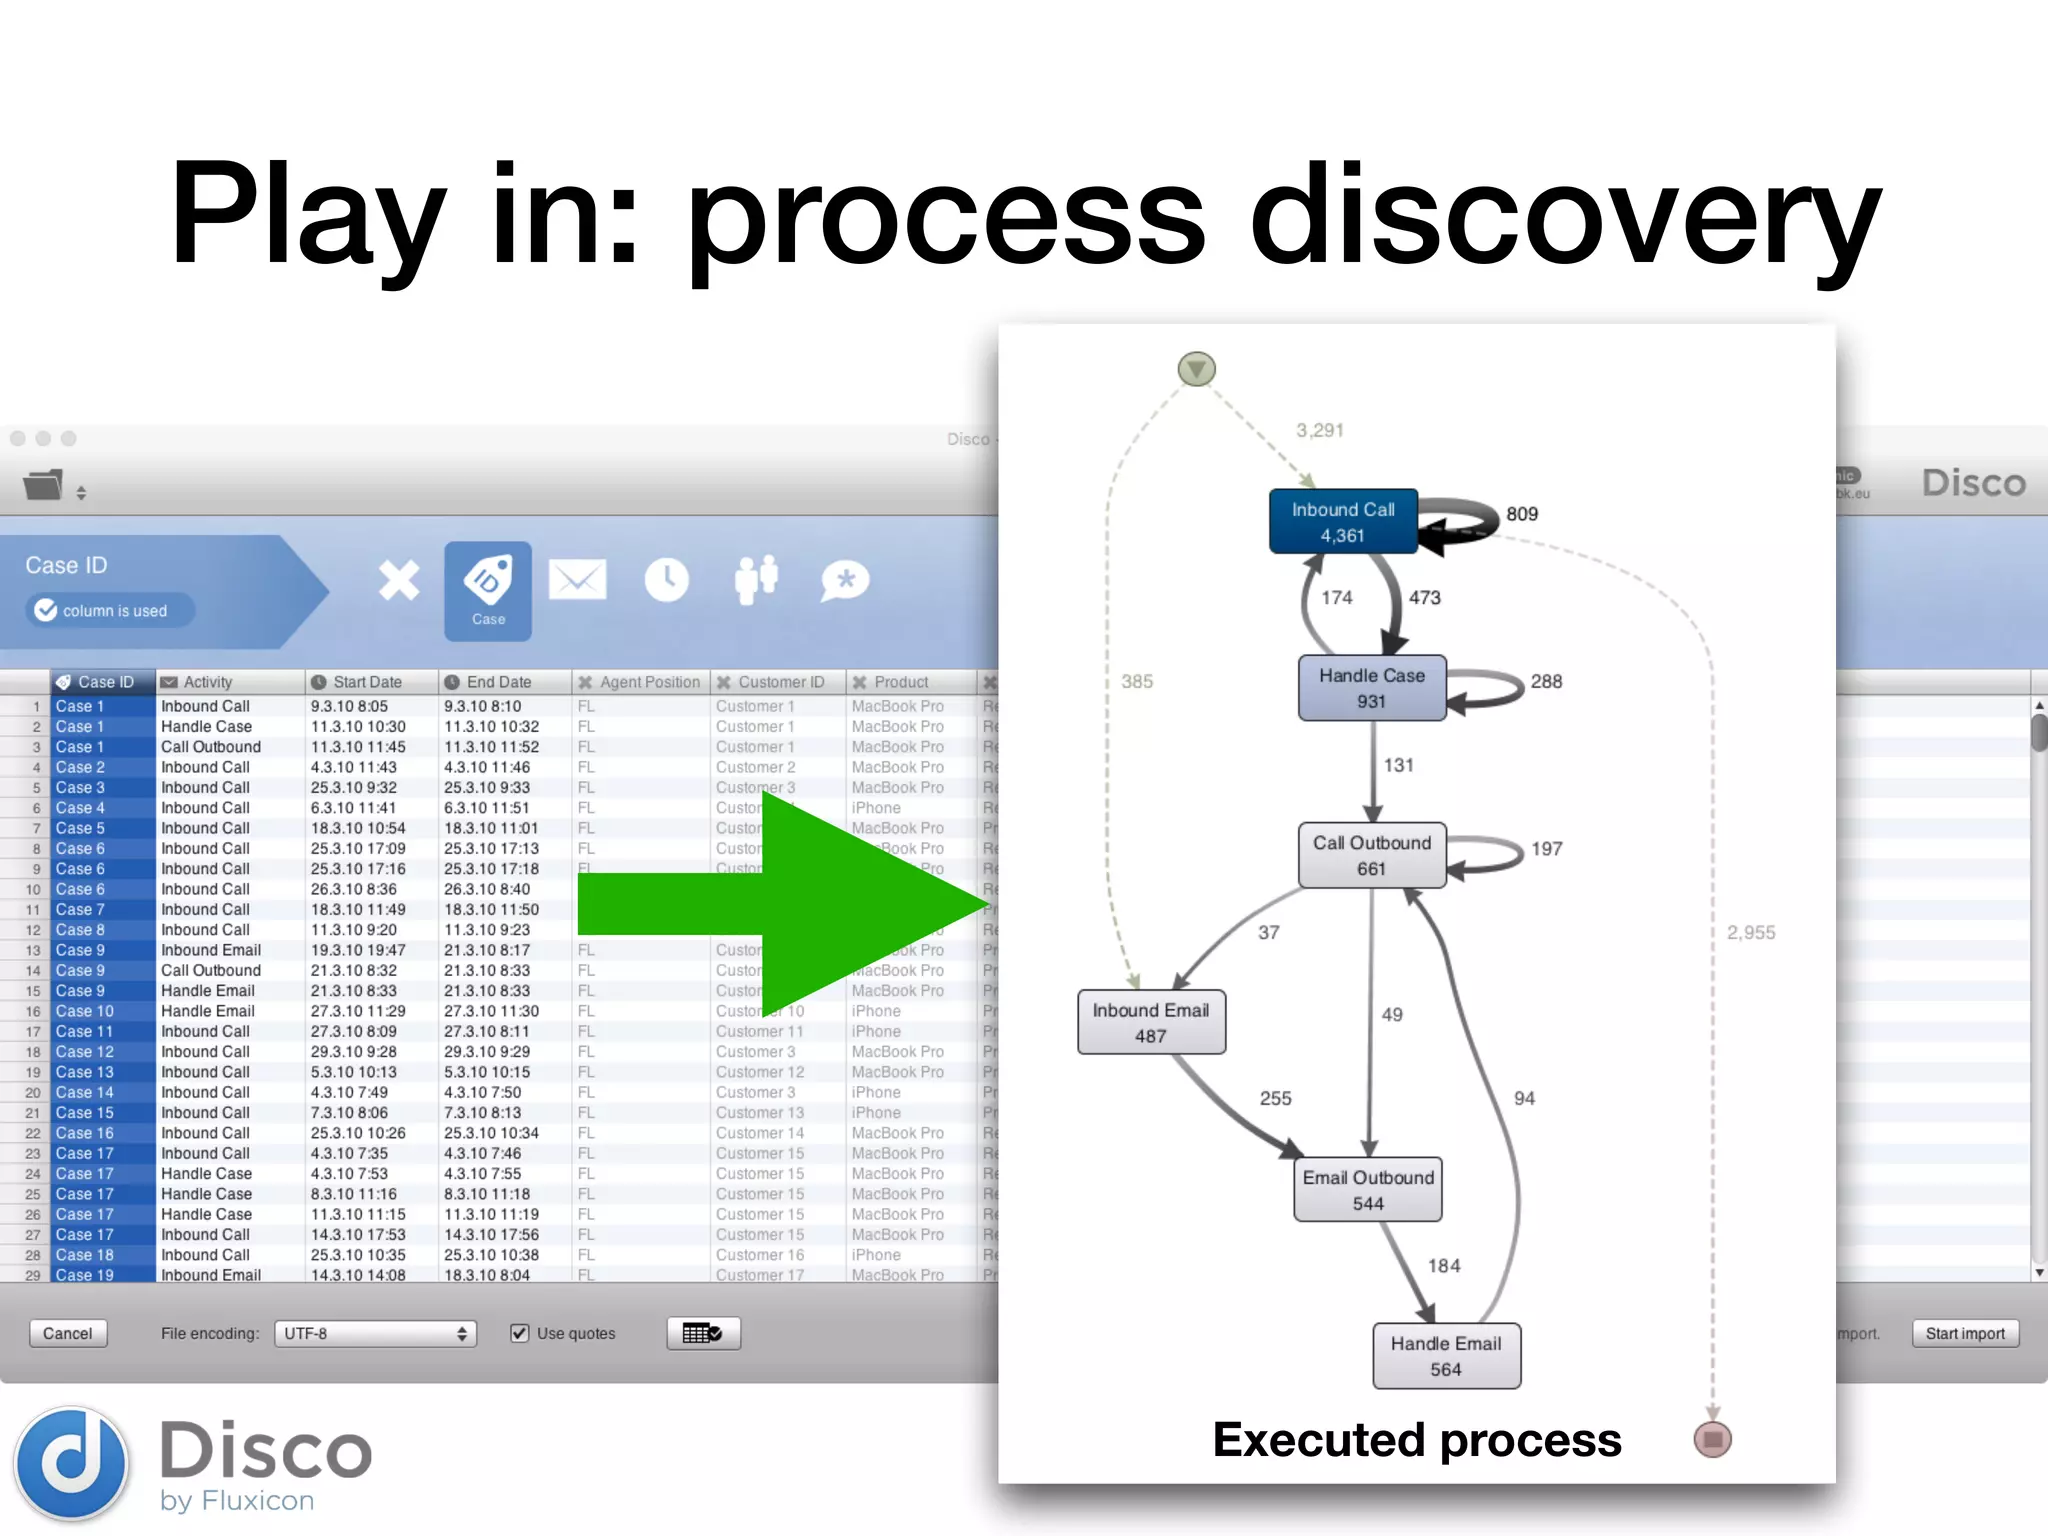
![Dutch Municipalities28 Ube van der Ham
Although the processes are centrally designed, several differences are visible that
make the difference in speed and objections very clear. We will focus on MuniC
versus MuniB and MuniD, because the difference in performance is most obvious.
Fig. 5 shows the control flow for the three municipalities in Disco.
[van der Ham, BPI Challenge 2015]](https://image.slidesharecdn.com/fit-for-digital-2019-montali-191031155445/75/Processes-and-organizations-a-look-behind-the-paper-wall-26-2048.jpg)

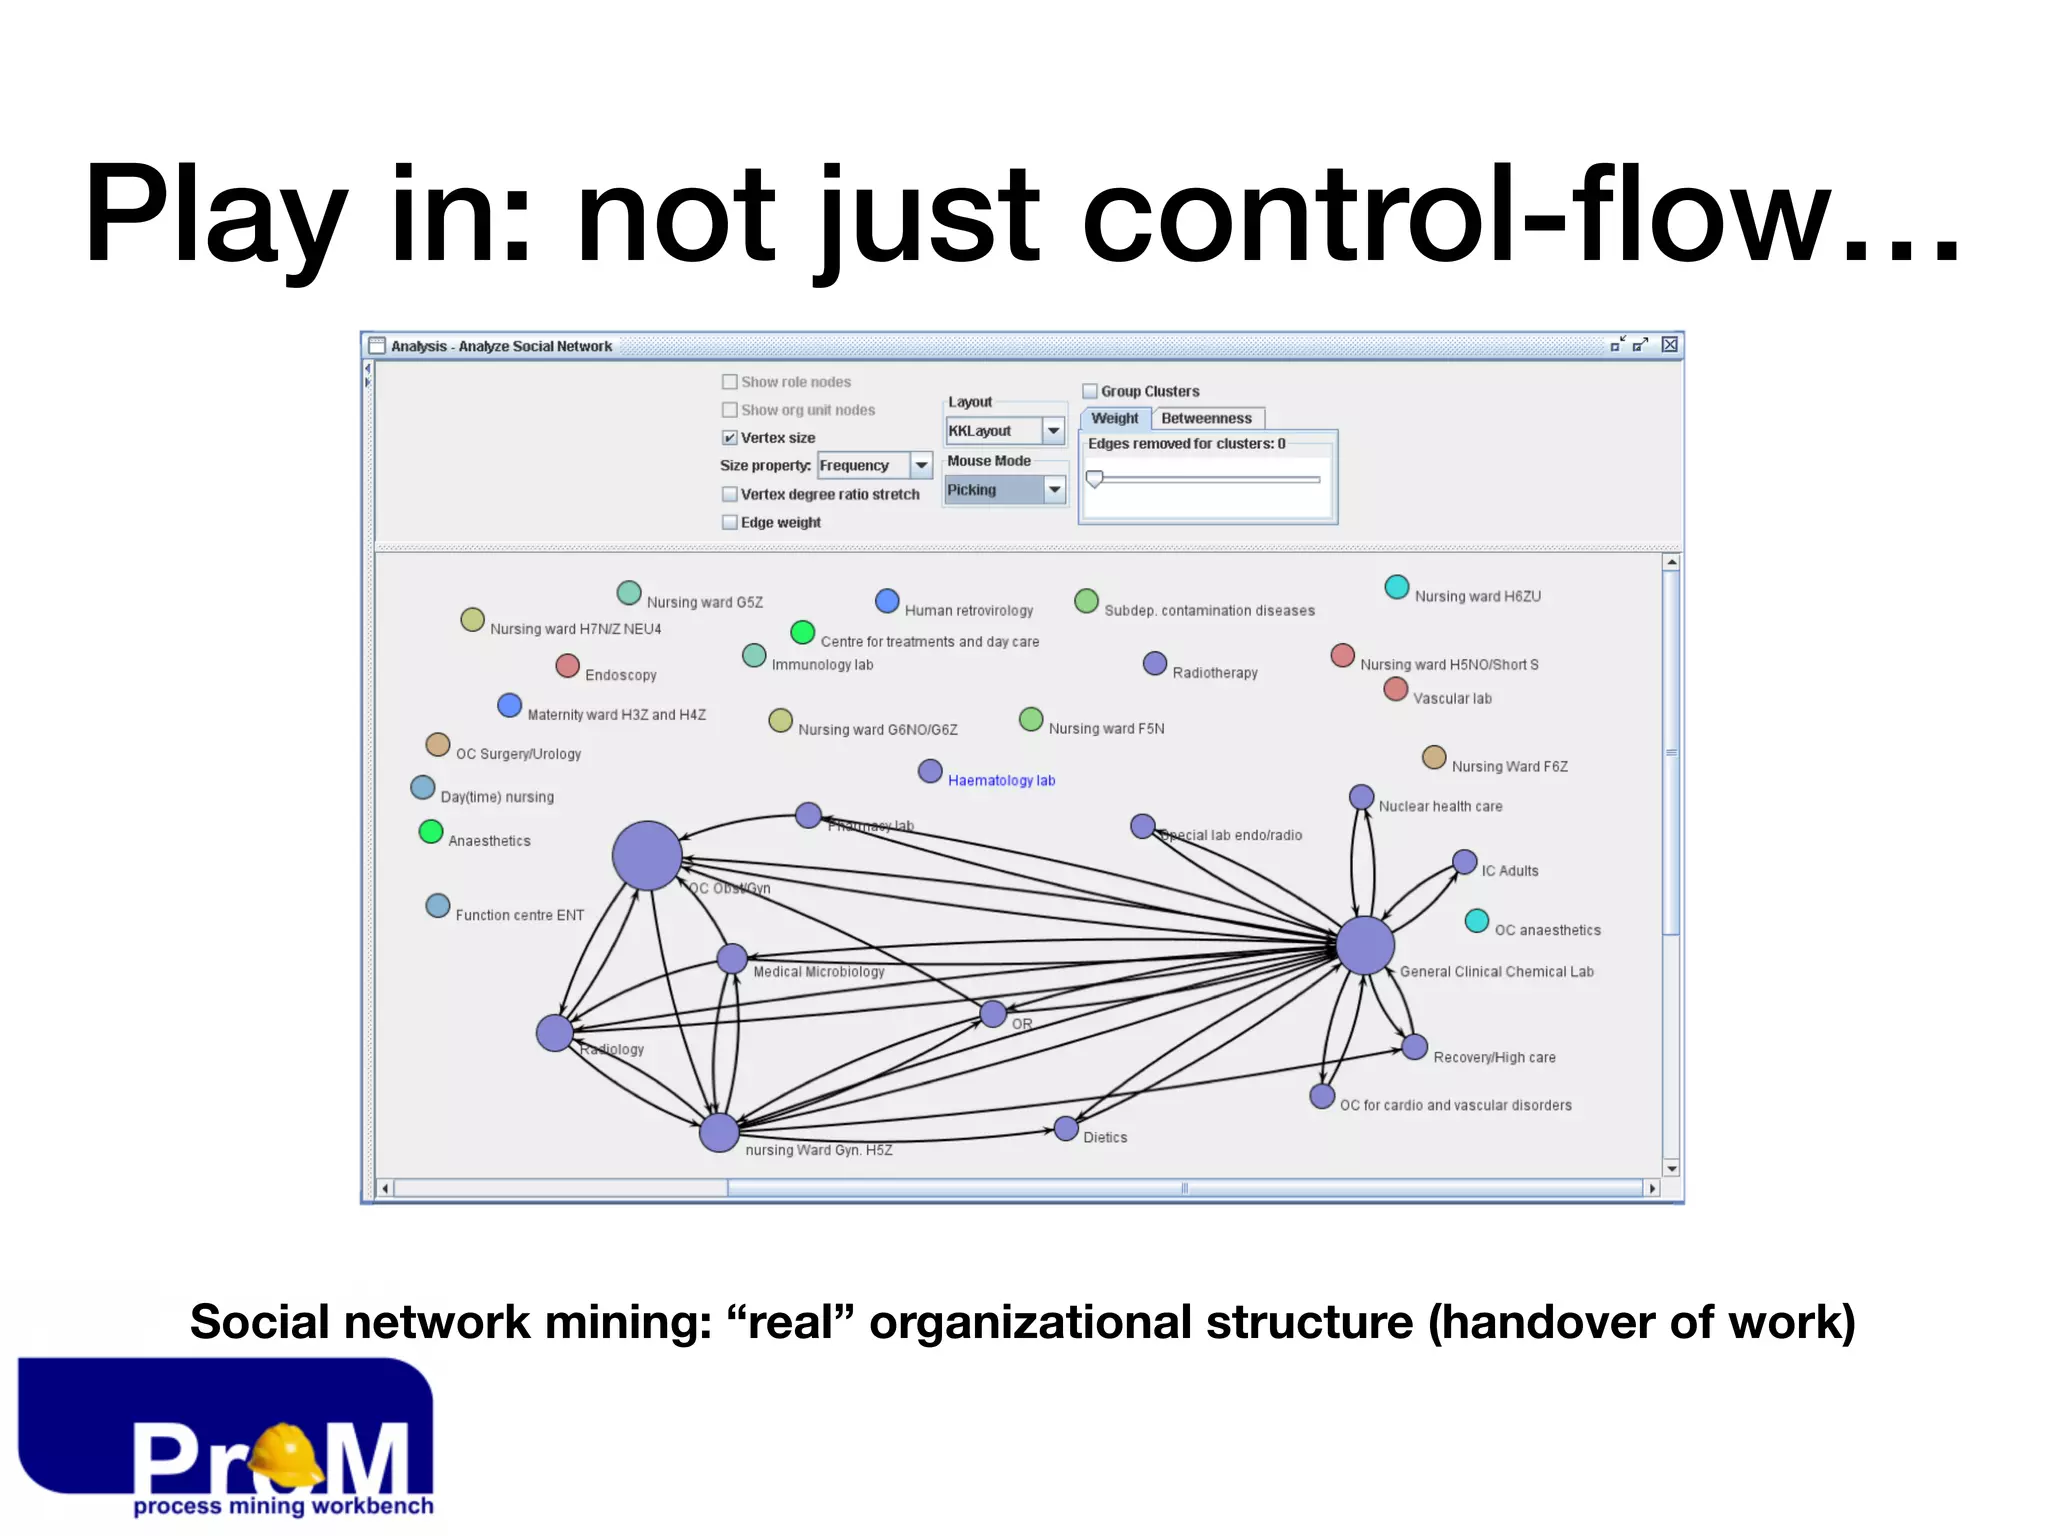


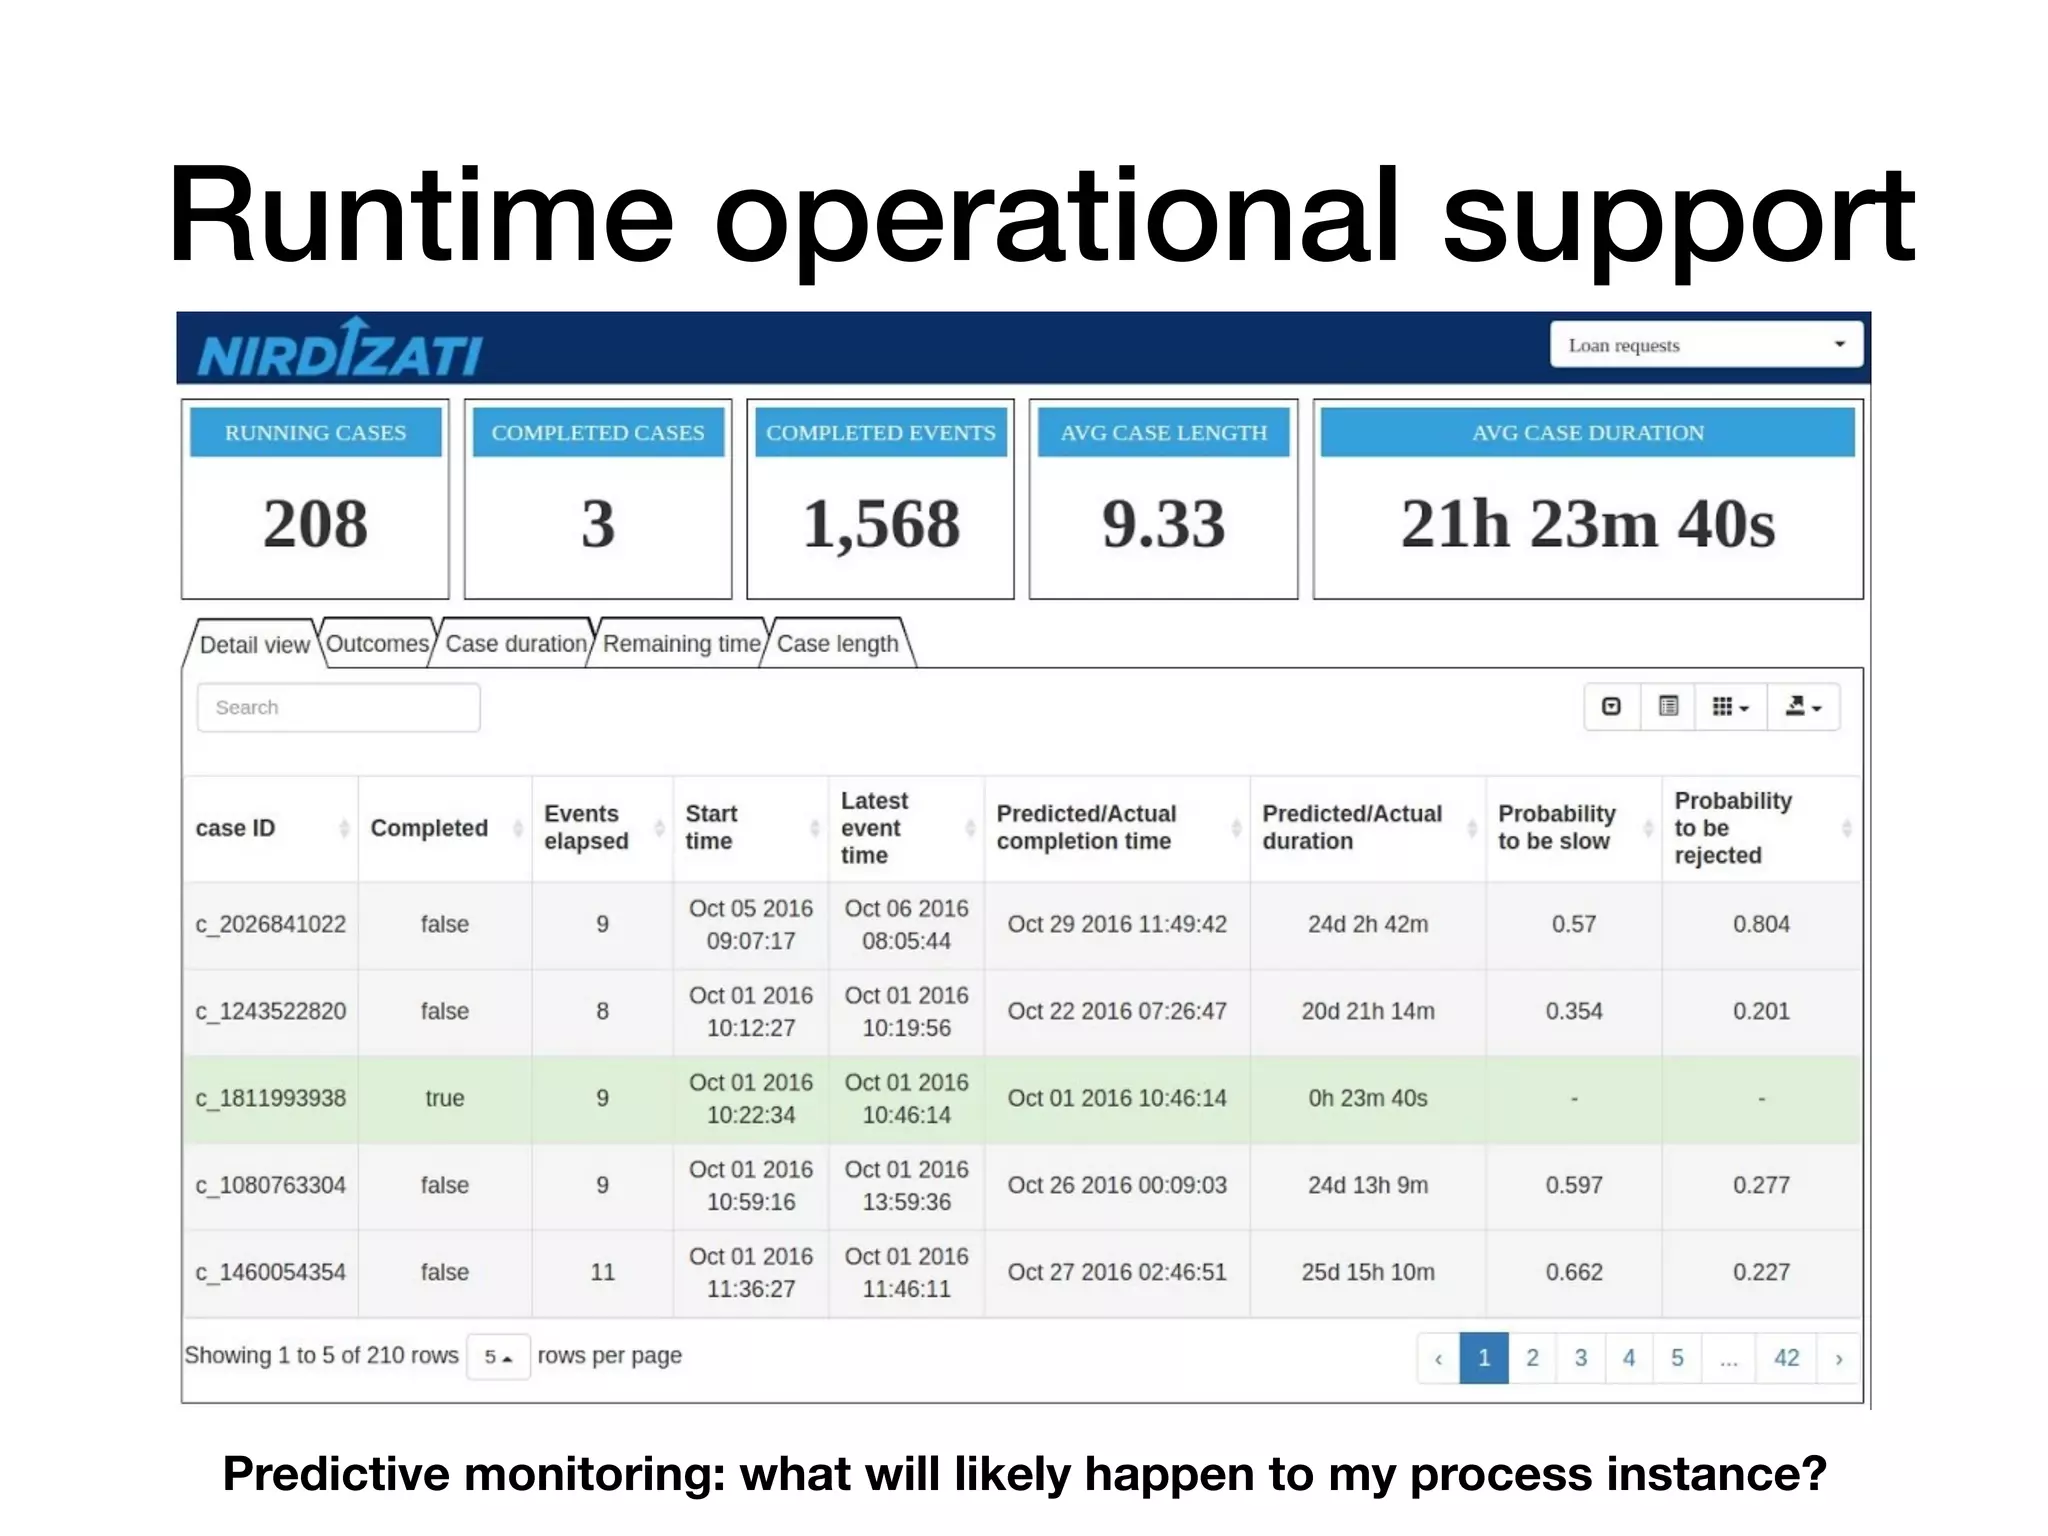

1) The document discusses business process management and how conceptual modeling and process mining can help understand and improve digital enterprises. 2) Process mining techniques like process discovery from event logs, decision mining, and social network mining can provide insights into how processes are executed in reality. 3) Replay techniques can enhance process models with timing information and detect deviations to help align actual behaviors with expected behaviors.