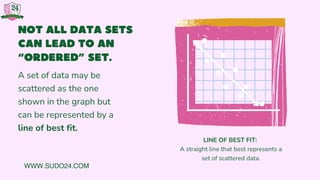
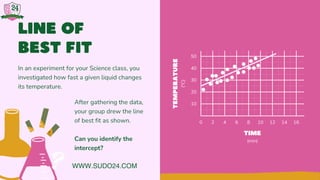
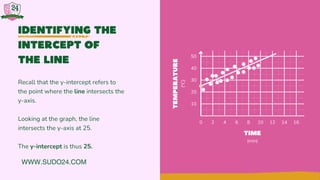
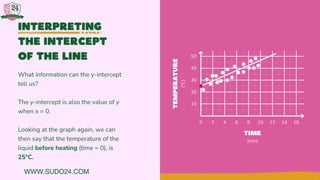
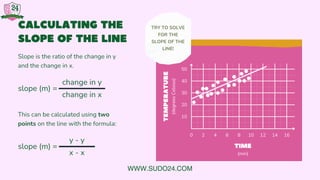
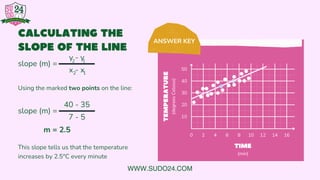
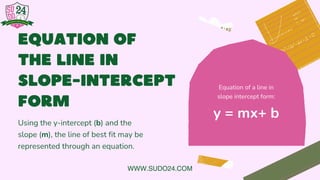
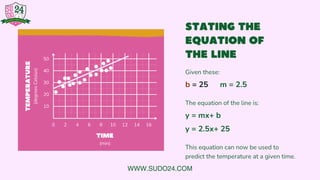
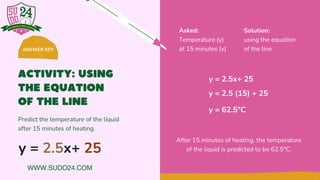
Solving word problems involving linear graphs
PROBLEM
SOLVING WITH
LINEAR MODELS
0
0
0
0
WWW.SUDO24.COM
0
LESSON
OUTLINE
Linear Models and Equations
Interpreting Linear Models
WWW.SUDO24.COM
CAN ALL DATA SETS BE
SHOWN ON A GRAPH IN
AN “ORDERLY”
MANNER?
0
WWW.SUDO24.COM
0
LEARNING
OUTCOMES
Identify and interpret the
intercept of a linear model.
Intercept:
the point where the line
intersects the y-axis
Slope:
the ratio of change in y to
change in x between two
points in a line
Calculate and interpret the
slope of a linear model.
State the equation of the line
in slope-intercept form.
WWW.SUDO24.COM
NOT ALL DATA SETS
CAN LEAD TO AN
“ORDERED” SET.
A set of data may be
scattered as the one
shown in the graph but
can be represented by a
line of best fit.
LINE OF BEST FIT:
A straight line that best represents a
set of scattered data.
WWW.SUDO24.COM
0
0
0
0
LINE OF
BEST FIT
2
0
10
20
4 6 8 10 12 14 16
30
40
50
TIME
(min)
TEMPERATURE
(°C)
After gathering the data,
your group drew the line
of best fit as shown.
Can you identify the
intercept?
In an experiment for your Science class, you
investigated how fast a given liquid changes
its temperature.
WWW.SUDO24.COM
IDENTIFYING THE
INTERCEPT OF
THE LINE
Recall that the y-intercept refers to
the point where the line intersects the
y-ax
is.
Looking at the graph, the line
intersects the y-axis at 25.
The y-intercept is thus 25.
2
0
10
20
4 6 8 10 12 14 16
30
40
50
TIME
(min)
TEMPERATURE
(°C)
WWW.SUDO24.COM
INTERPRETING
THE INTERCEPT
OF THE LINE
What information can the y-intercept
tell us?
The y-intercept is also the value of y
when x = 0.
Looking at the graph again, we can
then say that the temperature of the
liquid before heating (time = 0), is
25°C.
2
0
10
20
4 6 8 10 12 14 16
30
40
50
TIME
(min)
TEMPERATURE
(°C)
WWW.SUDO24.COM
y - y
x - x
2
2
1
1
change in y
change in x
CALCULATING THE
SLOPE OF THE LINE
Slope is the ratio of the change in y
and the change in x.
This can be calculated using two
poi
nts on the line with the formula:
slope (m) =
slope (m) =
TRY TO SOLVE
FOR THE
SLOPE OF THE
LINE!
2
0
10
20
4 6 8 10 12 14 16
30
40
50
TIME
(min)
TEMPERATURE
(degrees
Celsius)
WWW.SUDO24.COM
40 - 35
7 - 5
CALCULATING THE
SLOPE OF THE LINE
Using the marked two points on the line:
This slope tells us that the temperature
increases by 2.5°C every minute
slope (m) =
slope (m) =
m = 2.5
2
0
10
20
4 6 8 10 12 14 16
30
40
50
TIME
(min)
TEMPERATURE
(degrees
Celsius)
ANSWER KEY
y - y
x - x
2
2
1
1
WWW.SUDO24.COM
0
0
0
EQUATION OF
THE LINE IN
SLOPE-INTERCEPT
FORM
Using the y-intercept (b) and the
slope (m), the line of best fit may be
represented through an equation.
Equation of a line in
slope intercept form:
y = mx+ b
WWW.SUDO24.COM
2
0
10
20
4 6 8 10 12 14 16
30
40
50
TIME
(min)
TEMPERATURE
(degrees
Celsius)
STATING THE
EQUATION OF
THE LINE
Given these:
The equation of the line is:
This equation can now be used to
predict the temperature at a given time.
m = 2.5
y = 2.5x+ 25
b = 25
y = mx+ b
WWW.SUDO24.COM
ANSWER KEY
ACTIVITY: USING
THE EQUATION
OF THE LINE
Predict the temperature of the liquid
after 15 minutes of heating.
y = 2.5x+ 25
y = 2.5x+ 25
y = 2.5 (15) + 25
y = 62.5°C
After 15 minutes of heating, the temperature
of the liquid is predicted to be 62.5°C.
Asked:
Temperature (y)
at 15 minutes (x)
Solution:
using the equation
of the line
WWW.SUDO24.COM

Problem Solving with linear models

  • 1.
    Solving word problemsinvolving linear graphs PROBLEM SOLVING WITH LINEAR MODELS 0 0 0 0 WWW.SUDO24.COM
  • 2.
    0 LESSON OUTLINE Linear Models andEquations Interpreting Linear Models WWW.SUDO24.COM
  • 3.
    CAN ALL DATASETS BE SHOWN ON A GRAPH IN AN “ORDERLY” MANNER? 0 WWW.SUDO24.COM
  • 4.
    0 LEARNING OUTCOMES Identify and interpretthe intercept of a linear model. Intercept: the point where the line intersects the y-axis Slope: the ratio of change in y to change in x between two points in a line Calculate and interpret the slope of a linear model. State the equation of the line in slope-intercept form. WWW.SUDO24.COM
  • 5.
    NOT ALL DATASETS CAN LEAD TO AN “ORDERED” SET. A set of data may be scattered as the one shown in the graph but can be represented by a line of best fit. LINE OF BEST FIT: A straight line that best represents a set of scattered data. WWW.SUDO24.COM
  • 6.
    0 0 0 0 LINE OF BEST FIT 2 0 10 20 46 8 10 12 14 16 30 40 50 TIME (min) TEMPERATURE (°C) After gathering the data, your group drew the line of best fit as shown. Can you identify the intercept? In an experiment for your Science class, you investigated how fast a given liquid changes its temperature. WWW.SUDO24.COM
  • 7.
    IDENTIFYING THE INTERCEPT OF THELINE Recall that the y-intercept refers to the point where the line intersects the y-ax is. Looking at the graph, the line intersects the y-axis at 25. The y-intercept is thus 25. 2 0 10 20 4 6 8 10 12 14 16 30 40 50 TIME (min) TEMPERATURE (°C) WWW.SUDO24.COM
  • 8.
    INTERPRETING THE INTERCEPT OF THELINE What information can the y-intercept tell us? The y-intercept is also the value of y when x = 0. Looking at the graph again, we can then say that the temperature of the liquid before heating (time = 0), is 25°C. 2 0 10 20 4 6 8 10 12 14 16 30 40 50 TIME (min) TEMPERATURE (°C) WWW.SUDO24.COM
  • 9.
    y - y x- x 2 2 1 1 change in y change in x CALCULATING THE SLOPE OF THE LINE Slope is the ratio of the change in y and the change in x. This can be calculated using two poi nts on the line with the formula: slope (m) = slope (m) = TRY TO SOLVE FOR THE SLOPE OF THE LINE! 2 0 10 20 4 6 8 10 12 14 16 30 40 50 TIME (min) TEMPERATURE (degrees Celsius) WWW.SUDO24.COM
  • 10.
    40 - 35 7- 5 CALCULATING THE SLOPE OF THE LINE Using the marked two points on the line: This slope tells us that the temperature increases by 2.5°C every minute slope (m) = slope (m) = m = 2.5 2 0 10 20 4 6 8 10 12 14 16 30 40 50 TIME (min) TEMPERATURE (degrees Celsius) ANSWER KEY y - y x - x 2 2 1 1 WWW.SUDO24.COM
  • 11.
    0 0 0 EQUATION OF THE LINEIN SLOPE-INTERCEPT FORM Using the y-intercept (b) and the slope (m), the line of best fit may be represented through an equation. Equation of a line in slope intercept form: y = mx+ b WWW.SUDO24.COM
  • 12.
    2 0 10 20 4 6 810 12 14 16 30 40 50 TIME (min) TEMPERATURE (degrees Celsius) STATING THE EQUATION OF THE LINE Given these: The equation of the line is: This equation can now be used to predict the temperature at a given time. m = 2.5 y = 2.5x+ 25 b = 25 y = mx+ b WWW.SUDO24.COM
  • 13.
    ANSWER KEY ACTIVITY: USING THEEQUATION OF THE LINE Predict the temperature of the liquid after 15 minutes of heating. y = 2.5x+ 25 y = 2.5x+ 25 y = 2.5 (15) + 25 y = 62.5°C After 15 minutes of heating, the temperature of the liquid is predicted to be 62.5°C. Asked: Temperature (y) at 15 minutes (x) Solution: using the equation of the line WWW.SUDO24.COM