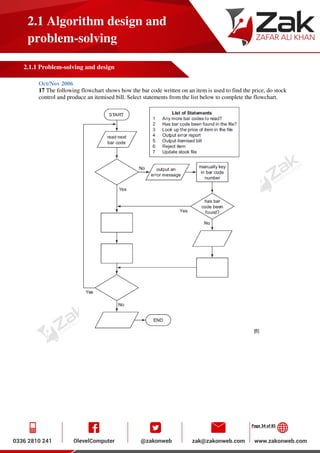
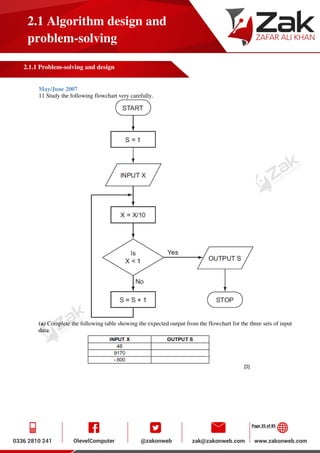
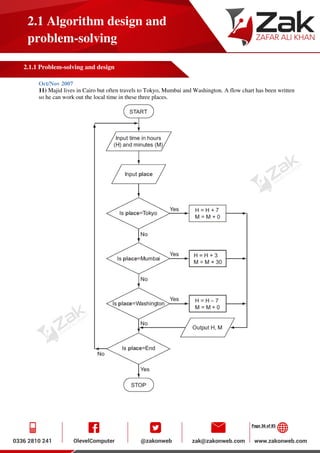
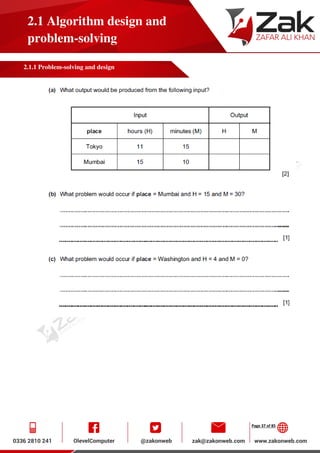
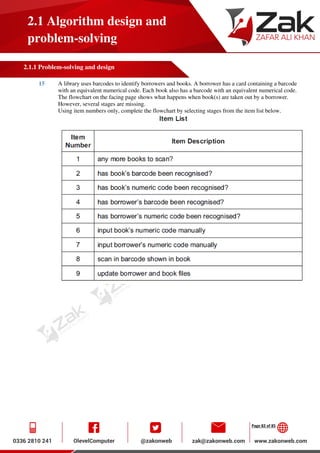
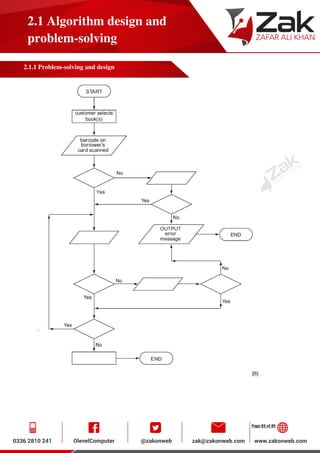
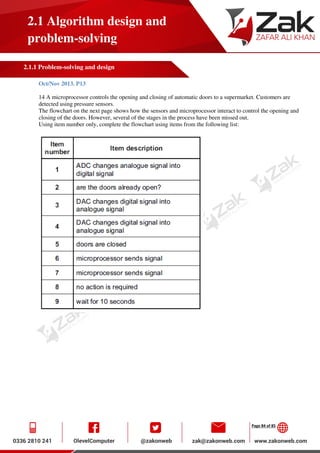
Downloaded 37 times
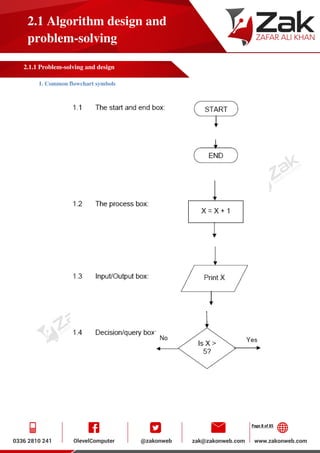
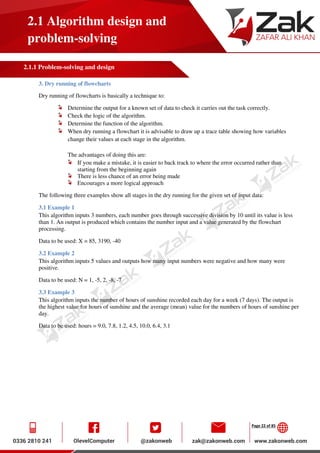
![Page 11 of 85
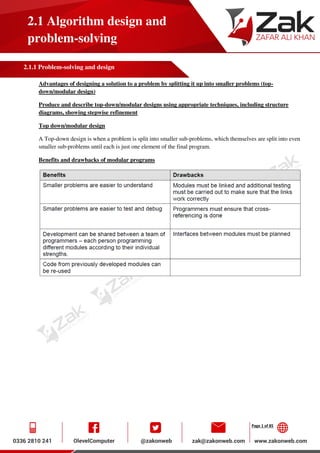
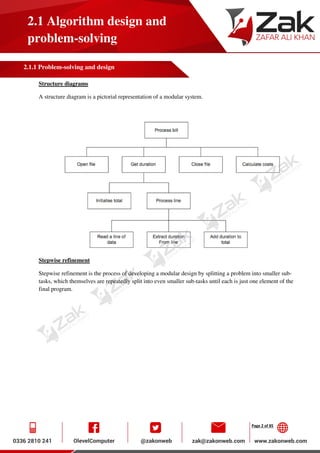
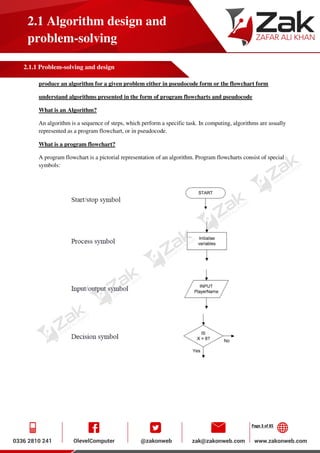
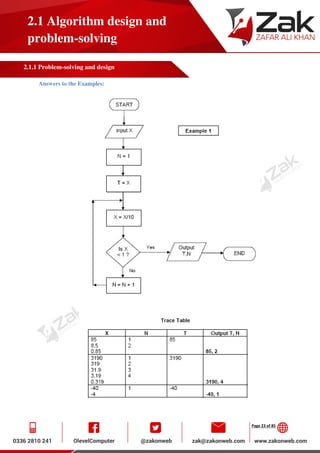
2.1 Algorithm design and
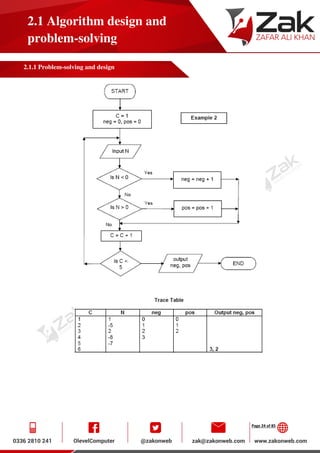
problem-solving
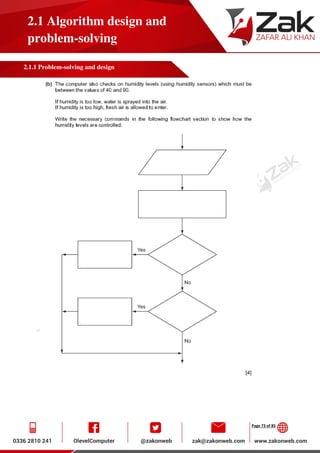
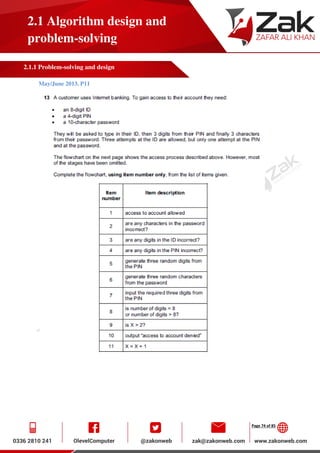
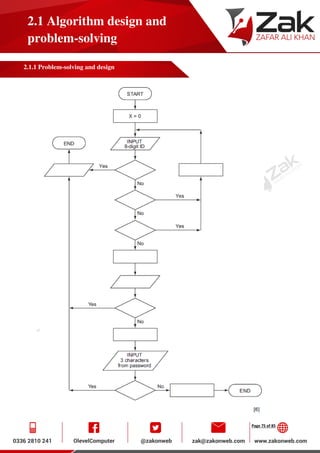
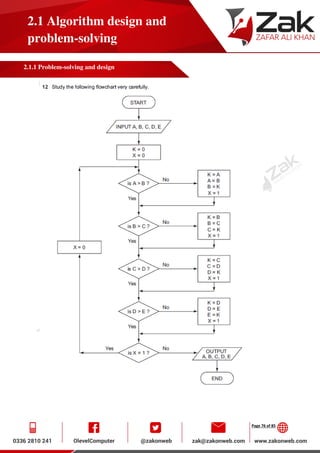
2.1.1 Problem-solving and design
Relational operators, eg. =, <, <=, >, >= and <>
Relational operators are used in the format: [Expression] [Operator] [Expression] and will always return a
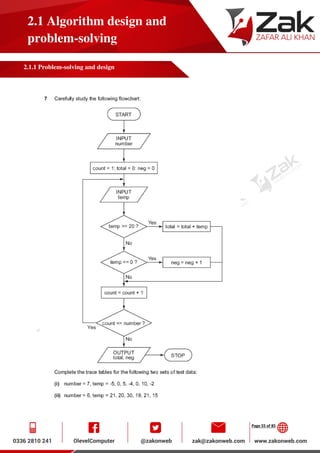
Boolean (True or False) value.
Relational operators are typically used with the “IF” selection and also within conditional loops
(REPEAT-UNTIL or WHILE-WEND).
In the following table, the variables “a” and “name$” have the following assignments:
a3+5
name$ “JAMES”](https://image.slidesharecdn.com/2-150929150858-lva1-app6892/85/problem-solving-and-design-By-ZAK-11-320.jpg)
![Page 12 of 85
2.1 Algorithm design and
problem-solving
2.1.1 Problem-solving and design
Boolean operators AND, OR and NOT
AND & OR
The AND & OR operators always return a Boolean result and are used in the format:
[Boolean] [Operator] [Boolean]
The following ‘truth’ table summarizes the result of the Boolean operations:
Values Results
NOT
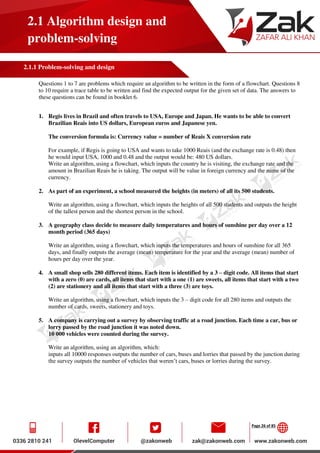
The NOT operator reverses the result of the Boolean expression and is used in the format:
NOT [Boolean]
The following truth table summarizes the NOT operation:
Examples of Boolean ‘logic’
Consider the following algorithm, which is used to monitor a printer and display its output via an
LCD display in the front panel:
IF NOT(PaperTrayEmpty) AND (FilesWaiting > 0) THEN
OUTPUT “PRINTING…”
ELSE
OUTPUT “PLEASE ADD PAPER”
END IF](https://image.slidesharecdn.com/2-150929150858-lva1-app6892/85/problem-solving-and-design-By-ZAK-12-320.jpg)

![Page 31 of 85
2.1 Algorithm design and
problem-solving
2.1.1 Problem-solving and design
Past Papers Questions:
Modular Design/Top-down design:
(Computing 9691 Questions)
May/June 2006
5. (a) Programs can be designed in modular form.
Discuss the advantages and disadvantages of designing programs in modular form.
[5]
(b) A program is to be written which will update the records in a sequential file and then
produce a backup copy.
Describe, using a diagram, the way that this problem can be split into modules to prepare it for
coding. [5]
May/June 2009
A company specialises in creating websites for customers.
8. (a) As part of the process of designing a site, the company will use diagrams in order to make
understanding easier.
Describe two types of diagram that may be used by the company. [4]
May/June 2011. P23
1. (a) Draw a suitable layout for the screen. [5]
3. Kris has written a program that will work out the wages for her staff. The main steps for each
employee are: to work out the hours worked, work out the total earnings, work out tax and finally
print out how much will be taken home.
(a) Complete the structure diagram to show the modules that will be needed.
[3]
(b) The printout will be different for those staff who receives cash and
those who have their earnings paid directly to a bank account. Add the
next level to the print module.
Oct/NOV 2011 P23](https://image.slidesharecdn.com/2-150929150858-lva1-app6892/85/problem-solving-and-design-By-ZAK-31-320.jpg)
![Page 32 of 85
2.1 Algorithm design and
problem-solving
2.1.1 Problem-solving and design
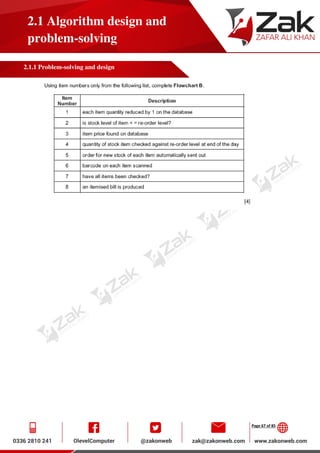
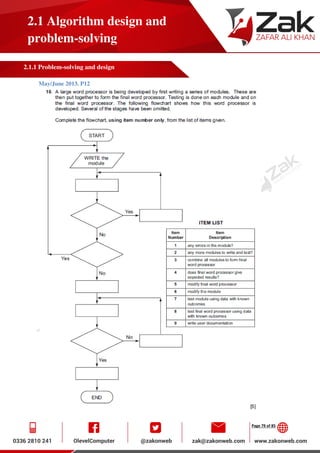
1 Nathan is designing a software solution for stock control in a computer shop. He has a colleague,
called Andre, who will help him write the program. Nathan decides to modularise the solution.
(a) State why modularisation is a good idea. [1]
(b) As the first step in his design he splits the solution into the following main areas:
Initialisation, StockOrdering, Sales, SalesReport.
Complete the following structure diagram.
[1]
(c) SalesReport is made up of two modules, MonthlySalesReport and AnnualSalesReport.
Add them to the structure diagram in (b). [2]
Oct/NOV 2012 P21
1 Soni works for a software house which has been asked to design software for a cycle hire company,
Super Bikes.
Soni decides on the main tasks:
collecting the information about new bikes
entering details of repairs
entering details of hirer
entering details of payment
(a) Complete the structure diagram showing these tasks.
[2]
(b) The collection of information about repairs has three subtasks:
input the repair needed
input the parts list
input the cost of the repair
Add these to the structure diagram in part (a). [1]
(c) State two reasons for dividing the main task into smaller tasks. [2]](https://image.slidesharecdn.com/2-150929150858-lva1-app6892/85/problem-solving-and-design-By-ZAK-32-320.jpg)
![Page 33 of 85
2.1 Algorithm design and
problem-solving
2.1.1 Problem-solving and design
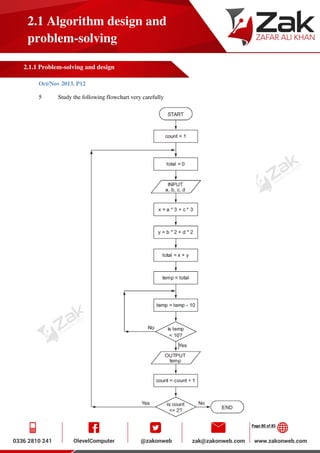
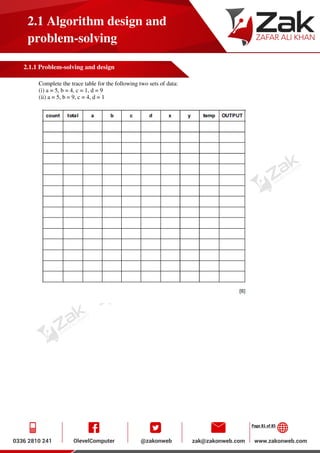
Flow Charts:
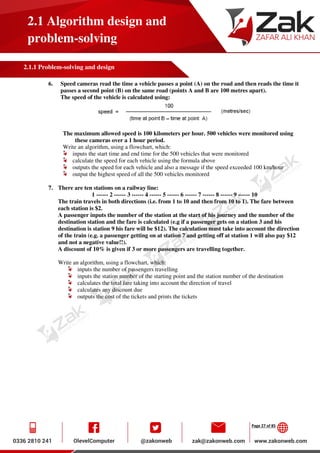
May/June 2006
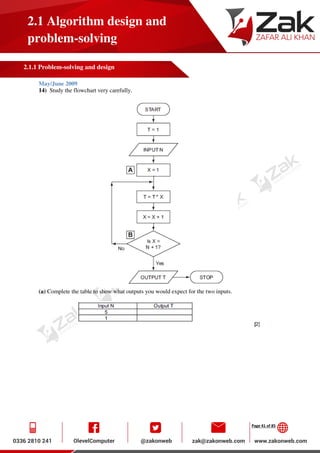
9
Trace the flow chart using the numbers 2 and 3. Write down each of the values of N in the order that they are
printed out.
(a) 2 [1]
(b) 3 [2]](https://image.slidesharecdn.com/2-150929150858-lva1-app6892/85/problem-solving-and-design-By-ZAK-33-320.jpg)
![Page 40 of 85
2.1 Algorithm design and
problem-solving
2.1.1 Problem-solving and design
19) The manufacturing cost of producing an item depends on its complexity. A company manufactures three
different types of item, with costs based on the following calculations:
Item type 1: item cost = parts cost * 1.5
Item type 2: item cost = parts cost * 2.5
Item type 3: item cost = parts cost * 5.0
The company makes 1000 items per day.
Write an algorithm, using pseudocode, flowchart or otherwise, which
inputs the item type and parts cost of each item
outputs the item cost for each item
calculates and outputs the average (mean) item cost per day (based on 1000 items being made).
[5]](https://image.slidesharecdn.com/2-150929150858-lva1-app6892/85/problem-solving-and-design-By-ZAK-40-320.jpg)
![Page 45 of 85
2.1 Algorithm design and
problem-solving
2.1.1 Problem-solving and design
16 (a) Write an algorithm, using pseudocode or a flowchart, which:
_ inputs 50 numbers
_ outputs how many of the numbers were > 100 [3]
(b) Write an algorithm, using pseudocode or a flowchart, which:
_ inputs 100 numbers
_ finds the average of the input numbers
_ outputs the average [3]](https://image.slidesharecdn.com/2-150929150858-lva1-app6892/85/problem-solving-and-design-By-ZAK-45-320.jpg)
![Page 47 of 85
2.1 Algorithm design and
problem-solving
2.1.1 Problem-solving and design
17) A school is doing a check on the heights and weights of all its students. The school has 1000 students.
Write an algorithm, using pseudocode or a flowchart, which
• inputs the height and weight of all 1000 students
• outputs the average (mean) height and weight
• includes any necessary error traps for the input of height and weight [5]](https://image.slidesharecdn.com/2-150929150858-lva1-app6892/85/problem-solving-and-design-By-ZAK-47-320.jpg)
![Page 49 of 85
2.1 Algorithm design and
problem-solving
2.1.1 Problem-solving and design
17 (a) Write an algorithm, using pseudocode or a flowchart, which
_ inputs a set of positive numbers (which end with -1)
_ outputs the average (mean) value of the input numbers
_ outputs the value of the largest (highest) number input [4]
(b) Write an algorithm, using pseudocode or a flowchart, which
_ inputs a whole number (which is > 0)
_ calculates the number of digits in the number
_ outputs the number of digits and the original number
(E.g. 147 would give an output of 3, 147) [4]](https://image.slidesharecdn.com/2-150929150858-lva1-app6892/85/problem-solving-and-design-By-ZAK-49-320.jpg)
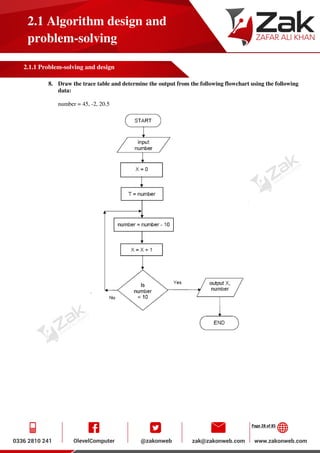
![Page 51 of 85
2.1 Algorithm design and
problem-solving
2.1.1 Problem-solving and design
(b) What is the purpose of this flowchart? [1]](https://image.slidesharecdn.com/2-150929150858-lva1-app6892/85/problem-solving-and-design-By-ZAK-51-320.jpg)


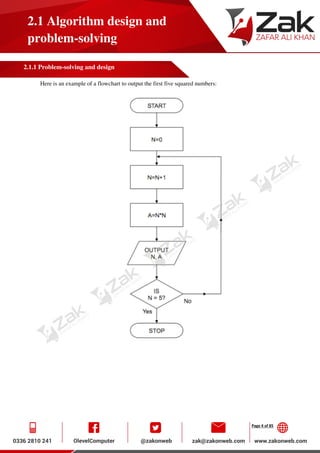
This document discusses algorithm design and problem solving. It covers topics like top-down modular design, structure diagrams, stepwise refinement, pseudocode, flowcharts, and validation checks. An example flowchart is provided that squares the first 5 numbers. Pseudocode is also demonstrated for an ATM algorithm. Key aspects of algorithm evaluation like efficiency, correctness, and appropriateness are defined. Various programming constructs like assignment statements, arithmetic and relational operators, and Boolean logic are also explained.