Unleash Your Potential - Namagunga Girls Coding Club
Practical 01 (detailed)
1. Computer Programming by Ali Asghar Manjotho 1
Practical 01
Problem analysis and program design for sequential control flow
Objectives
Understand the basic concepts involved in solving computational problems.
Analyzing and designing programs for sequential logic.
To get familiar with and be able to create IPO chart for various problems.
To get familiar with and be able to create algorithms to solve various problems.
To get familiar with and be able to translate algorithms in to flow charts.
Tools
Edraw Max (Version: 6.8 or 7.2)
Microsoft Word (Version: 2007, 2010 or 2013)
Keywords: Problem solving, computational problems, sequential logic, IPO
chart, algorithm, flow chart.
Duration: 03 hours
1.1 Introduction
1.1.1 Problem solving in everyday life
People make decisions every day to solve problems that affect their lives. The problems may be as
unimportant as what to watch on television or as important as choosing a new profession. If a bad
decision is made, time and resources are wasted, so it’s important that people know how to make
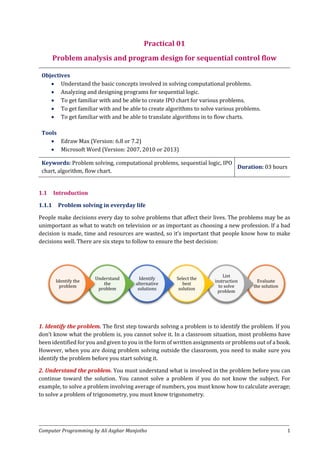
decisions well. There are six steps to follow to ensure the best decision:
1. Identify the problem. The first step towards solving a problem is to identify the problem. If you
don’t know what the problem is, you cannot solve it. In a classroom situation, most problems have
been identified for you and given to you in the form of written assignments or problems out of a book.
However, when you are doing problem solving outside the classroom, you need to make sure you
identify the problem before you start solving it.
2. Understand the problem. You must understand what is involved in the problem before you can
continue toward the solution. You cannot solve a problem if you do not know the subject. For
example, to solve a problem involving average of numbers, you must know how to calculate average;
to solve a problem of trigonometry, you must know trigonometry.
Evaluate
the solution
List
instruction
to solve
problem
Select the
best
solution
Identify
alternative
solutions
Understand
the
problem
Identify the
problem
2. Practical 01: Problem analysis and program design for sequential control flow
2 Computer Programming by Ali Asghar Manjotho
3. Identify alternative solutions. A single problem can be solved in many different ways. Identify
and list all the possible solutions to the problem. For example there are multiple ways to sort the
numbers as: Insertion sort, Selection sort or Bubble sort.
4. Select the best solution. Analyze and identify the pros and cons of every alternative solution.
Choose the solution that is optimal and best matches with your requirements. For example out of all
the sorting options you choose bubble sort as your best solution.
5. List instructions to solve problem. Write down general step by step procedure to solve the
problem. For example to solve problem of calculating average of three numbers:
Step 01 : Ask numbers a, b, and c from the user
Step 02 : Add a, b, c and store result in sum
Step 03 : Divide sum by 3 and store result in avg
Step 04 : Display avg
6. Evaluate the solution. Finally evaluate and test the solution, means to check its result to see if it
is correct and satisfies the needs. For example, when a person needs a pen to write a letter, buying
him marker may be a correct solution, but it may not be very satisfactory. If the result is either
incorrect or unsatisfactory, then the problem solver must review the list of instructions to see that
they are correct or start the process all over again.
If any of these six steps are not completed well, the results may be less than desired. Most people use
them without even knowing it.
1.1.2 Sequential control flow
Sequential control flow also referred to as sequential logic is one of the order in which the program
instructions are executed. A program is usually composed of multiple instructions which are to be
executed by the computer. It is the default order of program execution. In sequential logic:
A program starts at first instruction and all the instructions are executed in a sequence of one
after another.
No any instruction is skipped out of the execution.
Order of execution is not violated (all instruction are executed in sequence e.g. Instruction 1
then 2, followed by 3 and so on).
1.1.3 Problem analysis tools
Problem analysis is a set of activities that increase the designer’s understanding of a problem, in
order to have a better solution. Problem analysis tools help you analyze the problem to have a clear
picture of the problem. They are used to conduct postmortem of a problem.
Three of the problem analysis tools used in this practical are:
3. Practical 01: Problem analysis and program design for sequential control flow
Computer Programming by Ali Asghar Manjotho 3
1.1.3.1 IPO (Input Process Output) chart
IPO stands for Input Process Output. It performs the analysis by identifying the inputs, processing
items and outputs of a given problem. It can be represented by the following chart:
Input Processing Output
Processing Items:
Algorithm:
The input section specifies all the inputs to the problem. The input may be given by the user from
input devices like, keyboard, mouse, scanner etc. The input may also come as the contents of a file.
The input may come from the network or Internet.
The output section specifies all the outcomes of the problem. The output may be in the form of the
presenting the results on the monitor screen, printer or any other output device. The output may also
be stored in a file. The output may be redirected to network or Internet.
The processing section specifies two things: processing items and algorithm. The processing items
involve any formula or equation to be used while processing. The algorithm is the step by step
processing procedure to solve that task.
1.1.3.2 Algorithm
Algorithm is the representation of a solution to a problem. It is step by step procedure to solve a given
problem. An algorithm contains finite number of instructions in order to solve a problem. For
example, calculating the average of three numbers.
Step 01: Start
Step 02: Input number1, number2 and number3 from the user
Step 03: Calculate average as: average = (number1 + number2 + number3)/3
Step 04: Print average
Step 05: End
4. Practical 01: Problem analysis and program design for sequential control flow
4 Computer Programming by Ali Asghar Manjotho
1.1.3.3 Flow chart
Flow chart is the pictorial representation of a process or an algorithm. It uses symbols (boxes of
different shapes) to represent each step of an algorithm. All the symbols are then connected with
arrows to show the flow of the process.
Following is the list of some commonly used flow chart symbols:
Symbol Name Meaning
Terminal
(Oval)
Indicates the beginning and end
points of an algorithm.
Process
(Rectangle)
Shows an instruction other than
input, output or selection.
Input-Output
(Parallelogram)
Shows an input or output
instruction.
Decision
(Diamond)
Shows any point in the process
where decision is to be made.
On-Page Connector
Continues and connects the
flowchart on the same page.
Off-Page Connector
Continues and connects the
flowchart on another page.
Sub-Process
Denotes movement to another
process and hence a new
flowchart.
Arrows
Connects symbols and shows flow
of the process or algorithm.
5. Practical 01: Problem analysis and program design for sequential control flow
Computer Programming by Ali Asghar Manjotho 5
1.2 Procedure
1.2.1 Problem example
Consider the following temperature scale conversion problem example. We are going to draw its IPO
chart, create algorithm and flow chart.
Problem statement: Write a program that receives the temperature in Celsius from the user and
displays the temperature in Fahrenheit and Kelvin scale.
1.2.2 Creating IPO chart and algorithm
Step 01: Create a new blank document in MS Word.
Step 02: Insert a new table of 2 rows 3 columns by going in to Insert Tab>Table
Step 03: Type in basic text in the table.
Input Processing Output
Processing Items:
Algorithm:
Step 04: Identify all the outputs, to the program, from the problem statement. There are two output
of the problem:
Temperature in Fahrenheit
Temperature in Kelvin
Step 05: Identify all the inputs, to the program, from the problem statement. There is one input to
the program:
Temperature in Celsius.
6. Practical 01: Problem analysis and program design for sequential control flow
6 Computer Programming by Ali Asghar Manjotho
Step 06: Identify all the processing items to be used in solving the problem. The processing items
involve any formula, equation, expression or sequence to be used. There are two formulas to be used:
F = C * 1.8 + 32
K = C + 273.15
Step 07: Write down step by step procedure to solve the problem.
Step 01: Start
Step 02: Input Celsius c from the user
Step 03: Calculate Fahrenheit temperature as: f = (c * 1.8) + 32
Step 04: Calculate Kevin temperature as: k = c + 273.15
Step 05: Print f and k
Step 06: End
Step 08: Fill in all the information in IPO chart.
Input Processing Output
• Temperature in
Celsius
Processing Items:
F = C * 1.8 + 32
K = C + 273.15
Algorithm:
Step 01: Start
Step 02: Input Celsius c from the user
Step 03: Calculate Fahrenheit temperature as:
f = (c * 1.8) + 32
Step 04: Calculate Kevin temperature as:
k = c + 273.15
Step 05: Print f and k
Step 06: End
• Temperature in
Fahrenheit
• Temperature in
Kelvin
1.2.3 Creating flow chart
Step 01: Open Edraw Max and create new basic flow chart by going in to Template
Categories>Flowchart>Basic Flowchart. Click the Create button at the right side.
7. Practical 01: Problem analysis and program design for sequential control flow
Computer Programming by Ali Asghar Manjotho 7
Step 02: Click and drag Start or Terminal symbol from toolbox in to drawing area. Every flow chart
starts with this symbol.
Step 03: Double click the shape to add the text “Start”.
Step 04: Click and drag Data symbol from toolbox in to drawing area.
Step 05: Double click the shape to add the text “Input C”.
Step 06: Click and drag Process symbol from toolbox in to drawing area.
8. Practical 01: Problem analysis and program design for sequential control flow
8 Computer Programming by Ali Asghar Manjotho
Step 07: Double click the shape to add the text “f = (c * 1.8) + 32”.
Step 08: Click and drag Process symbol from toolbox in to drawing area.
Step 09: Double click the shape to add the text “k = c + 273.15”.
Step 10: Click and drag Data symbol from toolbox in to drawing area.
Step 11: Double click the shape to add the text “Print f, k”.
Step 12: Click and drag Start or Terminal symbol from toolbox in to drawing area. Every flow chart
ends with this symbol.
9. Practical 01: Problem analysis and program design for sequential control flow
Computer Programming by Ali Asghar Manjotho 9
Step 13: Double click the shape to add the text “End”.
Step 14: Select Right-Angle Connector from the top ribbon bar.
Step 15: Point your cursor over the center of first start symbol. When red lines appear, click over it
(do not leave the click hold your mouse button down), drag your cursor to the center of second
symbol i.e. input box. When the red lines appear over it release the mouse button. Hence you
connected two symbols.
10. Practical 01: Problem analysis and program design for sequential control flow
10 Computer Programming by Ali Asghar Manjotho
Step 16: Connect rest of the symbols with arrows.
1.3 Problem examples
1.3.1 Area of rectangle
Problem statement: Write a program that accepts the width and the height of a rectangle from the
user and prints the area of the rectangle.
IPO chart and algorithm
Input Processing Output
• Width of rectangle
• Height of rectangle
Processing Items:
area = width * height
Algorithm:
Step 01: Start
Step 02: Input width and height from the user
Step 03: Calculate area as: area = width * height
Step 04: Print area
Step 05: End
• Area of rectangle
11. Practical 01: Problem analysis and program design for sequential control flow
Computer Programming by Ali Asghar Manjotho 11
Flow chart
1.3.2 Average of three numbers
Problem statement: Write a program that accepts three numbers from the user and displays the
average of the numbers.
IPO chart and algorithm
Input Processing Output
• First number
• Second number
• Third number
Processing Items:
average = (number1 + number2 + number3)/3
Algorithm:
Step 01: Start
Step 02: Input number1, number2 and number3
from the user
Step 03: Calculate average as:
average = (number1 + number2 + number3)/3
Step 04: Print average
Step 05: End
• Average of
numbers
Flow chart
12. Practical 01: Problem analysis and program design for sequential control flow
12 Computer Programming by Ali Asghar Manjotho
1.3.3 Area and circumference of a circle
Problem statement: Write a program that receives the radius of the circle from the user and displays
the area and circumference of the circle.
IPO chart and algorithm
Input Processing Output
• Radius of circle Processing Items:
area = π * radius^2
circumference = 2 * π * radius
Algorithm:
Step 01: Start
Step 02: Input radius from the user
Step 03: set PI = 3.1415
Step 04: Calculate area as: area = PI * radius^2
Step 05: Calculate circumference as:
circumference = 2 * PI * radius
Step 06: Print area and circumference
Step 07: End
• Area of circle
• Circumference of circle
Flow chart
13. Practical 01: Problem analysis and program design for sequential control flow
Computer Programming by Ali Asghar Manjotho 13
1.3.4 Buntty, Bubbly and Building
Problem statement: There are two friends Buntty and Bubbly. Buntty is standing at the top of a
vertical building and Bubbly is standing on the ground away from the building. Write a program that
displays the distance of Bubbly from the building after asking the user about the length of the building
and the distance between Buntty and Bubbly.
IPO chart and algorithm
Input Processing Output
• Distance
between Buntty
and Bubbly
• Height of the
Building
Processing Items:
Hyp2 = Base2 + Perp2
Hyp = Distance b/w Buntty and Bubbly
Base = Distance b/w Bubbly and building
Perp = Height of building
Base = √Hyp2 + Perp2
Algorithm:
Step 01: Start
Step 02: Input Dis_Bun_Bub, Height_Bui from the user
Step 03: Calculate Distance b/w Bubbly and building as:
Dis_Bub_Bui = √𝐷𝑖𝑠_𝐵𝑢𝑛_𝐵𝑢𝑏2 + 𝐻𝑒𝑖𝑔ℎ𝑡_𝐵𝑢𝑖2
Step 04: Print Dis_Bub_Bui
Step 05: End
• Distance of
Bubbly from
the building
Flow chart
14. Practical 01: Problem analysis and program design for sequential control flow
14 Computer Programming by Ali Asghar Manjotho
1.3.5 Reverse a number
Problem statement: Write a program that asks the user to enter a three digit integer number and
displays the reverse number of its.
IPO chart and algorithm
Input Processing Output
• Three digit
integer
number
Processing Items:
549 ==> 945
reverseNum = digit_3 * 100 + digit_2 * 10 + digit_1
Algorithm:
Step 01: Start
Step 02: Input originalNum from the user
Step 03: digit_3 = (originalNum MOD 10)
Step 04: originalNum = ⌊𝑜𝑟𝑖𝑔𝑖𝑛𝑎𝑙𝑁𝑢𝑚 / 10⌋
Step 05: digit_2 = (originalNum MOD 10)
Step 06: originalNum = ⌊𝑜𝑟𝑖𝑔𝑖𝑛𝑎𝑙𝑁𝑢𝑚 / 10⌋
Step 07: digit_1 = originalNum
Step 08: reverseNum = digit_3 * 100 + digit_2 * 10 + digit_1
Step 09: Print reverseNum
Step 10: End
• Reverse number
Flow chart
15. Practical 01: Problem analysis and program design for sequential control flow
Computer Programming by Ali Asghar Manjotho 15
EXERCISE
1. For each of the following statement write down the flow chart symbol you will use.
A B C D E F
Statement Flow chart symbol
Terminate the process
Set the variable a = 5
Calculate the square of a number
Getting name of the user
Initiate the process
Continue a flow chart on the next page
Displaying the marks of student
Executing another process
Prompting the user
Continue a flow chart on the same page
2. Write down the problem statement for the following flow chart.
16. Practical 01: Problem analysis and program design for sequential control flow
16 Computer Programming by Ali Asghar Manjotho
3. For each of the following problem statement, create the IPO chart with algorithm and Flow
chart.
Problem Statement 1
Write a computer program that accepts the base and height of a right angle triangle from the user
and displays the area of the triangle.
Problem Statement 2
A person is running in a circular ground. Write a computer program that asks the user to input the
radius of the ground in meters and the number of rounds the person completes. The program should
display the amount of distance travelled by the person in meters.
Problem Statement 3
Write a program that asks the user to enter two integer numbers, stores them in variables num1 and
num2 respectively. The program swaps the values of two variables with each other without using a
third variable and displays the values of both the variables after swapping.
Sample output:
Input: Output:
num1 = 45 num1 = 94
num2 = 94 num2 = 45
Problem Statement 4
Write a program that asks the user to enter a four digit integer number and displays the average of
all the four digits of a number.
Sample output:
Input: Output:
number = 9425 average =
9+4+2+ 5
4
= 5
Problem Statement 5
A person enters the bank and stands in the queue to get his salary. When his turn comes, he requests the
cashier that I need my salary with minimum notes and coins. Write a program for the cashier that first
asks the cashier to enter the salary amount and then displays the number of notes and coins of (Rs. 5000,
Rs. 1000, Rs. 100, Rs. 50, Rs. 20, Rs. 10, Rs. 5, Rs. 2 and Re. 1).