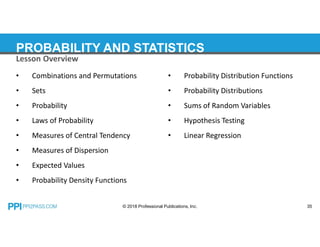
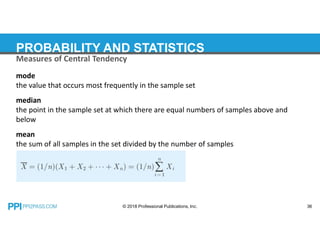
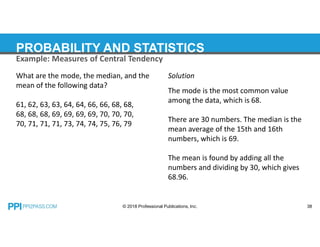
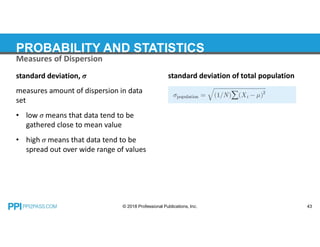
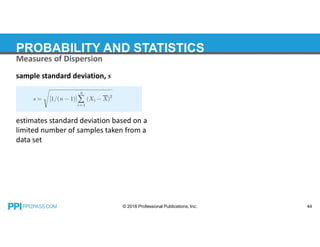
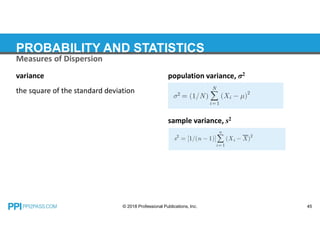
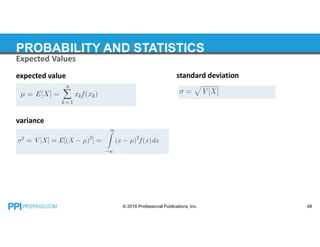
SlideShare a Scribd company logo
Probability and
Statistics
FE Exam Prep Course
© 2018 Professional Publications, Inc.
PROBABILITY AND STATISTICS
• Combinations and Permutations
• Sets
• Probability
• Laws of Probability
• Measures of Central Tendency
• Measures of Dispersion
• Expected Values
• Probability Density Functions
• Probability Distribution Functions
• Probability Distributions
• Sums of Random Variables
• Hypothesis Testing
• Linear Regression
© 2018 Professional Publications, Inc. 35
Lesson Overview
PROBABILITY AND STATISTICS
mode
the value that occurs most frequently in the sample set
median
the point in the sample set at which there are equal numbers of samples above and
below
mean
the sum of all samples in the set divided by the number of samples
© 2018 Professional Publications, Inc. 36
Measures of Central Tendency
PROBABILITY AND STATISTICS
What are the mode, the median, and the
mean of the following data?
61, 62, 63, 63, 64, 64, 66, 66, 68, 68,
68, 68, 68, 69, 69, 69, 69, 70, 70, 70,
70, 71, 71, 71, 73, 74, 74, 75, 76, 79
© 2018 Professional Publications, Inc. 37
Example: Measures of Central Tendency
PROBABILITY AND STATISTICS
What are the mode, the median, and the
mean of the following data?
61, 62, 63, 63, 64, 64, 66, 66, 68, 68,
68, 68, 68, 69, 69, 69, 69, 70, 70, 70,
70, 71, 71, 71, 73, 74, 74, 75, 76, 79
Solution
The mode is the most common value
among the data, which is 68.
There are 30 numbers. The median is the
mean average of the 15th and 16th
numbers, which is 69.
The mean is found by adding all the
numbers and dividing by 30, which gives
68.96.
© 2018 Professional Publications, Inc. 38
Example: Measures of Central Tendency
PROBABILITY AND STATISTICS
weighted arithmetic mean
• used when some data are more
significant than others
• wi = weight assigned to datum Xi
© 2018 Professional Publications, Inc. 39
Measures of Central Tendency
PROBABILITY AND STATISTICS
Three observations, 62, 64, and 72, are
given weights of 4, 3, and 2, respectively.
Most nearly, what is the weighted
arithmetic mean of these data?
(A) 65
(B) 66
(C) 68
(D) 69
© 2018 Professional Publications, Inc. 40
Example: Measures of Central Tendency
PROBABILITY AND STATISTICS
Three observations, 62, 64, and 72, are
given weights of 4, 3, and 2, respectively.
Most nearly, what is the weighted
arithmetic mean of these data?
(A) 65
(B) 66
(C) 68
(D) 69
Solution
The weighted arithmetic mean is 65.
The answer is (A).
© 2018 Professional Publications, Inc. 41
Example: Measures of Central Tendency
        
 
4 62 3 64 2 72
4 3 2
64.89 65
i i
w
i
w X
X
w
 
 
 



PROBABILITY AND STATISTICS
geometric mean of the sample
• the number that, when raised to the
power of the sample size, gives the
product of all samples
• used when data are consecutive
multipliers in other calculations
root-mean-square value
• the square root of the arithmetic
mean of the squares of all samples
© 2018 Professional Publications, Inc. 42
Measures of Central Tendency
PROBABILITY AND STATISTICS
standard deviation, σ
measures amount of dispersion in data
set
• low σ means that data tend to be
gathered close to mean value
• high σ means that data tend to be
spread out over wide range of values
standard deviation of total population
© 2018 Professional Publications, Inc. 43
Measures of Dispersion
PROBABILITY AND STATISTICS
sample standard deviation, s
estimates standard deviation based on a
limited number of samples taken from a
data set
© 2018 Professional Publications, Inc. 44
Measures of Dispersion
PROBABILITY AND STATISTICS
variance
the square of the standard deviation
population variance, σ2
sample variance, s2
© 2018 Professional Publications, Inc. 45
Measures of Dispersion
PROBABILITY AND STATISTICS
What is the population variance and
standard deviation of the following data?
61, 62, 63, 63, 64, 64, 66, 66, 67, 68,
68, 68, 68, 69, 69, 69, 69, 70, 70, 70,
70, 71, 71, 72, 73, 74, 74, 75, 76, 79
© 2018 Professional Publications, Inc. 46
Example: Measures of Dispersion
PROBABILITY AND STATISTICS
What is the population variance and
standard deviation of the following data?
61, 62, 63, 63, 64, 64, 66, 66, 67, 68,
68, 68, 68, 69, 69, 69, 69, 70, 70, 70,
70, 71, 71, 72, 73, 74, 74, 75, 76, 79
Solution
Use the equation for population variance.
© 2018 Professional Publications, Inc. 47
Example: Measures of Dispersion
 
2
2
1
1 N
i
i
X
N
 

 

PROBABILITY AND STATISTICS
expected value
variance
© 2018 Professional Publications, Inc. 48
Expected Values
standard deviation
PROBABILITY AND STATISTICS
• Combinations and Permutations
• Sets
• Probability
• Laws of Probability
• Measures of Central Tendency
• Measures of Dispersion
• Expected Values
• Probability Density Functions
• Probability Distribution Functions
• Probability Distributions
• Sums of Random Variables
• Hypothesis Testing
• Linear Regression
© 2018 Professional Publications, Inc. 49
Lesson Overview

More Related Content

Similar to Probability and Statistics part 2.pdf

Computing Descriptive Statistics © 2014 Argos.docx
 Computing Descriptive Statistics     © 2014 Argos.docx Computing Descriptive Statistics     © 2014 Argos.docx
Computing Descriptive Statistics © 2014 Argos.docx
aryan532920
 
Computing Descriptive Statistics © 2014 Argos.docx
Computing Descriptive Statistics     © 2014 Argos.docxComputing Descriptive Statistics     © 2014 Argos.docx
Computing Descriptive Statistics © 2014 Argos.docx
AASTHA76
 
3Measurements of health and disease_MCTD.pdf
3Measurements of health and disease_MCTD.pdf3Measurements of health and disease_MCTD.pdf
3Measurements of health and disease_MCTD.pdf
AmanuelDina
 
IHP 525 Milestone Five (Final) TemplateMOST OF THIS TEMPLATE S.docx
IHP 525 Milestone Five (Final) TemplateMOST OF THIS TEMPLATE S.docxIHP 525 Milestone Five (Final) TemplateMOST OF THIS TEMPLATE S.docx
IHP 525 Milestone Five (Final) TemplateMOST OF THIS TEMPLATE S.docx
wilcockiris
 
Statistical ProcessesCan descriptive statistical processes b.docx
Statistical ProcessesCan descriptive statistical processes b.docxStatistical ProcessesCan descriptive statistical processes b.docx
Statistical ProcessesCan descriptive statistical processes b.docx
darwinming1
 

Similar to Probability and Statistics part 2.pdf (20)

Computing Descriptive Statistics © 2014 Argos.docx
 Computing Descriptive Statistics     © 2014 Argos.docx Computing Descriptive Statistics     © 2014 Argos.docx
Computing Descriptive Statistics © 2014 Argos.docx
 
Computing Descriptive Statistics © 2014 Argos.docx
Computing Descriptive Statistics     © 2014 Argos.docxComputing Descriptive Statistics     © 2014 Argos.docx
Computing Descriptive Statistics © 2014 Argos.docx
 
Are we really including all relevant evidence
Are we really including all relevant evidence Are we really including all relevant evidence
Are we really including all relevant evidence
 
EXPLORATORY DATA ANALYSIS
EXPLORATORY DATA ANALYSISEXPLORATORY DATA ANALYSIS
EXPLORATORY DATA ANALYSIS
 
DATA ANALYSIS --- 10.pdf
DATA ANALYSIS --- 10.pdfDATA ANALYSIS --- 10.pdf
DATA ANALYSIS --- 10.pdf
 
Organizational development research
Organizational development researchOrganizational development research
Organizational development research
 
3Measurements of health and disease_MCTD.pdf
3Measurements of health and disease_MCTD.pdf3Measurements of health and disease_MCTD.pdf
3Measurements of health and disease_MCTD.pdf
 
Assigning Scores For Ordered Categorical Responses
Assigning Scores For Ordered Categorical ResponsesAssigning Scores For Ordered Categorical Responses
Assigning Scores For Ordered Categorical Responses
 
IHP 525 Milestone Five (Final) TemplateMOST OF THIS TEMPLATE S.docx
IHP 525 Milestone Five (Final) TemplateMOST OF THIS TEMPLATE S.docxIHP 525 Milestone Five (Final) TemplateMOST OF THIS TEMPLATE S.docx
IHP 525 Milestone Five (Final) TemplateMOST OF THIS TEMPLATE S.docx
 
Anomaly detection: Core Techniques and Advances in Big Data and Deep Learning
Anomaly detection: Core Techniques and Advances in Big Data and Deep LearningAnomaly detection: Core Techniques and Advances in Big Data and Deep Learning
Anomaly detection: Core Techniques and Advances in Big Data and Deep Learning
 
Air conditioner market case study
Air conditioner market case studyAir conditioner market case study
Air conditioner market case study
 
Presentation of Project and Critique.pptx
Presentation of Project and Critique.pptxPresentation of Project and Critique.pptx
Presentation of Project and Critique.pptx
 
Advanced Statistics.pptx
Advanced Statistics.pptxAdvanced Statistics.pptx
Advanced Statistics.pptx
 
Statistical Data Analysis Foundations.pptx
Statistical Data Analysis Foundations.pptxStatistical Data Analysis Foundations.pptx
Statistical Data Analysis Foundations.pptx
 
Session 1 and 2.pptx
Session 1 and 2.pptxSession 1 and 2.pptx
Session 1 and 2.pptx
 
Statistical ProcessesCan descriptive statistical processes b.docx
Statistical ProcessesCan descriptive statistical processes b.docxStatistical ProcessesCan descriptive statistical processes b.docx
Statistical ProcessesCan descriptive statistical processes b.docx
 
Data Science-final7
Data Science-final7Data Science-final7
Data Science-final7
 
Anomaly detection Meetup Slides
Anomaly detection Meetup SlidesAnomaly detection Meetup Slides
Anomaly detection Meetup Slides
 
Descriptive Analytics: Data Reduction
 Descriptive Analytics: Data Reduction Descriptive Analytics: Data Reduction
Descriptive Analytics: Data Reduction
 
Understanding the Different Scales of Measurement with Examples
Understanding the Different Scales of Measurement with ExamplesUnderstanding the Different Scales of Measurement with Examples
Understanding the Different Scales of Measurement with Examples
 

More from Almolla Raed (8)

نموذج+دراسة+جدوى.pptx
نموذج+دراسة+جدوى.pptxنموذج+دراسة+جدوى.pptx
نموذج+دراسة+جدوى.pptx
 
Bacnet&Lon.ppt
Bacnet&Lon.pptBacnet&Lon.ppt
Bacnet&Lon.ppt
 
Fire Protection - Systems and Response.pdf
Fire Protection - Systems and Response.pdfFire Protection - Systems and Response.pdf
Fire Protection - Systems and Response.pdf
 
ECE4331_class1.ppt
ECE4331_class1.pptECE4331_class1.ppt
ECE4331_class1.ppt
 
Copy of 07-EthicsSlides.pdf
Copy of 07-EthicsSlides.pdfCopy of 07-EthicsSlides.pdf
Copy of 07-EthicsSlides.pdf
 
Mathematics 6.pdf
Mathematics 6.pdfMathematics 6.pdf
Mathematics 6.pdf
 
Mathematics 7.pdf
Mathematics 7.pdfMathematics 7.pdf
Mathematics 7.pdf
 
Probability and Statistics part 1.pdf
Probability and Statistics part 1.pdfProbability and Statistics part 1.pdf
Probability and Statistics part 1.pdf
 

Recently uploaded

Digital Signal Processing Lecture notes n.pdf
Digital Signal Processing Lecture notes n.pdfDigital Signal Processing Lecture notes n.pdf
Digital Signal Processing Lecture notes n.pdf
AbrahamGadissa
 
Online blood donation management system project.pdf
Online blood donation management system project.pdfOnline blood donation management system project.pdf
Online blood donation management system project.pdf
Kamal Acharya
 
CFD Simulation of By-pass Flow in a HRSG module by R&R Consult.pptx
CFD Simulation of By-pass Flow in a HRSG module by R&R Consult.pptxCFD Simulation of By-pass Flow in a HRSG module by R&R Consult.pptx
CFD Simulation of By-pass Flow in a HRSG module by R&R Consult.pptx
R&R Consult
 
Fruit shop management system project report.pdf
Fruit shop management system project report.pdfFruit shop management system project report.pdf
Fruit shop management system project report.pdf
Kamal Acharya
 

Recently uploaded (20)

Scaling in conventional MOSFET for constant electric field and constant voltage
Scaling in conventional MOSFET for constant electric field and constant voltageScaling in conventional MOSFET for constant electric field and constant voltage
Scaling in conventional MOSFET for constant electric field and constant voltage
 
RESORT MANAGEMENT AND RESERVATION SYSTEM PROJECT REPORT.pdf
RESORT MANAGEMENT AND RESERVATION SYSTEM PROJECT REPORT.pdfRESORT MANAGEMENT AND RESERVATION SYSTEM PROJECT REPORT.pdf
RESORT MANAGEMENT AND RESERVATION SYSTEM PROJECT REPORT.pdf
 
Quality defects in TMT Bars, Possible causes and Potential Solutions.
Quality defects in TMT Bars, Possible causes and Potential Solutions.Quality defects in TMT Bars, Possible causes and Potential Solutions.
Quality defects in TMT Bars, Possible causes and Potential Solutions.
 
A case study of cinema management system project report..pdf
A case study of cinema management system project report..pdfA case study of cinema management system project report..pdf
A case study of cinema management system project report..pdf
 
retail automation billing system ppt.pptx
retail automation billing system ppt.pptxretail automation billing system ppt.pptx
retail automation billing system ppt.pptx
 
Digital Signal Processing Lecture notes n.pdf
Digital Signal Processing Lecture notes n.pdfDigital Signal Processing Lecture notes n.pdf
Digital Signal Processing Lecture notes n.pdf
 
Introduction to Machine Learning Unit-4 Notes for II-II Mechanical Engineering
Introduction to Machine Learning Unit-4 Notes for II-II Mechanical EngineeringIntroduction to Machine Learning Unit-4 Notes for II-II Mechanical Engineering
Introduction to Machine Learning Unit-4 Notes for II-II Mechanical Engineering
 
HYDROPOWER - Hydroelectric power generation
HYDROPOWER - Hydroelectric power generationHYDROPOWER - Hydroelectric power generation
HYDROPOWER - Hydroelectric power generation
 
Democratizing Fuzzing at Scale by Abhishek Arya
Democratizing Fuzzing at Scale by Abhishek AryaDemocratizing Fuzzing at Scale by Abhishek Arya
Democratizing Fuzzing at Scale by Abhishek Arya
 
Construction method of steel structure space frame .pptx
Construction method of steel structure space frame .pptxConstruction method of steel structure space frame .pptx
Construction method of steel structure space frame .pptx
 
Electrostatic field in a coaxial transmission line
Electrostatic field in a coaxial transmission lineElectrostatic field in a coaxial transmission line
Electrostatic field in a coaxial transmission line
 
BRAKING SYSTEM IN INDIAN RAILWAY AutoCAD DRAWING
BRAKING SYSTEM IN INDIAN RAILWAY AutoCAD DRAWINGBRAKING SYSTEM IN INDIAN RAILWAY AutoCAD DRAWING
BRAKING SYSTEM IN INDIAN RAILWAY AutoCAD DRAWING
 
Online blood donation management system project.pdf
Online blood donation management system project.pdfOnline blood donation management system project.pdf
Online blood donation management system project.pdf
 
Arduino based vehicle speed tracker project
Arduino based vehicle speed tracker projectArduino based vehicle speed tracker project
Arduino based vehicle speed tracker project
 
NO1 Pandit Amil Baba In Bahawalpur, Sargodha, Sialkot, Sheikhupura, Rahim Yar...
NO1 Pandit Amil Baba In Bahawalpur, Sargodha, Sialkot, Sheikhupura, Rahim Yar...NO1 Pandit Amil Baba In Bahawalpur, Sargodha, Sialkot, Sheikhupura, Rahim Yar...
NO1 Pandit Amil Baba In Bahawalpur, Sargodha, Sialkot, Sheikhupura, Rahim Yar...
 
CFD Simulation of By-pass Flow in a HRSG module by R&R Consult.pptx
CFD Simulation of By-pass Flow in a HRSG module by R&R Consult.pptxCFD Simulation of By-pass Flow in a HRSG module by R&R Consult.pptx
CFD Simulation of By-pass Flow in a HRSG module by R&R Consult.pptx
 
Fruit shop management system project report.pdf
Fruit shop management system project report.pdfFruit shop management system project report.pdf
Fruit shop management system project report.pdf
 
Online resume builder management system project report.pdf
Online resume builder management system project report.pdfOnline resume builder management system project report.pdf
Online resume builder management system project report.pdf
 
Pharmacy management system project report..pdf
Pharmacy management system project report..pdfPharmacy management system project report..pdf
Pharmacy management system project report..pdf
 
KIT-601 Lecture Notes-UNIT-5.pdf Frame Works and Visualization
KIT-601 Lecture Notes-UNIT-5.pdf Frame Works and VisualizationKIT-601 Lecture Notes-UNIT-5.pdf Frame Works and Visualization
KIT-601 Lecture Notes-UNIT-5.pdf Frame Works and Visualization
 

Probability and Statistics part 2.pdf

  • 1. Probability and Statistics FE Exam Prep Course © 2018 Professional Publications, Inc.
  • 2. PROBABILITY AND STATISTICS • Combinations and Permutations • Sets • Probability • Laws of Probability • Measures of Central Tendency • Measures of Dispersion • Expected Values • Probability Density Functions • Probability Distribution Functions • Probability Distributions • Sums of Random Variables • Hypothesis Testing • Linear Regression © 2018 Professional Publications, Inc. 35 Lesson Overview
  • 3. PROBABILITY AND STATISTICS mode the value that occurs most frequently in the sample set median the point in the sample set at which there are equal numbers of samples above and below mean the sum of all samples in the set divided by the number of samples © 2018 Professional Publications, Inc. 36 Measures of Central Tendency
  • 4. PROBABILITY AND STATISTICS What are the mode, the median, and the mean of the following data? 61, 62, 63, 63, 64, 64, 66, 66, 68, 68, 68, 68, 68, 69, 69, 69, 69, 70, 70, 70, 70, 71, 71, 71, 73, 74, 74, 75, 76, 79 © 2018 Professional Publications, Inc. 37 Example: Measures of Central Tendency
  • 5. PROBABILITY AND STATISTICS What are the mode, the median, and the mean of the following data? 61, 62, 63, 63, 64, 64, 66, 66, 68, 68, 68, 68, 68, 69, 69, 69, 69, 70, 70, 70, 70, 71, 71, 71, 73, 74, 74, 75, 76, 79 Solution The mode is the most common value among the data, which is 68. There are 30 numbers. The median is the mean average of the 15th and 16th numbers, which is 69. The mean is found by adding all the numbers and dividing by 30, which gives 68.96. © 2018 Professional Publications, Inc. 38 Example: Measures of Central Tendency
  • 6. PROBABILITY AND STATISTICS weighted arithmetic mean • used when some data are more significant than others • wi = weight assigned to datum Xi © 2018 Professional Publications, Inc. 39 Measures of Central Tendency
  • 7. PROBABILITY AND STATISTICS Three observations, 62, 64, and 72, are given weights of 4, 3, and 2, respectively. Most nearly, what is the weighted arithmetic mean of these data? (A) 65 (B) 66 (C) 68 (D) 69 © 2018 Professional Publications, Inc. 40 Example: Measures of Central Tendency
  • 8. PROBABILITY AND STATISTICS Three observations, 62, 64, and 72, are given weights of 4, 3, and 2, respectively. Most nearly, what is the weighted arithmetic mean of these data? (A) 65 (B) 66 (C) 68 (D) 69 Solution The weighted arithmetic mean is 65. The answer is (A). © 2018 Professional Publications, Inc. 41 Example: Measures of Central Tendency            4 62 3 64 2 72 4 3 2 64.89 65 i i w i w X X w         
  • 9. PROBABILITY AND STATISTICS geometric mean of the sample • the number that, when raised to the power of the sample size, gives the product of all samples • used when data are consecutive multipliers in other calculations root-mean-square value • the square root of the arithmetic mean of the squares of all samples © 2018 Professional Publications, Inc. 42 Measures of Central Tendency
  • 10. PROBABILITY AND STATISTICS standard deviation, σ measures amount of dispersion in data set • low σ means that data tend to be gathered close to mean value • high σ means that data tend to be spread out over wide range of values standard deviation of total population © 2018 Professional Publications, Inc. 43 Measures of Dispersion
  • 11. PROBABILITY AND STATISTICS sample standard deviation, s estimates standard deviation based on a limited number of samples taken from a data set © 2018 Professional Publications, Inc. 44 Measures of Dispersion
  • 12. PROBABILITY AND STATISTICS variance the square of the standard deviation population variance, σ2 sample variance, s2 © 2018 Professional Publications, Inc. 45 Measures of Dispersion
  • 13. PROBABILITY AND STATISTICS What is the population variance and standard deviation of the following data? 61, 62, 63, 63, 64, 64, 66, 66, 67, 68, 68, 68, 68, 69, 69, 69, 69, 70, 70, 70, 70, 71, 71, 72, 73, 74, 74, 75, 76, 79 © 2018 Professional Publications, Inc. 46 Example: Measures of Dispersion
  • 14. PROBABILITY AND STATISTICS What is the population variance and standard deviation of the following data? 61, 62, 63, 63, 64, 64, 66, 66, 67, 68, 68, 68, 68, 69, 69, 69, 69, 70, 70, 70, 70, 71, 71, 72, 73, 74, 74, 75, 76, 79 Solution Use the equation for population variance. © 2018 Professional Publications, Inc. 47 Example: Measures of Dispersion   2 2 1 1 N i i X N      
  • 15. PROBABILITY AND STATISTICS expected value variance © 2018 Professional Publications, Inc. 48 Expected Values standard deviation
  • 16. PROBABILITY AND STATISTICS • Combinations and Permutations • Sets • Probability • Laws of Probability • Measures of Central Tendency • Measures of Dispersion • Expected Values • Probability Density Functions • Probability Distribution Functions • Probability Distributions • Sums of Random Variables • Hypothesis Testing • Linear Regression © 2018 Professional Publications, Inc. 49 Lesson Overview