Download as PDF, PPTX
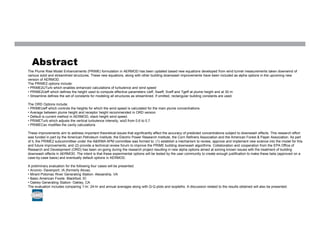
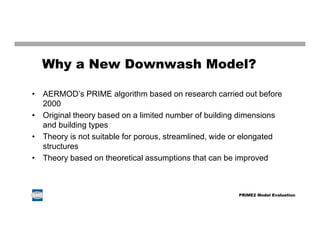

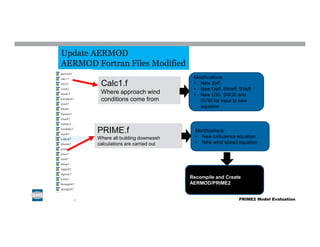
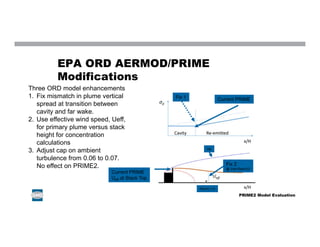
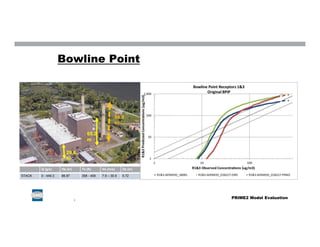
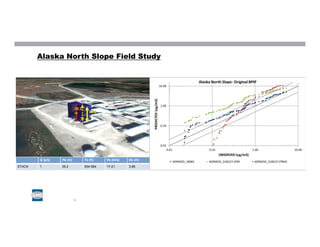
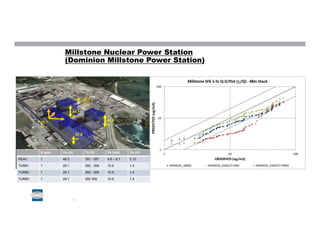
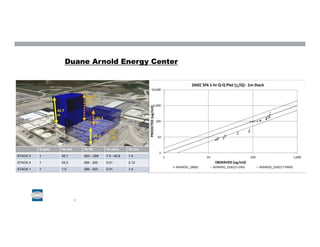
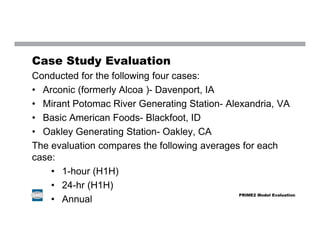
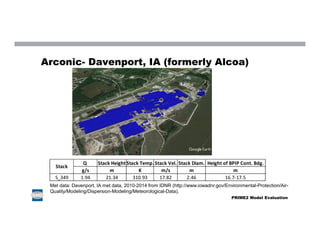
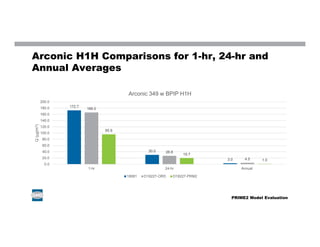
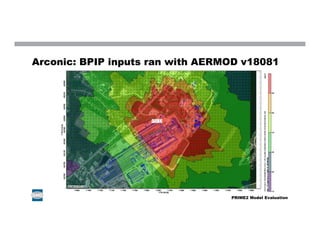
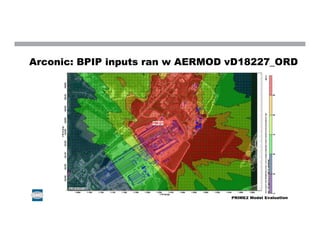
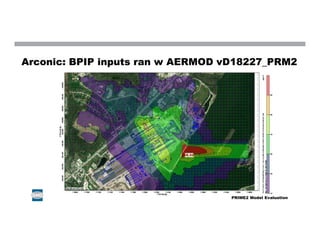
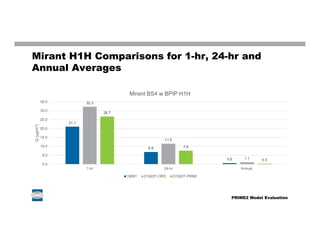
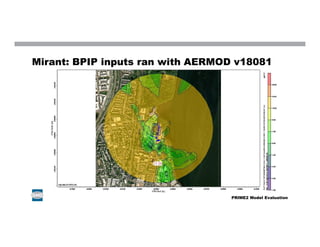
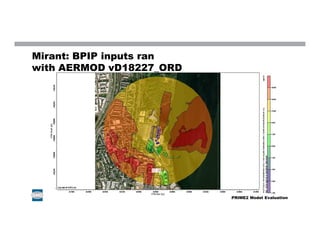
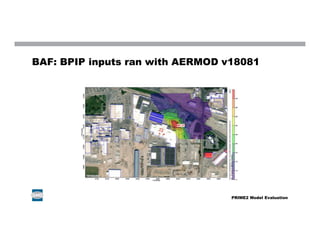
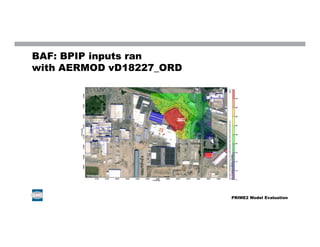
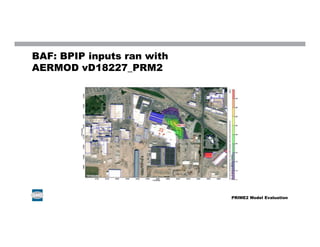
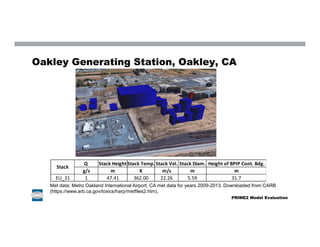
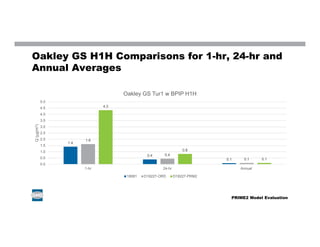
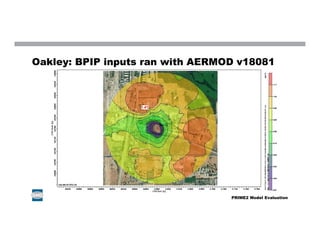
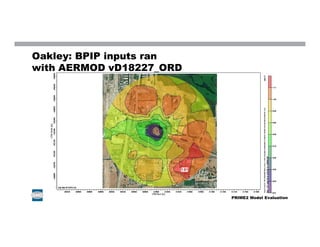
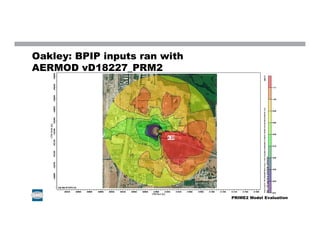


The document discusses improvements to the AERMOD plume rise model, specifically the PRIME2 enhancements, which include new calculations for turbulence and wind speed. These advancements aim to correct inaccuracies in predicted concentrations affected by building downwash effects, as supported by collaboration with the EPA and various industry associations. A preliminary evaluation for four case studies highlights the comparative performance of the updated model against previous versions, indicating inconsistencies in predicted concentrations across different scenarios.