A study of psychographic variables proposed for segmentation for personal care products through factor analysis
•
1 like•101 views


Recommended
More Related Content
Viewers also liked
Viewers also liked (20)
Similar to A study of psychographic variables proposed for segmentation for personal care products through factor analysis
Similar to A study of psychographic variables proposed for segmentation for personal care products through factor analysis (20)
More from Alexander Decker
More from Alexander Decker (20)
A study of psychographic variables proposed for segmentation for personal care products through factor analysis
- 1. European Journal of Business and Management www.iiste.org ISSN 2222-1905 (Paper) ISSN 2222-2839 (Online) Vol.6, No.14, 2014 214 A Study of Psychographic Variables Proposed for Segmentation for Personal Care Products through Factor Analysis Dr. (Mrs.) Kiran Mor Professor, Humanities & Social Sciences, NIT Kurukshetra Sulekha Research Scholar Humanities & Social Sciences, NIT Kurukshetra ABSTACT Segmentation is the need of modern marketing because to serve the entire market is no more profitable. The very first step of market segmentation is to identify which variables are most first step of market segmentation is to identify which variables are most important to segment or to group the customers into homogeneous groups. Usually more than one variable is used to give the description of market segments. The most common variables used are demographic, geographic, psychographic, and behaviuoral. In case of personal care products in the present study psychographic variables are taken in to consideration. The human behavior is dominated by the internal psycho of the individual and the way it treat with the society. The main psychographic variables as values, social interest, and attitude are broadly taken into consideration. Factor analysis is used to get the factors affecting the purchase of personal care products. Keywords: Psychographic variables, personal care, factor analysis, segmentation INTRODUCTION in 1964, in “New criteria for market segmentation” Daniel Yankelovich asserted that traditional demographic traits such as age, gender, education and income are no longer enough to serve as the bases for market segmentation. Nowadays non-demographic traits such as value, taste and preferences are more likely to influence customers’ purchase than the demographics. Nowadays, market segmentation strategy has become the most needed strategy of marketing because it is not possible or profitable to serve the whole market with a single product. Market segmentation tends to divide the market according to some specified bases in such a way that each segment or part of market has a specific requirement and need a specific marketing mix. A marketing mix can then be devised to reach the segment identified economically and efficiently. Consumers are different in their demographics, geographic and psychographic aspects. These can be the possible bases of market segmentation. But due to more intensive competition and more demanding consumers, the basis of market segmentation is increasingly complex. The main purpose of psychographic segmentation is based on attitude, lifestyle, value and interest. Lifestyle segmentation has been used for several marketing and advertising purposes (Wells and Tigers, 1977). The most widely used measures of lifestyle segmentation are Rotech’s value survey, List of Values (LOV), Values and life Style (VALS2), and Activities, Interest, and Opinions (AIO).In the present study twenty five psychographic variables are used to segment the consumers. To reduce the data set or to make feasible study explanatory factor analysis was used. By which six meaningful factors are found. OBJECTIVE The main objective of this study is to find out the psychographic factors for segmenting the market for personal care products. RESEARCH METHODOLOGY Data collection: Primary data is collected within the region of Haryana with the help of questionnaire. Sample size and Sampling Design: 400 respondents are selected with multistage random sampling design. Questionnaire: The most widely used measures of lifestyle segmentation are Rotech’s value survey, List of Values (LOV), Values and life Style (VALS2), and Activities, Interest, and Opinions (AIO).In the present study twenty five psychographic variables are used to get the key factor for segmentation in the personal care market. Analytical Tools: Exploratory factor analysis is used for the purpose of the present study. RESULTS AND DISCUSSION For personal care product the factor analysis is done to reduce the data set and to get the variables affecting the purchase behavior of consumers. An explanatory factor analysis was applied on twenty five psychographic variables. In order to apply factor analysis the problem of multi-collinearity is to be checked and correlation coefficient of each and every variable is calculated. Correlation coefficients are not excessively large and each
- 2. European Journal of Business and Management www.iiste.org ISSN 2222-1905 (Paper) ISSN 2222-2839 (Online) Vol.6, No.14, 2014 215 variable is reasonably correlated with other. Therefore none of the variable is drop out however principal component analysis is used for factor that is why there is no problem of multi collinearity. Table 1.1: KMO and Bartlett's Test Kaiser-Meyer-Olkin Measure of Sampling Adequacy. .828 Bartlett's Test of Sphericity Approx. Chi-Square 6680.173 Df 300 Sig. .000 Kaiser (1974) recommends a bare minimum of 0.5 and that values between 0.5 and 0.7 are mediocre, values between 0.7 and 0.8 are good, values between 0.8 and 0.9 are great and values above 0.9 are superb (Hutcheson & Sofroniou, 1999). Here in the present study the value is 0.828, which falls into the range of being great, so we should be confident that the sample size is adequate for factor analysis. Barlett’s measure tests the null hypothesis that the original correlation matrix is an identity matrix. For factor analysis to work there should be some relationship between variables because if correlation matrix were an identity matrix then all correlation coefficients would be zero. Therefore Bartlett’s measure tests that whether there is significant difference relationship or not. Therefore a significant Bartlett’s test tells that null correlation matrix is not an identity matrix. For the present study data, Bartlett’s test is highly significant (p < .001), and therefore factor analysis is appropriate. Table 1.2 : Total Variance Explained Component Initial Eigenvalues Extraction Sums of Squared Loadings Rotation Sums of Squared Loadings Total % of Variance Cumulative % Total % of Variance Cumulative % Total % of Variance Cumulative % dimension0 1 3.923 15.693 15.693 3.923 15.693 15.693 3.860 15.439 15.439 2 2.986 11.943 27.636 2.986 11.943 27.636 2.767 11.067 26.505 3 2.903 11.612 39.248 2.903 11.612 39.248 2.758 11.032 37.538 4 2.783 11.134 50.382 2.783 11.134 50.382 2.623 10.490 48.028 5 2.293 9.173 59.555 2.293 9.173 59.555 2.591 10.364 58.392 6 2.270 9.079 68.634 2.270 9.079 68.634 2.560 10.242 68.634 7 .993 3.971 72.604 8 .940 3.761 76.365 9 .705 2.821 79.186 10 .625 2.501 81.687 11 .598 2.392 84.079 12 .569 2.278 86.357 13 .494 1.976 88.333 14 .465 1.859 90.192 15 .429 1.717 91.909 16 .391 1.563 93.472 17 .390 1.558 95.031 18 .330 1.318 96.349 19 .228 .912 97.261 20 .199 .797 98.057 21 .181 .723 98.780 22 .164 .655 99.435 23 .075 .301 99.736 24 .040 .159 99.894 25 .026 .106 100.000 Extraction Method: Principal Component Analysis. The above table shows that which variable is to retain or which is to discard on the basis of the variance explained by the factors. The above table lists the eigenvalues associated with each linear factor before extraction, after extraction and after rotation. Before extraction 25 linear components were identified. The eigenvalue associated with each factor represent the variance explained by the component. It is clear from the table that the first few factors explain relatively large amount of variance. First factor explain 15.693% of variance, whereas subsequent factors explain small amounts of variance. SPSS then extracts all factors with eigenvalues greater than 1, which leaves us with four factors. The eigenvalues associated with these factors are again displayed (and the percentage of variance explained) in the columns labeled Extraction Sums of Squared Loadings. The values in this part of the table are the same as the values before extraction, except that the values for the discarded factors are ignored (hence, the table is blank after the fourth factor). In the final part of the table (labeled Rotation Sums of Squared Loadings), the eigenvalues of the factors after rotation are displayed. Rotation has the effect of optimizing the factor structure and one consequence for these data is that the relative
- 3. European Journal of Business and Management www.iiste.org ISSN 2222-1905 (Paper) ISSN 2222-2839 (Online) Vol.6, No.14, 2014 216 importance of the six factors is equalized. Before rotation, factor 1 accounted for considerably more variance than the remaining five. The above table of communality show the common variance associated with the variables. The communalities in the column labeled extraction reflect the common variance. It means 70.8% variance is common associated with the first variable. The amount of variance in each variable that can be explained by retained factors is represented by communalities after extraction. Table 1.3 : Communalities Initial Extraction s1 1.000 .708 s2 1.000 .680 s3 1.000 .646 s4 1.000 .857 s5 1.000 .659 s6 1.000 .873 s7 1.000 .879 s8 1.000 .543 s9 1.000 .505 s10 1.000 .719 s11 1.000 .693 s12 1.000 .740 s13 1.000 .685 s14 1.000 .834 s15 1.000 .828 s16 1.000 .459 s17 1.000 .393 s18 1.000 .370 s19 1.000 .770 s20 1.000 .570 s21 1.000 .657 s22 1.000 .868 s23 1.000 .698 s24 1.000 .746 s25 1.000 .779 Extraction Method: Principal Component Analysis.
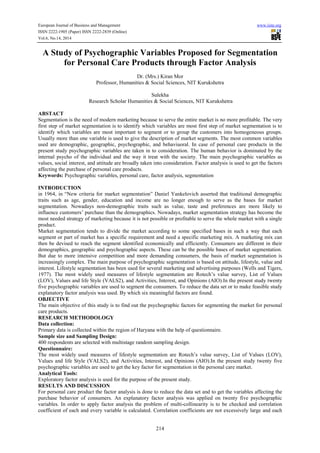
- 4. European Journal of Business and Management www.iiste.org ISSN 2222-1905 (Paper) ISSN 2222-2839 (Online) Vol.6, No.14, 2014 217 Table 1.4 : Component Matrixa Component 1 2 3 4 5 6 s24 .839 s12 .836 s23 .807 s13 .800 s20 .742 s9 .697 s19 .718 s25 .718 s22 -.566 .430 .512 s7 -.559 .456 .498 s18 .551 s16 .550 s17 .503 s1 .635 -.474 s21 .590 -.445 s2 .553 -.502 s10 .552 -.518 s14 .549 .464 -.504 s8 .411 s4 .535 -.576 s15 .494 .430 -.564 s6 -.515 .487 .522 s11 .413 -.467 s5 -.462 s3 .411 -.431 Extraction Method: Principal Component Analysis. a. 6 components extracted. The above table shows the component matrix before extraction and describes the loadings of every variable onto each factor. Most variables load highly onto the first factor. Figure 1.1: Scree Plot The scree plot shown above is difficult to interpret because it begins to tail off after six factors. The table below shows the rotated component matrix which contains the same information as the component matrix but for this matrix the factors are clearly interpreted. If comparison is done between this and before rotation matrix variable
- 5. European Journal of Business and Management www.iiste.org ISSN 2222-1905 (Paper) ISSN 2222-2839 (Online) Vol.6, No.14, 2014 218 and most variable loaded highly onto first factor and the remaining factors did not get a look. This matrix shows that which variable is highly loaded on which factor. Table 1.5 : Rotated Component Matrixa Component 1 2 3 4 5 6 s24 .854 s12 .852 s23 .821 s13 .809 s20 .752 s9 .698 s10 .844 s1 .833 s2 .821 s21 .806 s25 .880 s19 .875 s16 .664 s17 .623 s18 .587 s7 .933 s6 .931 s22 .928 s4 .924 s15 .908 s14 .905 s11 .830 s5 .807 s3 .801 s8 .732 Extraction Method: Principal Component Analysis. Rotation Method: Varimax with Kaiser Normalization. a. Rotation converged in 5 iterations. The table of transformation matrix provides the information about the degree to which factors were rotated to obtain the final solution. If no rotation were necessary this matrix would be identity matrix. If orthogonal rotation were completely appropriate then a symmetrical matrix will appear. Table 1.6 : Component Transformation Matrix Component 1 2 3 4 5 6 1 .977 -.025 .081 .108 -.026 .159 2 -.003 -.163 .807 -.539 .179 -.024 3 -.030 .688 -.037 -.105 .540 .470 4 -.138 -.584 .113 .476 .447 .448 5 -.158 .248 .419 .319 -.644 .471 6 .010 .310 .391 .599 .248 -.575 Extraction Method: Principal Component Analysis. Rotation Method: Varimax with Kaiser Normalization. Here in the present study a principal component analysis was conducted on 25 variables or statements with orthogonal rotation or varimax. The Kaiser- Meyer-Olkin measure verified the sampling adequacy for the analysis, KMO = 0.828 (great according to field, 2009) and all KMO values for individual items were > 0.7, which is above the acceptable limit of 0.5. Bartlett’s test of sphericity χ2 (300) = 6680.173, p < 0.001, indicated that correlations between items were sufficiently large for principal component analysis. An initial analysis was run to obtain the eigenvalues for each factor.
- 6. European Journal of Business and Management www.iiste.org ISSN 2222-1905 (Paper) ISSN 2222-2839 (Online) Vol.6, No.14, 2014 219 Table 1.7: Summary of Exploratory Factor Analysis results for the questionnaire having 25 items related to the consumer psychographic Items Personal values Work values Social interest General attitude for life Prudent Brand conspicuous I feel secure because of current economic situation. 0.844 I respect authority. 0.833 I will consider product value when I buy it. 0.801 I spend a constant amount of money every month. 0.924 I usually buy well-known brands. 0.807 I like a routine life. 0.931 I do not like to take risks. 0.933 I will think things over before I buy a product. 0.732 I am emotional. 0.69 I can usually achieve my goals. 0.821 I like to buy something that can express my status 0.830 I often care about others. 0.852 I have a lot of friends. o.809 I like to go for shopping. 0.905 I usually go for cinema. 0.908 I always ready for debates on public issues. 0.664 I keep my eye on current affairs. 0.623 I am influenced by social media. 0.587 I am interested in national events. 0.875 I always care for my family health in every sense. 0.752 My work emotion will not affect my family. 0.806 I look life as a challenge. 0.928 I love to talk with friends. 0.821 I like to help others. 0.854 I usually participate in social activities. 0.880 Eigenvalues 3.92 2.99 2.90 2.78 2.29 2.27 % of variance 15.69 11.94 11.61 11.13 9.17 9.07 Croanbach α (Reliability) 0.887 0.847 0.783 0.927 0.908 0.807 CONCLUSION The factor analysis retained only six components in the final result and the table below shows the factor loadings after rotation. The items that grouped same factor indicate that factor 1 represent the personal values, factor 2 work values, 3 social interests, 4 general attitude for life, 5 prudent and factor 6 is of brand conspicuous. It is clear from the analysis that these six factors are explaining the unique feature of the different psychographic profiles of consumer searching for personal care products. It is suggested to the marketers that they should use such factors to make their products more close to the consumers. REFERENCES Yu Xia (2011), “Competitive strategies and market segmentation for suppliers with substitutable products”, European Journal of Operational Research, Vol.210, Pages: 194-203. Frank M. Bass, Douglas J. Tigert and Ronald T Lonsdale (1968), “Market segmentation: Group versus Individual behavior”, Journal of marketing research, Vol.5, No.3, Pages: 264-270. Kevin Kuan-Shun Chiu, Ru-Jen Lin, Maxwell K. Hsu and Shih-Chih Chen (2011), “Symbolic and functional brand effects for market segmentation”, Australian Journal of Business and Management Research, Vol.1, No.6, Pages: 75-86.
- 7. European Journal of Business and Management www.iiste.org ISSN 2222-1905 (Paper) ISSN 2222-2839 (Online) Vol.6, No.14, 2014 220 KC Behura and JK Panda (2012), “Rural Marketing of FMCG Companies in India”, VSRD International Journal of Business & Management Research, Vol. 2, No.2, Pages: 66-74. Valters Kaze, Roberts Skapars(2011), “Paradigm shift in consumer segmentation to gain competitive advantages in post-crisis FMCG markets: lifestyle or social values?”, Journal of economics and management, Vol.16, Pages:1266-1273. Ian Wilson and Maria Mukhina (2012), “Market segmentation in Russian subsidiaries of FMCG MNEs Practitioner and academic perspectives”, Marketing Intelligence & Planning, Vol. 30, No. 1, pages: 53-68 D.M. Sezhiyan(2010), “Assessing the Stability of Market Segment – A fuzzy Clustering Approach, IIMS Journal of Management Science, Vol. 1, No. 2, Pages:129-137. Anupam Jain and Meenakshi Sharma (2012), “Brand Awareness and Customer Preferences for FMCG Products in Rural Market: An Empirical Study on the Rural Market of Garhwal Region”, VSRD International Journal of Business and Management, Vol. 2, No. 8, Pages: 434-443. Amandeep singh (2010), “market segmentation in FMCG: time to drive new basis for market segmentation”, International Journal of Research in Commerce and Management, Vol.1, no. 8. Pages: 140-145. Dolnicar S, Freitag R. and Randle M.(2005), “To Segment or Not to Segment? An Investigation of Segmentation Strategy Success Under Varying Market Conditions”, Australasian Marketing Journal, Vol. 13, No. 1, Pages: 20-35.
- 8. The IISTE is a pioneer in the Open-Access hosting service and academic event management. The aim of the firm is Accelerating Global Knowledge Sharing. More information about the firm can be found on the homepage: http://www.iiste.org CALL FOR JOURNAL PAPERS There are more than 30 peer-reviewed academic journals hosted under the hosting platform. Prospective authors of journals can find the submission instruction on the following page: http://www.iiste.org/journals/ All the journals articles are available online to the readers all over the world without financial, legal, or technical barriers other than those inseparable from gaining access to the internet itself. Paper version of the journals is also available upon request of readers and authors. MORE RESOURCES Book publication information: http://www.iiste.org/book/ Recent conferences: http://www.iiste.org/conference/ IISTE Knowledge Sharing Partners EBSCO, Index Copernicus, Ulrich's Periodicals Directory, JournalTOCS, PKP Open Archives Harvester, Bielefeld Academic Search Engine, Elektronische Zeitschriftenbibliothek EZB, Open J-Gate, OCLC WorldCat, Universe Digtial Library , NewJour, Google Scholar