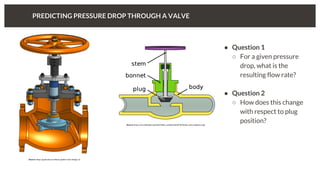
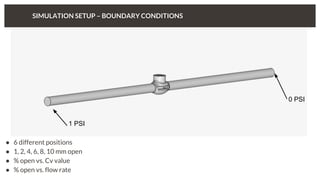
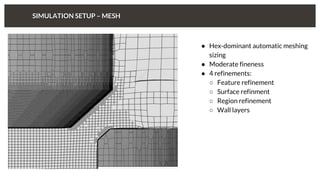
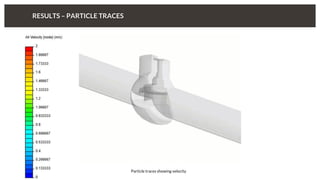
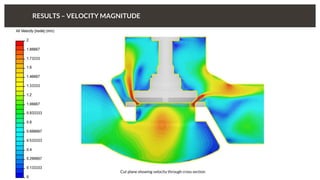
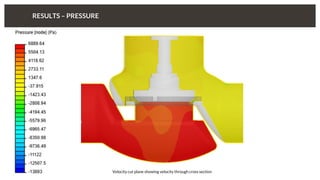
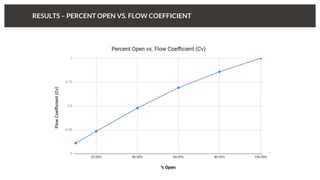
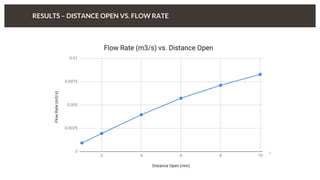
PREDICTING PRESSURE DROP
THROUGH A VALVE
MATT BEMIS
PREDICTING PRESSURE DROP THROUGH A VALVE
● Question 1
○ For a given pressure
drop, what is the
resulting flow rate?
● Question 2
○ How does this change
with respect to plug
position?(Source: https://en.wikipedia.org/wiki/Globe_valve#/media/File:Globe_valve_diagram.svg)
(Source: https://grabcad.com/library/globe-valve-design-2)
GEOMETRY PREPARATION
Original Geometry Simulation-Ready Valve
FLOW VOLUME EXTRACTION
● Inlet/outlet extensions:
○ ANSI standard
● Flow volume extraction:
○ Domain = negative of valve
assembly
WHAT IS THE END GOAL OF THE SIMULATION?
The flow coefficient of a device is a relative
measure of its efficiency at allowing fluid flow.
It describes the relationship between the
pressure drop across an orifice, valve or other
assembly and the corresponding flow rate.Where:
Q = flow rate (GPM)
SG = Specific Gravity (water = 1)
ΔP = Pressure Drop (expressed in psi)
VALVE POSITION VS. FLOW CHARACTERISTICS
● Globe valve
● Develop flow coefficient
● % valve open vs. % of full flow
(Source: http://www.industrialcontrolsonline.com/sites/default/files/infotech/Infotec33/image002.gif)
SETUP
SIMULATION SETUP – BOUNDARY CONDITIONS
1 PSI
0 PSI
● 6 different positions
● 1, 2, 4, 6, 8, 10 mm open
● % open vs. Cv value
● % open vs. flow rate
SIMULATION SETUP – MESH
● Hex-dominant automatic meshing
sizing
● Moderate fineness
● 4 refinements:
○ Feature refinement
○ Surface refinment
○ Region refinement
○ Wall layers
SIMULATION SETUP – RESULT CONTROL
RESULTS – PARTICLE TRACES
Particle traces showing velocity
RESULTS – VELOCITY MAGNITUDE
Cut plane showing velocity through cross section
RESULTS – PRESSURE
Velocity cut plane showing velocity through cross section
RESULTS – PERCENT OPEN VS. FLOW COEFFICIENT
RESULTS – DISTANCE OPEN VS. FLOW RATE
RESULTS – VALVE POSITION VS. PLUG FORCE
Pressure Drop Through a Valve Using CFD

Pressure Drop Through a Valve Using CFD

  • 1.
  • 2.
    PREDICTING PRESSURE DROPTHROUGH A VALVE ● Question 1 ○ For a given pressure drop, what is the resulting flow rate? ● Question 2 ○ How does this change with respect to plug position?(Source: https://en.wikipedia.org/wiki/Globe_valve#/media/File:Globe_valve_diagram.svg) (Source: https://grabcad.com/library/globe-valve-design-2)
  • 3.
  • 4.
    FLOW VOLUME EXTRACTION ●Inlet/outlet extensions: ○ ANSI standard ● Flow volume extraction: ○ Domain = negative of valve assembly
  • 5.
    WHAT IS THEEND GOAL OF THE SIMULATION? The flow coefficient of a device is a relative measure of its efficiency at allowing fluid flow. It describes the relationship between the pressure drop across an orifice, valve or other assembly and the corresponding flow rate.Where: Q = flow rate (GPM) SG = Specific Gravity (water = 1) ΔP = Pressure Drop (expressed in psi)
  • 6.
    VALVE POSITION VS.FLOW CHARACTERISTICS ● Globe valve ● Develop flow coefficient ● % valve open vs. % of full flow (Source: http://www.industrialcontrolsonline.com/sites/default/files/infotech/Infotec33/image002.gif)
  • 7.
  • 8.
    SIMULATION SETUP –BOUNDARY CONDITIONS 1 PSI 0 PSI ● 6 different positions ● 1, 2, 4, 6, 8, 10 mm open ● % open vs. Cv value ● % open vs. flow rate
  • 9.
    SIMULATION SETUP –MESH ● Hex-dominant automatic meshing sizing ● Moderate fineness ● 4 refinements: ○ Feature refinement ○ Surface refinment ○ Region refinement ○ Wall layers
  • 10.
    SIMULATION SETUP –RESULT CONTROL
  • 13.
    RESULTS – PARTICLETRACES Particle traces showing velocity
  • 14.
    RESULTS – VELOCITYMAGNITUDE Cut plane showing velocity through cross section
  • 15.
    RESULTS – PRESSURE Velocitycut plane showing velocity through cross section
  • 16.
    RESULTS – PERCENTOPEN VS. FLOW COEFFICIENT
  • 17.
    RESULTS – DISTANCEOPEN VS. FLOW RATE
  • 18.
    RESULTS – VALVEPOSITION VS. PLUG FORCE