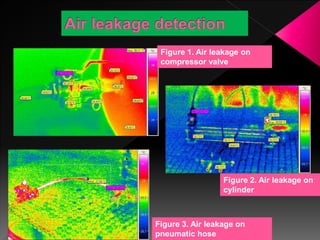
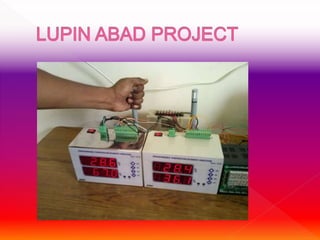
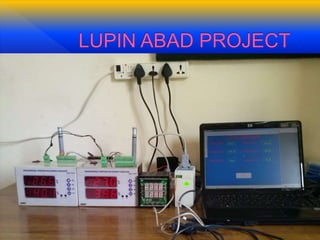
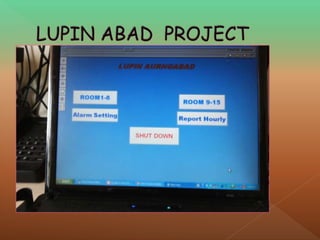
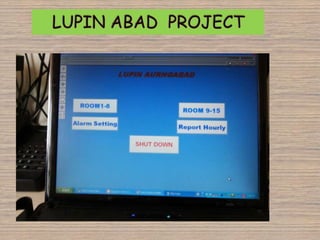
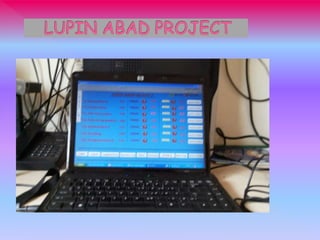
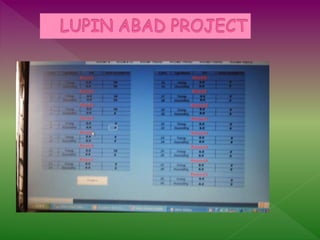
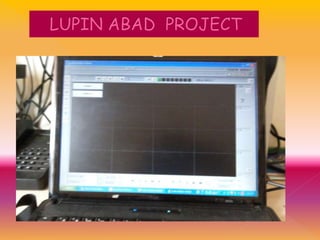
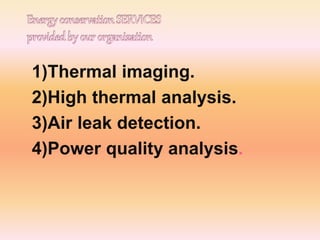
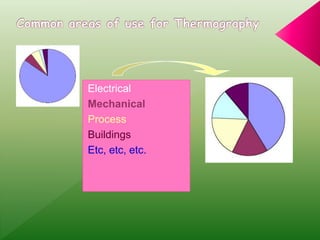
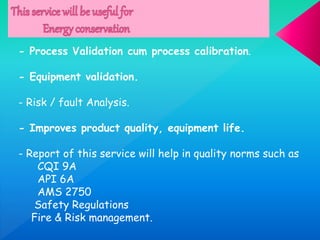
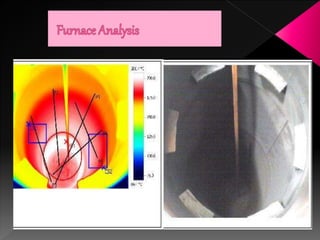
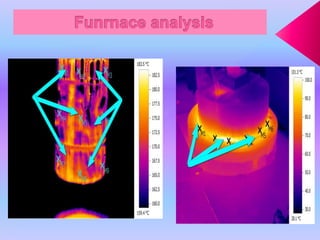
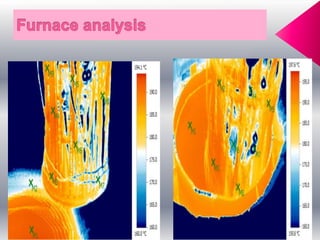
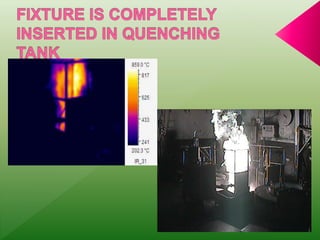
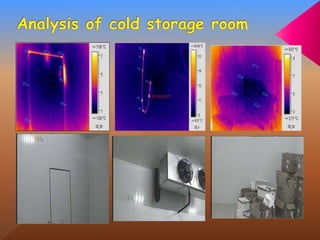
ITS Group provides instrumentation and technical services including servicing, instrument calibration, predictive and preventive maintenance studies, customized projects, trading, and vibration analysis. The company was founded in 1991 and is located in Pune, India. Services include thermal imaging, high thermal analysis, air leak detection, power quality analysis, and customized instrumentation projects such as SCADA systems. The document discusses various instrumentation techniques and applications.


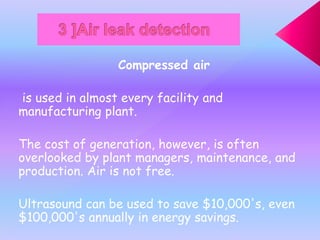
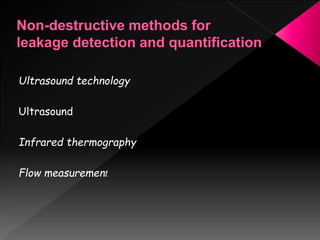
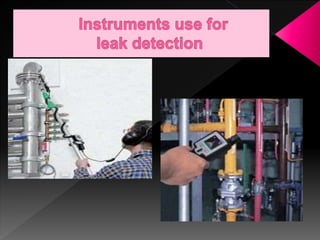
![Several methods are most popular in the practical
detection of com-pressed air leaks:
– detection of leaks based on sensory perception,
– detection of leaks by bubble test [10],
– ultrasound leak detection, and
– infrared leak detection.](https://image.slidesharecdn.com/41ede379-a36e-45d5-af8c-28f2103ffba4-161122053444/85/PRESETATIONS-27-320.jpg)