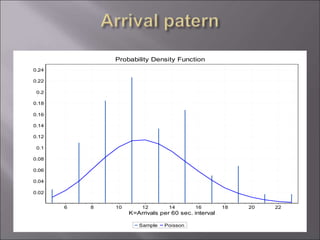
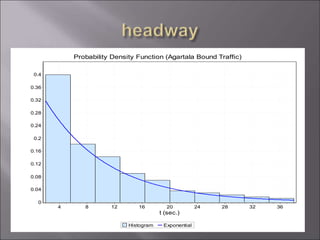
The document presents a study on quantifying the level of service of a typical two-lane highway. Traffic data was collected through classified volume counts, spot speed surveys, and videographic techniques on NH-44 near Agartala, India. Analysis of the data showed hourly traffic variations with peak periods. Speed distributions were established and fitted to normal curves. Vehicle arrival patterns were found to follow a Poisson distribution. Speed-flow relationships were developed using regression analysis. The study aims to help establish parameters for evaluating level of service on two-lane highways with mixed traffic conditions.
This document discusses fundamentals of traffic flow and queuing theory. It defines traffic flow parameters for uninterrupted and interrupted traffic streams. It describes traffic flow, speed, and density measurements including volume, time headway, average and space mean speed, and density. It presents speed-density, flow-density, and speed-flow models and discusses macroscopic and microscopic traffic flow approaches. It also introduces Greenshields and Greenberg traffic flow models and how to calibrate macroscopic models using linear regression analysis.
Traffic enginering highway capacity and los presentationDanilign Mekonnen
This document provides an overview of highway capacity and level of service analysis for multilane highways. It defines key terms like capacity, level of service, and qualitative service categories. It also outlines the methodology for determining the level of service for a multilane highway, which involves calculating the free-flow speed, flow rate, density, and matching the density to the appropriate level of service category. An example problem demonstrates how to apply the methodology to analyze field data and determine the peak hour level of service, speed, and density for a highway segment.
Operatioal analysis of any road is necessary for its design,planning and implementation procedure.This article mostly deals with preliminary proposal of two lane road of eastern region of Nepal.due to increased traffic condition servicabilty and level of service of koshi higway is found to be very poor hence Dharan submetropolitan city's part is analysed.
This document summarizes the key aspects and objectives of conducting traffic surveys. It discusses that traffic surveys are important for transportation engineers to plan and design traffic facilities, determine the need for traffic control devices, study the effectiveness of schemes, diagnose situations and find solutions, and forecast the effects of strategies. The document then outlines different types of traffic surveys, including studies of traffic volumes, speeds, densities, occupancies, axle loads, street and intersection capacities, travel demand, road user costs, parking supply and demand, road features, and accidents. It provides details on the objectives and methodology of conducting traffic volume studies specifically.
Lec 12 Capacity Analysis (Transportation Engineering Dr.Lina Shbeeb)Hossam Shafiq I
This document discusses various concepts in transportation engineering related to traffic flow theory and capacity analysis. It provides definitions and examples of key terms including:
- Average daily traffic and peak hour factors which are used to determine directional design hourly volume
- Applications of traffic flow theory such as determining turning lane lengths and delays
- Level of service which is a qualitative measure of operational conditions within a traffic stream
- Capacity, which is the maximum hourly rate of vehicles that can reasonably pass a point under prevailing conditions
- Methods for calculating capacity and adjusting for factors like lane width, lateral clearance, and heavy vehicles using equations from the Highway Capacity Manual.
This document discusses traffic engineering and highway drainage. It covers topics such as traffic studies including volume, speed, parking and accident studies. It also discusses traffic management and control devices. For highway drainage, it discusses the necessity of drainage systems and types of surface and subsurface drainage. Traffic flow fundamentals and characteristics of road users and vehicles are also covered. The document provides details on different types of parking studies and causes and analysis of traffic accidents.
This document provides an overview of traffic engineering studies and concepts related to an exit exam tutorial. It discusses topics like traffic flow elements, flow-density relationships, highway capacity, level of service, traffic control devices, and traffic signal systems. It also provides sample questions related to traffic flow modeling concepts developed by Greenshields and Greenberg, as well as questions about traffic volume studies, characteristics of traffic like average daily traffic and peak hour volume, and vehicle classification.
This document discusses applications of headway models in traffic analysis. Headway data was collected for traffic flows ranging from 170 to 750 vehicles per hour on a two-lane roadway. The hyperlang model and shifted negative exponential model were fitted to the observed headway distributions. The composite exponential model provided a good fit for flows from 170-750 vph. The shifted negative exponential model fit lower flows where most vehicles were free-moving. The parameters of the composite exponential model trended with traffic flow, allowing estimation of parameters for unmonitored flows. Applications demonstrated include justifying pedestrian crossing needs, predicting vehicle arrival patterns, testing flow randomness, and timing traffic signals.
Headway distribution on urban roads under heterogeneous traffic-revision 3 10...YAHAMPATHARACHCHIGEP
This document discusses headway distribution on urban roads under heterogeneous traffic conditions. It begins by defining headway and different types of headways (time and space headway). It describes the importance of modeling headway data for applications like congestion prediction and capacity analysis. The document outlines objectives to identify efficient headway distributions under different flow rates in Sri Lanka and develop probability density functions to model headway distribution under heterogeneous conditions. It discusses factors that influence headway distribution like traffic volume and vehicle mix. The document proposes methodology for data collection, analysis and headway distribution modeling which includes identifying suitable locations, classifying vehicles, developing distributions and using statistical tests to select the best fitting distribution model.
This document summarizes a study on estimating the capacity of two-lane undivided highways. The study involved collecting traffic data on three road sections in India and analyzing the relationships between speed, flow, and density. Flow-density models were developed for each section and used to estimate key parameters like maximum flow rate and optimal density. Passenger car units were also estimated using Chandra's method to account for heterogeneous traffic. The results showed that capacity decreased as lane width decreased, with capacities of 5500, 3700, and 3100 PCU/hr for sections with right-of-way widths of 14m, 9m, and 7m respectively. The study concluded that understanding traffic flow characteristics is important for efficient road design
This document summarizes a student group's traffic volume study project. The group conducted manual counts at a location on Panthapath Street in Dhaka for 20 minutes, counting 1088 vehicles in total. They analyzed the data to determine vehicle types and directional distribution. Estimates were made for average daily traffic and annual average daily traffic based on expansion factors. However, limitations included a lack of 24-hour count data needed to develop an accurate daily traffic fluctuation curve. Recommendations included using automatic counts for better data accuracy and encouraging public transport use to improve the road's level of service.
Traffic volume studies collect data on the number of vehicles and pedestrians passing a point on a roadway over a period of time. This data is used for planning, design, and operations purposes. There are manual and automatic methods for conducting these studies. Manual methods involve human counters while automatic methods use sensors. The data collected is used to determine metrics like average daily traffic, peak hour volumes, and directional distribution which are then used for roadway design and traffic management.
This document summarizes a study of traffic flow characteristics for heterogeneous traffic in India. Speed, flow, and time headway data were collected from a six-lane urban road and analyzed. Headways between different vehicle combinations were found to best fit several statistical distributions. Speed-flow curves were plotted to determine the speed at which optimal flow occurs, though the study was limited by only using one hour of data. The results provide insight into modeling headways and understanding traffic flow in heterogeneous, mixed traffic conditions.
Traffic engineering is the science of measuring and studying traffic flow in order to safely and efficiently manage vehicle and people movement. The objectives of traffic engineering are to achieve free flowing traffic and reduce accidents. Some key aspects of traffic engineering include conducting traffic studies to analyze characteristics, planning and designing road geometry, implementing traffic control devices, and educating road users. Traffic studies measure factors like volume, speed, origin-destination, and flow characteristics to determine appropriate road facilities and control measures. Understanding traffic patterns helps engineers design efficient transportation systems.
Capacity & level of service (transportation engineering)Civil Zone
This document discusses highway design speed and level of service. It defines design speed as the maximum safe speed for a road based on its geometric design features. Level of service is a qualitative measure of traffic conditions on a roadway, ranging from free-flowing traffic at LOS A to congested traffic at LOS F. The document provides examples of calculating level of service for a highway based on factors like lane width, access points, and traffic volume using methods from the Highway Capacity Manual. It shows how changes to the road design, such as adding lanes or widening lanes, can improve the level of service.
CHAPTER 5 Highway capacity and level of service.pptmihiretuTefera
This document discusses determining the capacity and level of service of highways. It provides definitions for key terms like capacity, level of service, and service flow rate. It describes the six levels of service from A to F and factors that affect them like speed, density, and volume-to-capacity ratio. Methods are presented for calculating a highway's service flow rate, adjusting it for lane width and vehicle type, and determining the number of lanes needed based on traffic volumes and desired level of service. An example problem demonstrates applying these concepts to find a highway's current and future levels of service over a 20-year period.
CHAPTER 5 Highway capacity and level of service.pptmihiretuTefera
This document discusses determining the capacity and level of service of highways. It provides definitions for key terms like capacity, level of service, and service flow rate. It describes the six levels of service from A to F and factors that affect level of service like speed, density, and volume-to-capacity ratio. Equations are given for calculating service flow rates based on number of lanes, adjustment factors, and peak hour factors. An example problem demonstrates determining current and future levels of service given traffic growth rates.
PROPOSED INTELLIGENT TRANSPORT SYSTEM DEPLOYMENTS IN KAJANG CITY664601
This document discusses the proposed implementation of an Intelligent Transportation System (ITS) in Kajang, Malaysia to address traffic congestion issues. It outlines the study methodology, including manual traffic counts at three intersections. It analyzes the traffic flow data to determine saturation flow rates and optimal cycle times. The document then provides an overview of the overall ITS architecture, including the logical and physical architecture layers and components. These include adaptive traffic control systems, surveillance cameras, variable message signs, and communication systems. The goal of the proposed ITS is to streamline traffic flow and reduce travel times in Kajang.
LAFINHAN O. O. FINAL YEAR PROJECT PRESENTATIONTobi Lafinhan
This document summarizes a student's final year project presentation on designing a pre-timed traffic signal at the University of Ibadan main gate intersection. The student conducted traffic studies at the intersection, collecting data on vehicle and pedestrian volumes during morning and afternoon peak periods. Analysis of this data showed high traffic volumes and justified the need for a traffic signal. The student then designed the signal, determining the optimal cycle length, phase timings and other parameters. The presentation concludes with recommendations and the project's contributions to knowledge on traffic conditions at this intersection.
Detailed description of Capacity and Level of service of Multi lane highways based on Highway Capacity Manual (HCM2010) along with one example for finding LOS of a highway
The document discusses platoon dispersion of heterogeneous traffic on a corridor in Chennai, India. Data on platoon sizes and travel times was collected at distances of 200-1400m between intersections under fixed-time signal control. Platoon sizes decreased with distance due to differences in vehicle speeds and interactions. The average travel speed was 46km/hr. Robertson's platoon dispersion model with a smoothing factor of 0.878 provided the best fit to the data. Traffic composition and distances between six intersections on the study corridor are also presented.
This document describes the process for analyzing and determining the level of service of weaving, merging, and diverging segments on highways. It involves 8 steps: 1) collecting input data, 2) determining flow rates, 3) determining the configuration, 4) calculating maximum weaving length, 5) determining capacity, 6) calculating total lane changing, 7) determining average speed, and 8) calculating density to determine the LOS. An example problem is also provided to demonstrate applying the 8-step process to analyze a weaving segment on an urban freeway.
The document discusses traffic stream characteristics and parameters. There are five key points:
1. There are macroscopic and microscopic parameters that describe traffic streams. Macroscopic parameters include flow, speed, and density, which describe the overall traffic stream. Microscopic parameters describe individual vehicles, such as time and space headways.
2. Flow is the number of vehicles passing per unit of time. Speed can be measured as time mean speed or space mean speed. Density is the number of vehicles per length of road.
3. The relationships between flow, speed, and density can be represented with fundamental diagrams - the flow-density curve shows the parabolic relationship between flow and density, with maximum flow occurring at a critical
The International Journal of Engineering & Science is aimed at providing a platform for researchers, engineers, scientists, or educators to publish their original research results, to exchange new ideas, to disseminate information in innovative designs, engineering experiences and technological skills. It is also the Journal's objective to promote engineering and technology education. All papers submitted to the Journal will be blind peer-reviewed. Only original articles will be published.
The papers for publication in The International Journal of Engineering& Science are selected through rigorous peer reviews to ensure originality, timeliness, relevance, and readability.
Practical eLearning Makeovers for EveryoneBianca Woods
Welcome to Practical eLearning Makeovers for Everyone. In this presentation, we’ll take a look at a bunch of easy-to-use visual design tips and tricks. And we’ll do this by using them to spruce up some eLearning screens that are in dire need of a new look.
More Related Content
Similar to Presentationpraloyfinalyearlastproject.ppt
This document discusses applications of headway models in traffic analysis. Headway data was collected for traffic flows ranging from 170 to 750 vehicles per hour on a two-lane roadway. The hyperlang model and shifted negative exponential model were fitted to the observed headway distributions. The composite exponential model provided a good fit for flows from 170-750 vph. The shifted negative exponential model fit lower flows where most vehicles were free-moving. The parameters of the composite exponential model trended with traffic flow, allowing estimation of parameters for unmonitored flows. Applications demonstrated include justifying pedestrian crossing needs, predicting vehicle arrival patterns, testing flow randomness, and timing traffic signals.
Headway distribution on urban roads under heterogeneous traffic-revision 3 10...YAHAMPATHARACHCHIGEP
This document discusses headway distribution on urban roads under heterogeneous traffic conditions. It begins by defining headway and different types of headways (time and space headway). It describes the importance of modeling headway data for applications like congestion prediction and capacity analysis. The document outlines objectives to identify efficient headway distributions under different flow rates in Sri Lanka and develop probability density functions to model headway distribution under heterogeneous conditions. It discusses factors that influence headway distribution like traffic volume and vehicle mix. The document proposes methodology for data collection, analysis and headway distribution modeling which includes identifying suitable locations, classifying vehicles, developing distributions and using statistical tests to select the best fitting distribution model.
This document summarizes a study on estimating the capacity of two-lane undivided highways. The study involved collecting traffic data on three road sections in India and analyzing the relationships between speed, flow, and density. Flow-density models were developed for each section and used to estimate key parameters like maximum flow rate and optimal density. Passenger car units were also estimated using Chandra's method to account for heterogeneous traffic. The results showed that capacity decreased as lane width decreased, with capacities of 5500, 3700, and 3100 PCU/hr for sections with right-of-way widths of 14m, 9m, and 7m respectively. The study concluded that understanding traffic flow characteristics is important for efficient road design
This document summarizes a student group's traffic volume study project. The group conducted manual counts at a location on Panthapath Street in Dhaka for 20 minutes, counting 1088 vehicles in total. They analyzed the data to determine vehicle types and directional distribution. Estimates were made for average daily traffic and annual average daily traffic based on expansion factors. However, limitations included a lack of 24-hour count data needed to develop an accurate daily traffic fluctuation curve. Recommendations included using automatic counts for better data accuracy and encouraging public transport use to improve the road's level of service.
Traffic volume studies collect data on the number of vehicles and pedestrians passing a point on a roadway over a period of time. This data is used for planning, design, and operations purposes. There are manual and automatic methods for conducting these studies. Manual methods involve human counters while automatic methods use sensors. The data collected is used to determine metrics like average daily traffic, peak hour volumes, and directional distribution which are then used for roadway design and traffic management.
This document summarizes a study of traffic flow characteristics for heterogeneous traffic in India. Speed, flow, and time headway data were collected from a six-lane urban road and analyzed. Headways between different vehicle combinations were found to best fit several statistical distributions. Speed-flow curves were plotted to determine the speed at which optimal flow occurs, though the study was limited by only using one hour of data. The results provide insight into modeling headways and understanding traffic flow in heterogeneous, mixed traffic conditions.
Traffic engineering is the science of measuring and studying traffic flow in order to safely and efficiently manage vehicle and people movement. The objectives of traffic engineering are to achieve free flowing traffic and reduce accidents. Some key aspects of traffic engineering include conducting traffic studies to analyze characteristics, planning and designing road geometry, implementing traffic control devices, and educating road users. Traffic studies measure factors like volume, speed, origin-destination, and flow characteristics to determine appropriate road facilities and control measures. Understanding traffic patterns helps engineers design efficient transportation systems.
Capacity & level of service (transportation engineering)Civil Zone
This document discusses highway design speed and level of service. It defines design speed as the maximum safe speed for a road based on its geometric design features. Level of service is a qualitative measure of traffic conditions on a roadway, ranging from free-flowing traffic at LOS A to congested traffic at LOS F. The document provides examples of calculating level of service for a highway based on factors like lane width, access points, and traffic volume using methods from the Highway Capacity Manual. It shows how changes to the road design, such as adding lanes or widening lanes, can improve the level of service.
CHAPTER 5 Highway capacity and level of service.pptmihiretuTefera
This document discusses determining the capacity and level of service of highways. It provides definitions for key terms like capacity, level of service, and service flow rate. It describes the six levels of service from A to F and factors that affect them like speed, density, and volume-to-capacity ratio. Methods are presented for calculating a highway's service flow rate, adjusting it for lane width and vehicle type, and determining the number of lanes needed based on traffic volumes and desired level of service. An example problem demonstrates applying these concepts to find a highway's current and future levels of service over a 20-year period.
CHAPTER 5 Highway capacity and level of service.pptmihiretuTefera
This document discusses determining the capacity and level of service of highways. It provides definitions for key terms like capacity, level of service, and service flow rate. It describes the six levels of service from A to F and factors that affect level of service like speed, density, and volume-to-capacity ratio. Equations are given for calculating service flow rates based on number of lanes, adjustment factors, and peak hour factors. An example problem demonstrates determining current and future levels of service given traffic growth rates.
PROPOSED INTELLIGENT TRANSPORT SYSTEM DEPLOYMENTS IN KAJANG CITY664601
This document discusses the proposed implementation of an Intelligent Transportation System (ITS) in Kajang, Malaysia to address traffic congestion issues. It outlines the study methodology, including manual traffic counts at three intersections. It analyzes the traffic flow data to determine saturation flow rates and optimal cycle times. The document then provides an overview of the overall ITS architecture, including the logical and physical architecture layers and components. These include adaptive traffic control systems, surveillance cameras, variable message signs, and communication systems. The goal of the proposed ITS is to streamline traffic flow and reduce travel times in Kajang.
LAFINHAN O. O. FINAL YEAR PROJECT PRESENTATIONTobi Lafinhan
This document summarizes a student's final year project presentation on designing a pre-timed traffic signal at the University of Ibadan main gate intersection. The student conducted traffic studies at the intersection, collecting data on vehicle and pedestrian volumes during morning and afternoon peak periods. Analysis of this data showed high traffic volumes and justified the need for a traffic signal. The student then designed the signal, determining the optimal cycle length, phase timings and other parameters. The presentation concludes with recommendations and the project's contributions to knowledge on traffic conditions at this intersection.
Detailed description of Capacity and Level of service of Multi lane highways based on Highway Capacity Manual (HCM2010) along with one example for finding LOS of a highway
The document discusses platoon dispersion of heterogeneous traffic on a corridor in Chennai, India. Data on platoon sizes and travel times was collected at distances of 200-1400m between intersections under fixed-time signal control. Platoon sizes decreased with distance due to differences in vehicle speeds and interactions. The average travel speed was 46km/hr. Robertson's platoon dispersion model with a smoothing factor of 0.878 provided the best fit to the data. Traffic composition and distances between six intersections on the study corridor are also presented.
This document describes the process for analyzing and determining the level of service of weaving, merging, and diverging segments on highways. It involves 8 steps: 1) collecting input data, 2) determining flow rates, 3) determining the configuration, 4) calculating maximum weaving length, 5) determining capacity, 6) calculating total lane changing, 7) determining average speed, and 8) calculating density to determine the LOS. An example problem is also provided to demonstrate applying the 8-step process to analyze a weaving segment on an urban freeway.
The document discusses traffic stream characteristics and parameters. There are five key points:
1. There are macroscopic and microscopic parameters that describe traffic streams. Macroscopic parameters include flow, speed, and density, which describe the overall traffic stream. Microscopic parameters describe individual vehicles, such as time and space headways.
2. Flow is the number of vehicles passing per unit of time. Speed can be measured as time mean speed or space mean speed. Density is the number of vehicles per length of road.
3. The relationships between flow, speed, and density can be represented with fundamental diagrams - the flow-density curve shows the parabolic relationship between flow and density, with maximum flow occurring at a critical
The International Journal of Engineering & Science is aimed at providing a platform for researchers, engineers, scientists, or educators to publish their original research results, to exchange new ideas, to disseminate information in innovative designs, engineering experiences and technological skills. It is also the Journal's objective to promote engineering and technology education. All papers submitted to the Journal will be blind peer-reviewed. Only original articles will be published.
The papers for publication in The International Journal of Engineering& Science are selected through rigorous peer reviews to ensure originality, timeliness, relevance, and readability.
Similar to Presentationpraloyfinalyearlastproject.ppt (20)
Practical eLearning Makeovers for EveryoneBianca Woods
Welcome to Practical eLearning Makeovers for Everyone. In this presentation, we’ll take a look at a bunch of easy-to-use visual design tips and tricks. And we’ll do this by using them to spruce up some eLearning screens that are in dire need of a new look.
International Upcycling Research Network advisory board meeting 4Kyungeun Sung
Slides used for the International Upcycling Research Network advisory board 4 (last one). The project is based at De Montfort University in Leicester, UK, and funded by the Arts and Humanities Research Council.
1. AN APPROACH TO STUDY THE
LEVEL OF SERVICE ON A TYPICAL
TWO LANE HIGHWAY
SUBMITED BY
JAYASHREE KAR (ENROLLMENT NO.-0710110)
PRALOYBRATA RAKSHIT ( ENROLLMENT NO.-0710116)
PRANABESH SEN (ENROLLMENT NO.-0710)
A PROJECT REPORT ON
2. An approach
Rural highway is designed for the design service volume
expressed in terms of PCU/Hr. which corresponds to LOS
B.
PCU factor as per the guidelines is invariably applied
irrespective of the roadway configuration i.e. two lane, four
lane, divided, undivided etc.
It was observed that on a two lane highway it is difficult to
have the desired LOS for any particular volume of traffic
due to reduction of speed and subsequent delay.
An attempt was made to find an approach to quantify LOS
of a two lane road based on certain attributes.
3. On an average day about 90,000 vehicles enter and
exit in Agartala city through the major arterial road NH-44.
NH-44 is popularly known as the Assam-Agartala Road
with a total road length of 333 km between Sabroom to
Shillong.
The configuration is two lane with 1m poorly maintained
earthen shoulder on either side.
Prevailing traffic condition is heterogeneous consisting
of both motorized and non motorized traffic.
An overview
4. Speed-flow and speed-density relationship
should be developed.
Free-flow speed distribution pattern needs to
be established.
Estimation of headway distribution parameter
as a feed data in the simulation model.
Establishing vehicle arrival pattern in a stated
interval of time i.e. 60 s.
To meet the objective
5. As per HCM 2000, free flow speed to be
measured when the traffic flow is low i.e. 200
pc/ h
To develop fundamental traffic flow
relationship, stretch with higher density is
normally preferred.
Straight stretch, horizontal curve and vertical
curve should be studied separately.
Requirements…..
6. It was necessary to conduct classified traffic
volume count to determine hourly variation of
traffic and vehicular composition.
Ch.471+000 near Khyerpur on NH-44 was
selected for the entire study e.g. speed-flow,
speed-density, free-speed, gap-studies and
arrival pattern of vehicle.
How and where???
8. PARAMETERS DESCRIBING TRAFFIC FLOW
Volume (or flow rate i.e. ‘q’): The number of
vehicles passing a fixed point in unit time.
Typical units are veh/day, veh/hr or veh/sec.
Speed (or velocity i.e. ‘v’): The distance travelled
by a vehicle in unit time. Typical units are km/h
(also kmph) or m/s.
Density (or concentration i.e. ‘k’): The number of
vehicles per unit length of lane or road, at a given
time instant. Typical unit is veh/km.
9. Parameters describing traffic flow(contd.)
Headway (or time spacing i.e. ‘h’): The time gap
between successive vehicles in a traffic stream
(actually between the same points on the vehicles, e.g.
front of vehicle). Typical unit is seconds. Can be in
space unit also.
Spacing (or the space headway i.e.‘s’): The
distance between the same physical points (e.g.
front of vehicle) on two successive vehicles in a
traffic lane. Typical unit is m.
10. Parameters describing traffic flow(contd.)
Capacity: The capacity of a facility is the
maximum hourly rate at which persons or
vehicles reasonably can be expected to traverse
a point or a uniform section on a lane or
roadway during a given time period under
prevailing roadway, traffic and control
conditions.
13. Level of service in highway capacity manual
(HCM, 2000) is defined as
“A qualitative measure describing operational
condition within a traffic stream, based on
service measures such as speed and travel time,
freedom to maneuver traffic interruption,
comfort, and convenience.”
14. A– Fee flow, low volumes, high speeds
(100 kph), freedom of manoeurability
B– Stable flow, reasonable freedom to
manoeuvre and speeds (95kph)
C– Still stable flow, speeds (90 kph) and
manoeuvability controlled by higher
volumes
15. D– Approaches unstable flow, tolerable
operating speed (75 kph), little freedom to
manoeuvre
E– Unstable flow, volumes nearing
capacity, low speeds (60 kph)
F-Forced flow, low speed (50 kph), stop and go
operations
33. For free speed study a survey was conducted
on NH-44.
Time duration from 12:00 to 2:00pm was
selected for survey.
Spot speed data were collected by using video
photographic technique.
34. Photo view. Spot Speed Survey is carried out
using video camera on NH-44 near Khayerpur
35. Video Camera
Fig. Layout of spot speed survey location using video photographic survey technique
10 m
AGARTALA JIRANIA
36.
37. Statistical analysis of the observed data was
made to understand the speed characteristics
Speed data grouped into class interval and
Frequency distribution was done.
To determine the percentile speed, cumulative
percentage frequency was plotted so as to
develop the cumulative frequency distribution
curve.
38. The mean speed and standard deviation values were
calculated and were found to be 36 kmph and 13 kmph
respectively.
Important parameters namely 15th percentile speed (V15), 50th
percentile speed (V50), 85th percentile speed (V85), 95th
percentile speed (V95) and Spread Ratio (SR) were calculated
from this distribution and found to be 20, 35, 48.33, 55 kmph
and 0.888 respectively.
V15 is used to determine the lower speed limit whereas V85 is
used for upper speed limits and V95 is used as a design speed
for geometric design of highways
39. The parameter, spread ratio (SR) is used to explain
the normality of the observed data. The SR is
defined as
V85 – V50
SR =
V50 – V15
SR ranges between 0.69 and 1.35 (Dey, et. al., 2006).
Therefore, as the estimated SR value is 0.888, the
observed speed frequency data was fitted to normal
distribution using mean and SD of vehicle speeds.
44. Probability Density Function (Agartala Bound Traffic)
Histogram Exponential
t (sec.)
36
32
28
24
20
16
12
8
4
f(t)
0.4
0.36
0.32
0.28
0.24
0.2
0.16
0.12
0.08
0.04
0
45. Probability Density Function (Jirania Bound Traffic)
Histogram Exponential
t (sec.)
36
32
28
24
20
16
12
8
4
0.36
0.32
0.28
0.24
0.2
0.16
0.12
0.08
0.04
0
46. The distribution pattern of speed frequency and free speed profiles of
different vehicle class were established for NH-44.
The mean speed and 85th percentile speed of the total observation of
speed data was found to be 36 kmph and 48.33 kmph. The distribution
was fitted to normal distribution as the spread ratio was found to be 0.888
(between 0.69 and 1.35). This attributes to the reduction of capacity and
level of service under the existing mixed traffic condition.
It was observed that only for Two Wheeler and Three Wheeler the
estimated free speed distribution can be fitted to normal distribution
based on the estimated SR.
47. To develop speed-flow and speed density
relationship a Survey was conducted
during peak hour from 8:30am to 10:30am.
The survey was done using video
photographic technique.
48. Fig. Layout of video photographic survey
location using video photographic
survey technique
49.
50. The traffic data was extracted from the video
recordings.
The data was entered in the computers for
analysis.
51. Speed-Flow relationships are the basis for the
determination of the capacity of a road.
The theoretical speed-flow curve is a parabola and
maximum flow (capacity) occurs at half the free
speed.
Regression analysis was carried out to study the
relationship between speed and flow.
The scatter diagrams of Space Mean Speed of
different classes of vehicles and corresponding
flows were plotted.
52. To meet the several behavioral requirements like speed-
flow equations must be a decreasing and continuous
functions of flow and the speed-flow equations should
never intersect the x-axis (i.e. the predicted speed should
never reach precisely zero) , an exponential regression fit
was tried.
The free-Speeds obtained from the intercept values of the
speed density relationships were compared with the free-
speeds obtained from the free-speed distributions for
different vehicle category
54. y = -0.0337x + 29.695
R² = 0.0341
0
5
10
15
20
25
30
35
40
45
0 20 40 60 80 100 120 140
SPEED(KMPH)
TRAFFIC DENSITY(PCU/KM)
TRAFFIC DENSITY vs SPEED
COMBINED
Linear (COMBINED)
55. y = -0.1099x + 32.309
R² = 0.2976
0
5
10
15
20
25
30
35
40
45
0 20 40 60 80 100 120 140 160
SPEED(KMPH)
TRAFFIC DENSITY(PCU/KM)
TRAFFIC DENSITY vs SPEED
UP
Linear (UP)
56. y = 0.0838x + 24.419
0
10
20
30
40
50
60
70
0 20 40 60 80 100 120 140 160
SPEED(KMPH)
TRAFFIC DENSITY(PCU/KM)
TRAFFIC DENSITY vs SPEED
DOWN
Linear (DOWN)
57. As the data was collected on particular road and
during a particular time, the observed data was
scattered within a particular zone of LOS leading to
difficulty in having the realistic value of jamming
density.
58.
59. Due to the presence of slow moving vehicle in
the traffic stream, platoon is formed.
In such case, due to the opposing traffic,
vehicle in the platoon following the slow
moving one cannot overtake leading to the
formation of queue.
At that point of time, vehicle in the queue will
try to find a gap opportunity to overtake the
vehicle ahead.
60. As a results speed of the follower vehicle will get
reduced until the overtaking operation is made.
As speed is the most important criteria for determining
the capacity. The value of capacity will definitely be
reduced in the platoon which will ultimately lead to
change in level of service that is change in the quality of
the service.
61. The present study is left with a further scope
of either developing a simulation model or
conducting the same survey work in a
congested road having same configuration i.e.
two lane two way so as to estimate the
capacity.