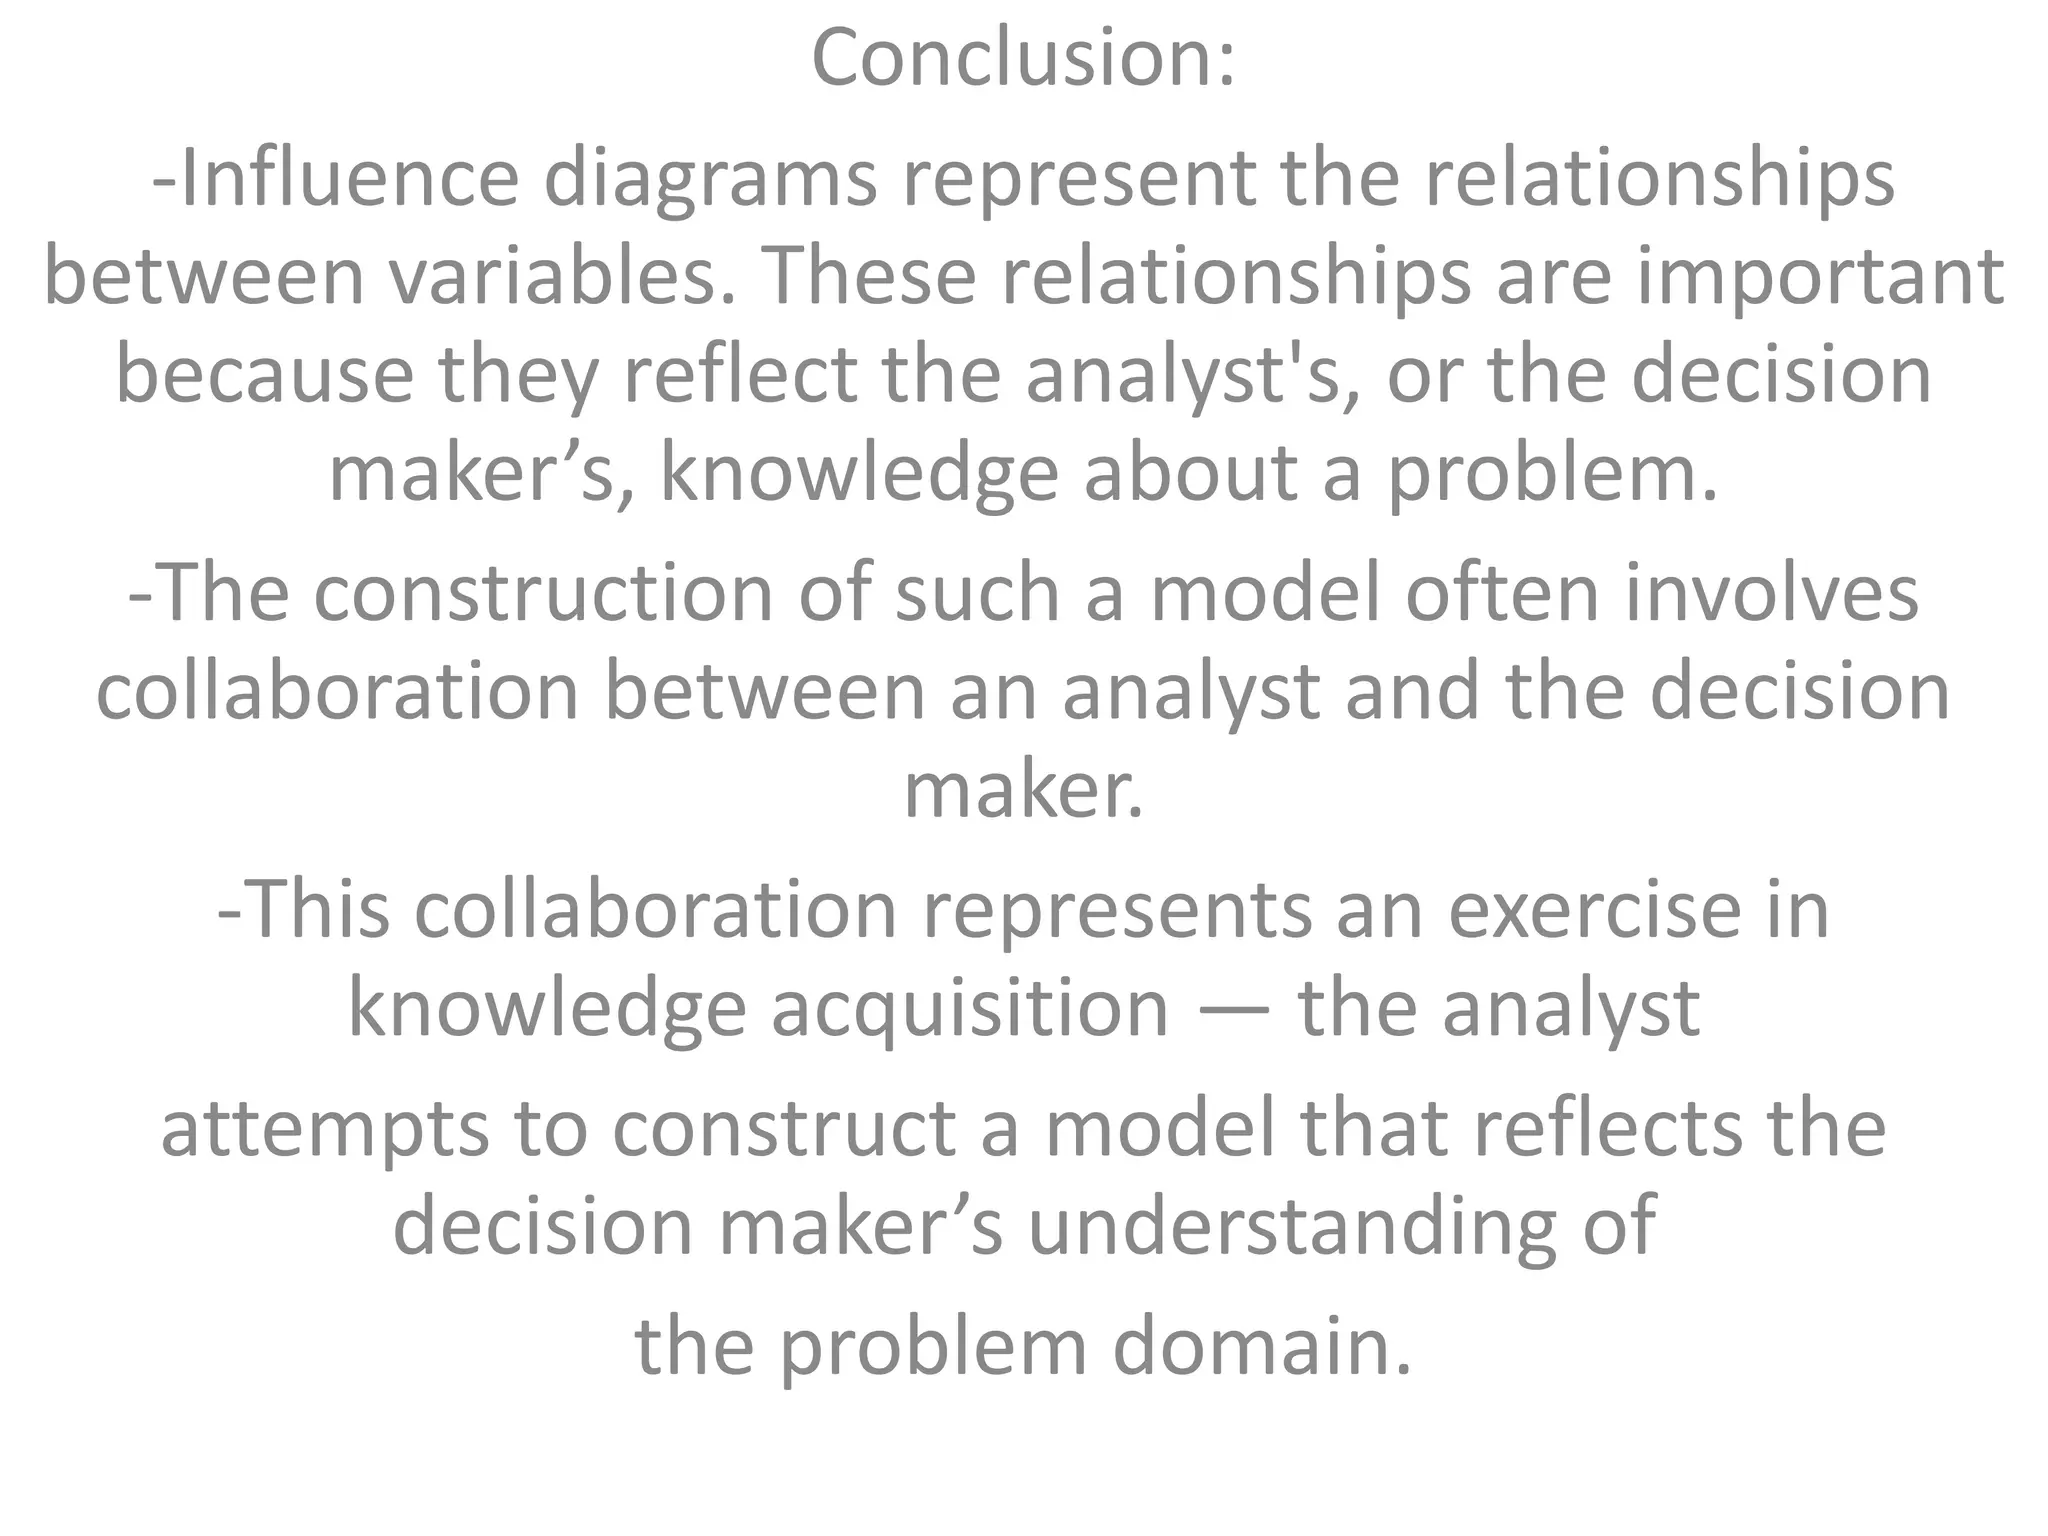
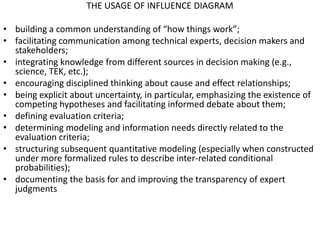
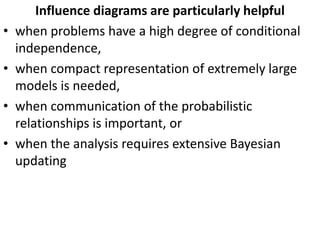
Conclusion:
   -Influence diagrams represent the relationships
between variables. These relationships are important
  because they reflect the analyst's, or the decision
         maker’s, knowledge about a problem.
  -The construction of such a model often involves
 collaboration between an analyst and the decision
                        maker.
     -This collaboration represents an exercise in
         knowledge acquisition — the analyst
   attempts to construct a model that reflects the
          decision maker’s understanding of
                 the problem domain.
THE USAGE OF INFLUENCE DIAGRAM

• building a common understanding of “how things work”;
• facilitating communication among technical experts, decision makers and
  stakeholders;
• integrating knowledge from different sources in decision making (e.g.,
  science, TEK, etc.);
• encouraging disciplined thinking about cause and effect relationships;
• being explicit about uncertainty, in particular, emphasizing the existence of
  competing hypotheses and facilitating informed debate about them;
• defining evaluation criteria;
• determining modeling and information needs directly related to the
  evaluation criteria;
• structuring subsequent quantitative modeling (especially when constructed
  under more formalized rules to describe inter-related conditional
  probabilities);
• documenting the basis for and improving the transparency of expert
  judgments
Influence diagrams are particularly helpful
•   when problems have a high degree of conditional
    independence,
•   when compact representation of extremely large
    models is needed,
•   when communication of the probabilistic
    relationships is important, or
•   when the analysis requires extensive Bayesian
    updating

Presentation1

  • 1.
    Conclusion: -Influence diagrams represent the relationships between variables. These relationships are important because they reflect the analyst's, or the decision maker’s, knowledge about a problem. -The construction of such a model often involves collaboration between an analyst and the decision maker. -This collaboration represents an exercise in knowledge acquisition — the analyst attempts to construct a model that reflects the decision maker’s understanding of the problem domain.
  • 2.
    THE USAGE OFINFLUENCE DIAGRAM • building a common understanding of “how things work”; • facilitating communication among technical experts, decision makers and stakeholders; • integrating knowledge from different sources in decision making (e.g., science, TEK, etc.); • encouraging disciplined thinking about cause and effect relationships; • being explicit about uncertainty, in particular, emphasizing the existence of competing hypotheses and facilitating informed debate about them; • defining evaluation criteria; • determining modeling and information needs directly related to the evaluation criteria; • structuring subsequent quantitative modeling (especially when constructed under more formalized rules to describe inter-related conditional probabilities); • documenting the basis for and improving the transparency of expert judgments
  • 3.
    Influence diagrams areparticularly helpful • when problems have a high degree of conditional independence, • when compact representation of extremely large models is needed, • when communication of the probabilistic relationships is important, or • when the analysis requires extensive Bayesian updating