Download as PDF, PPTX

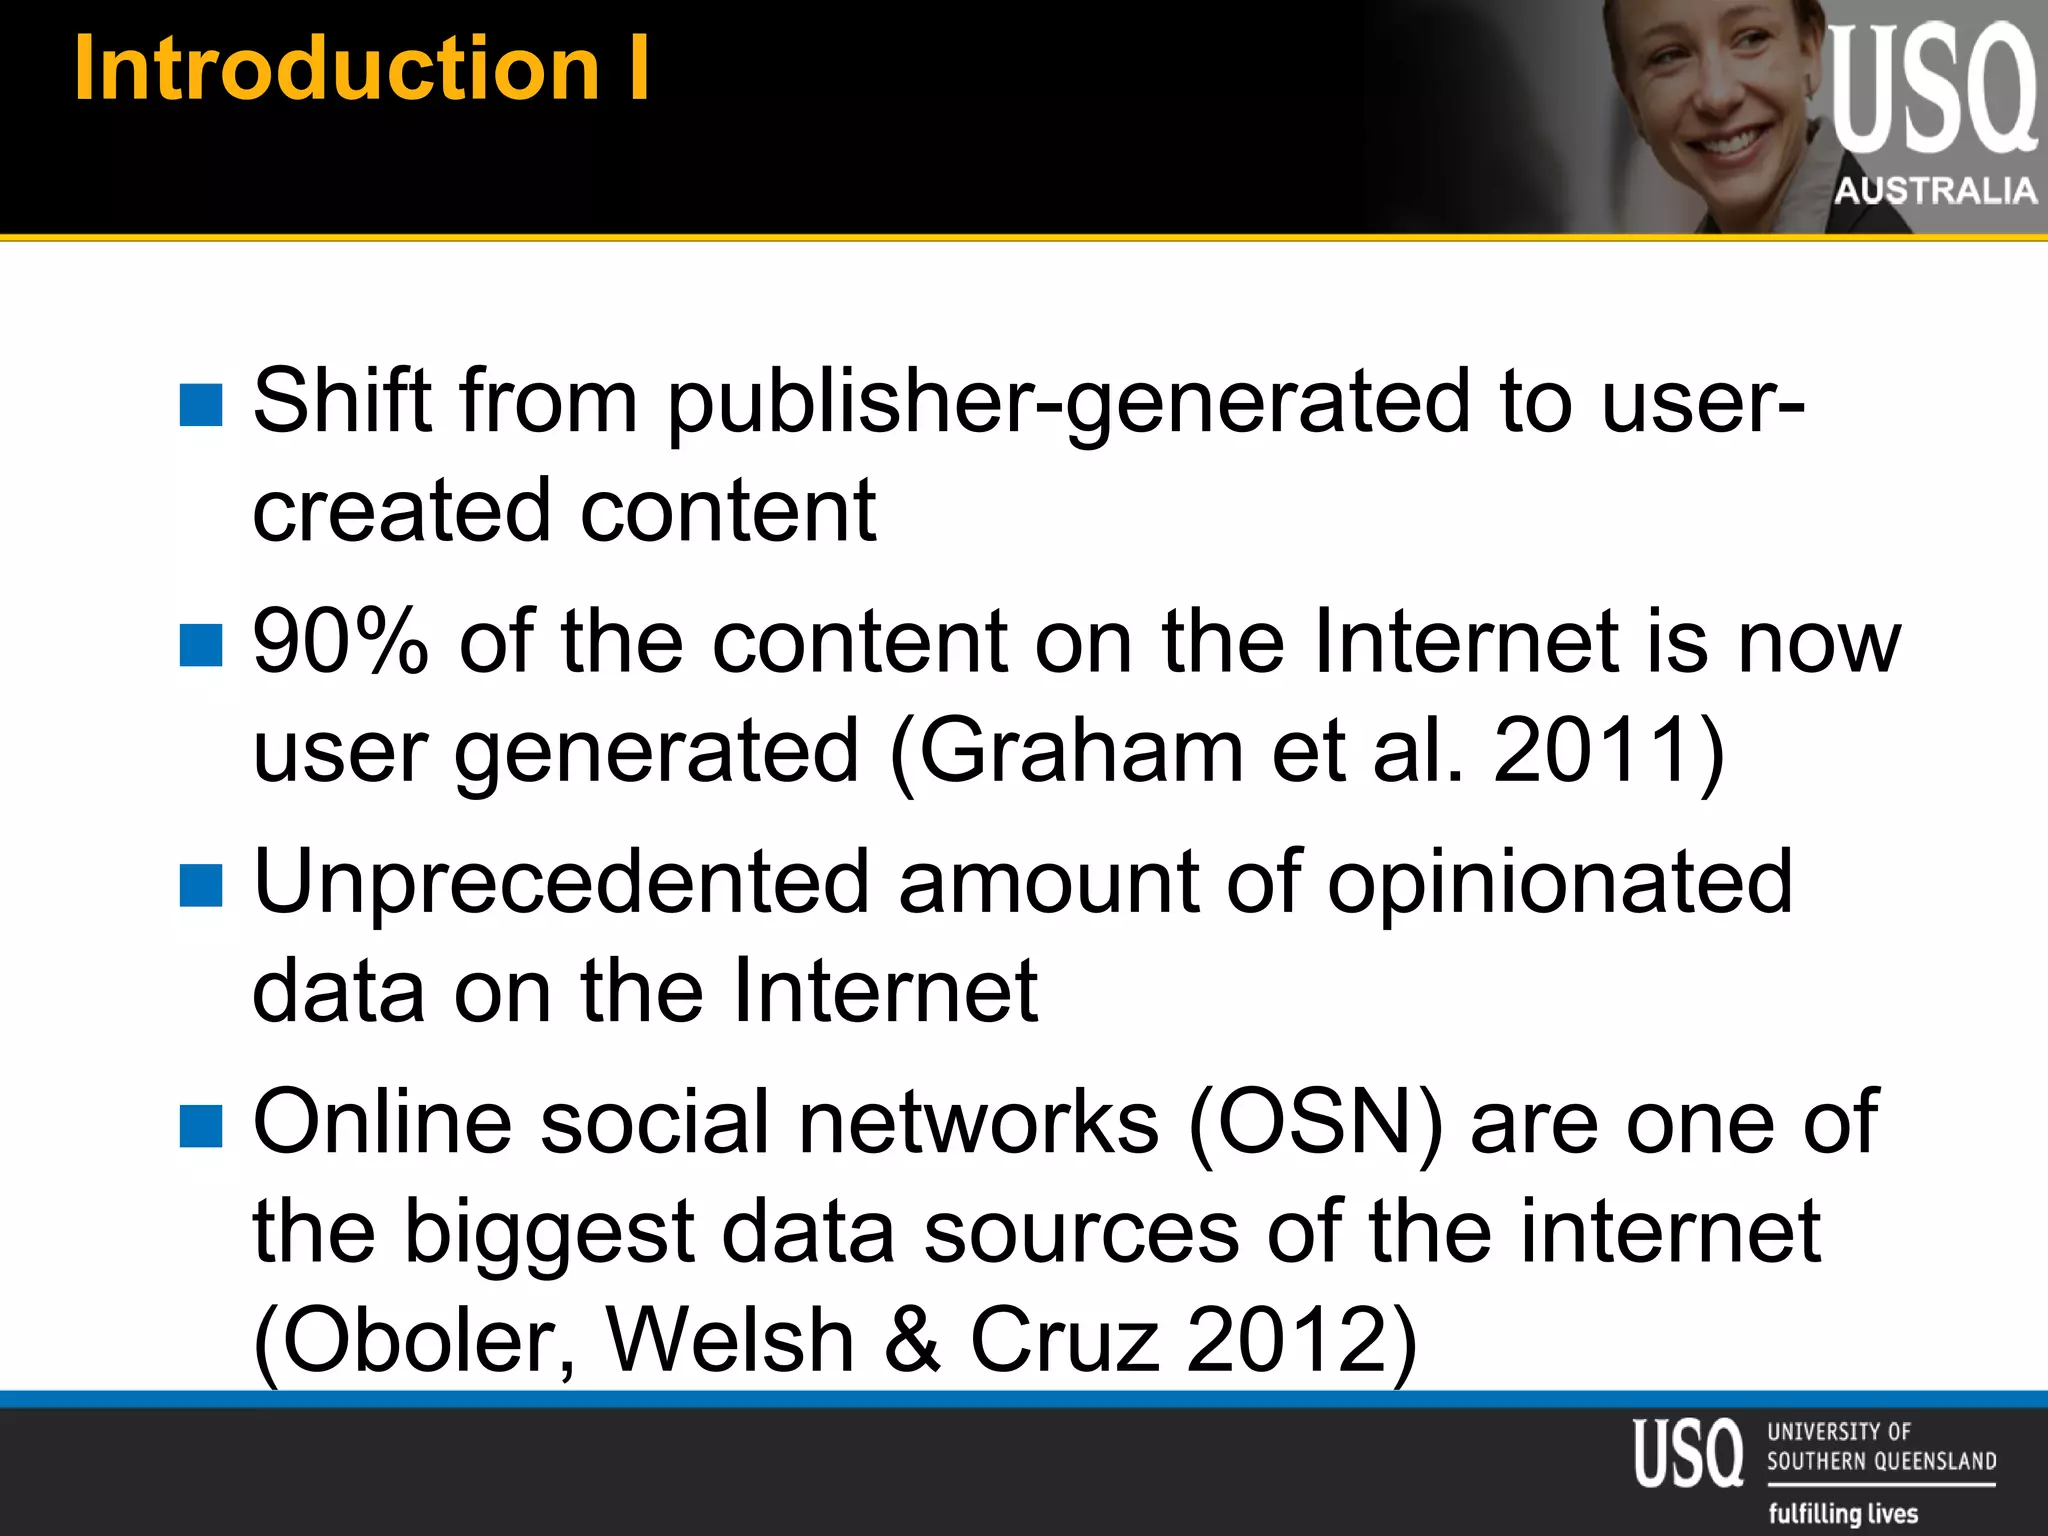
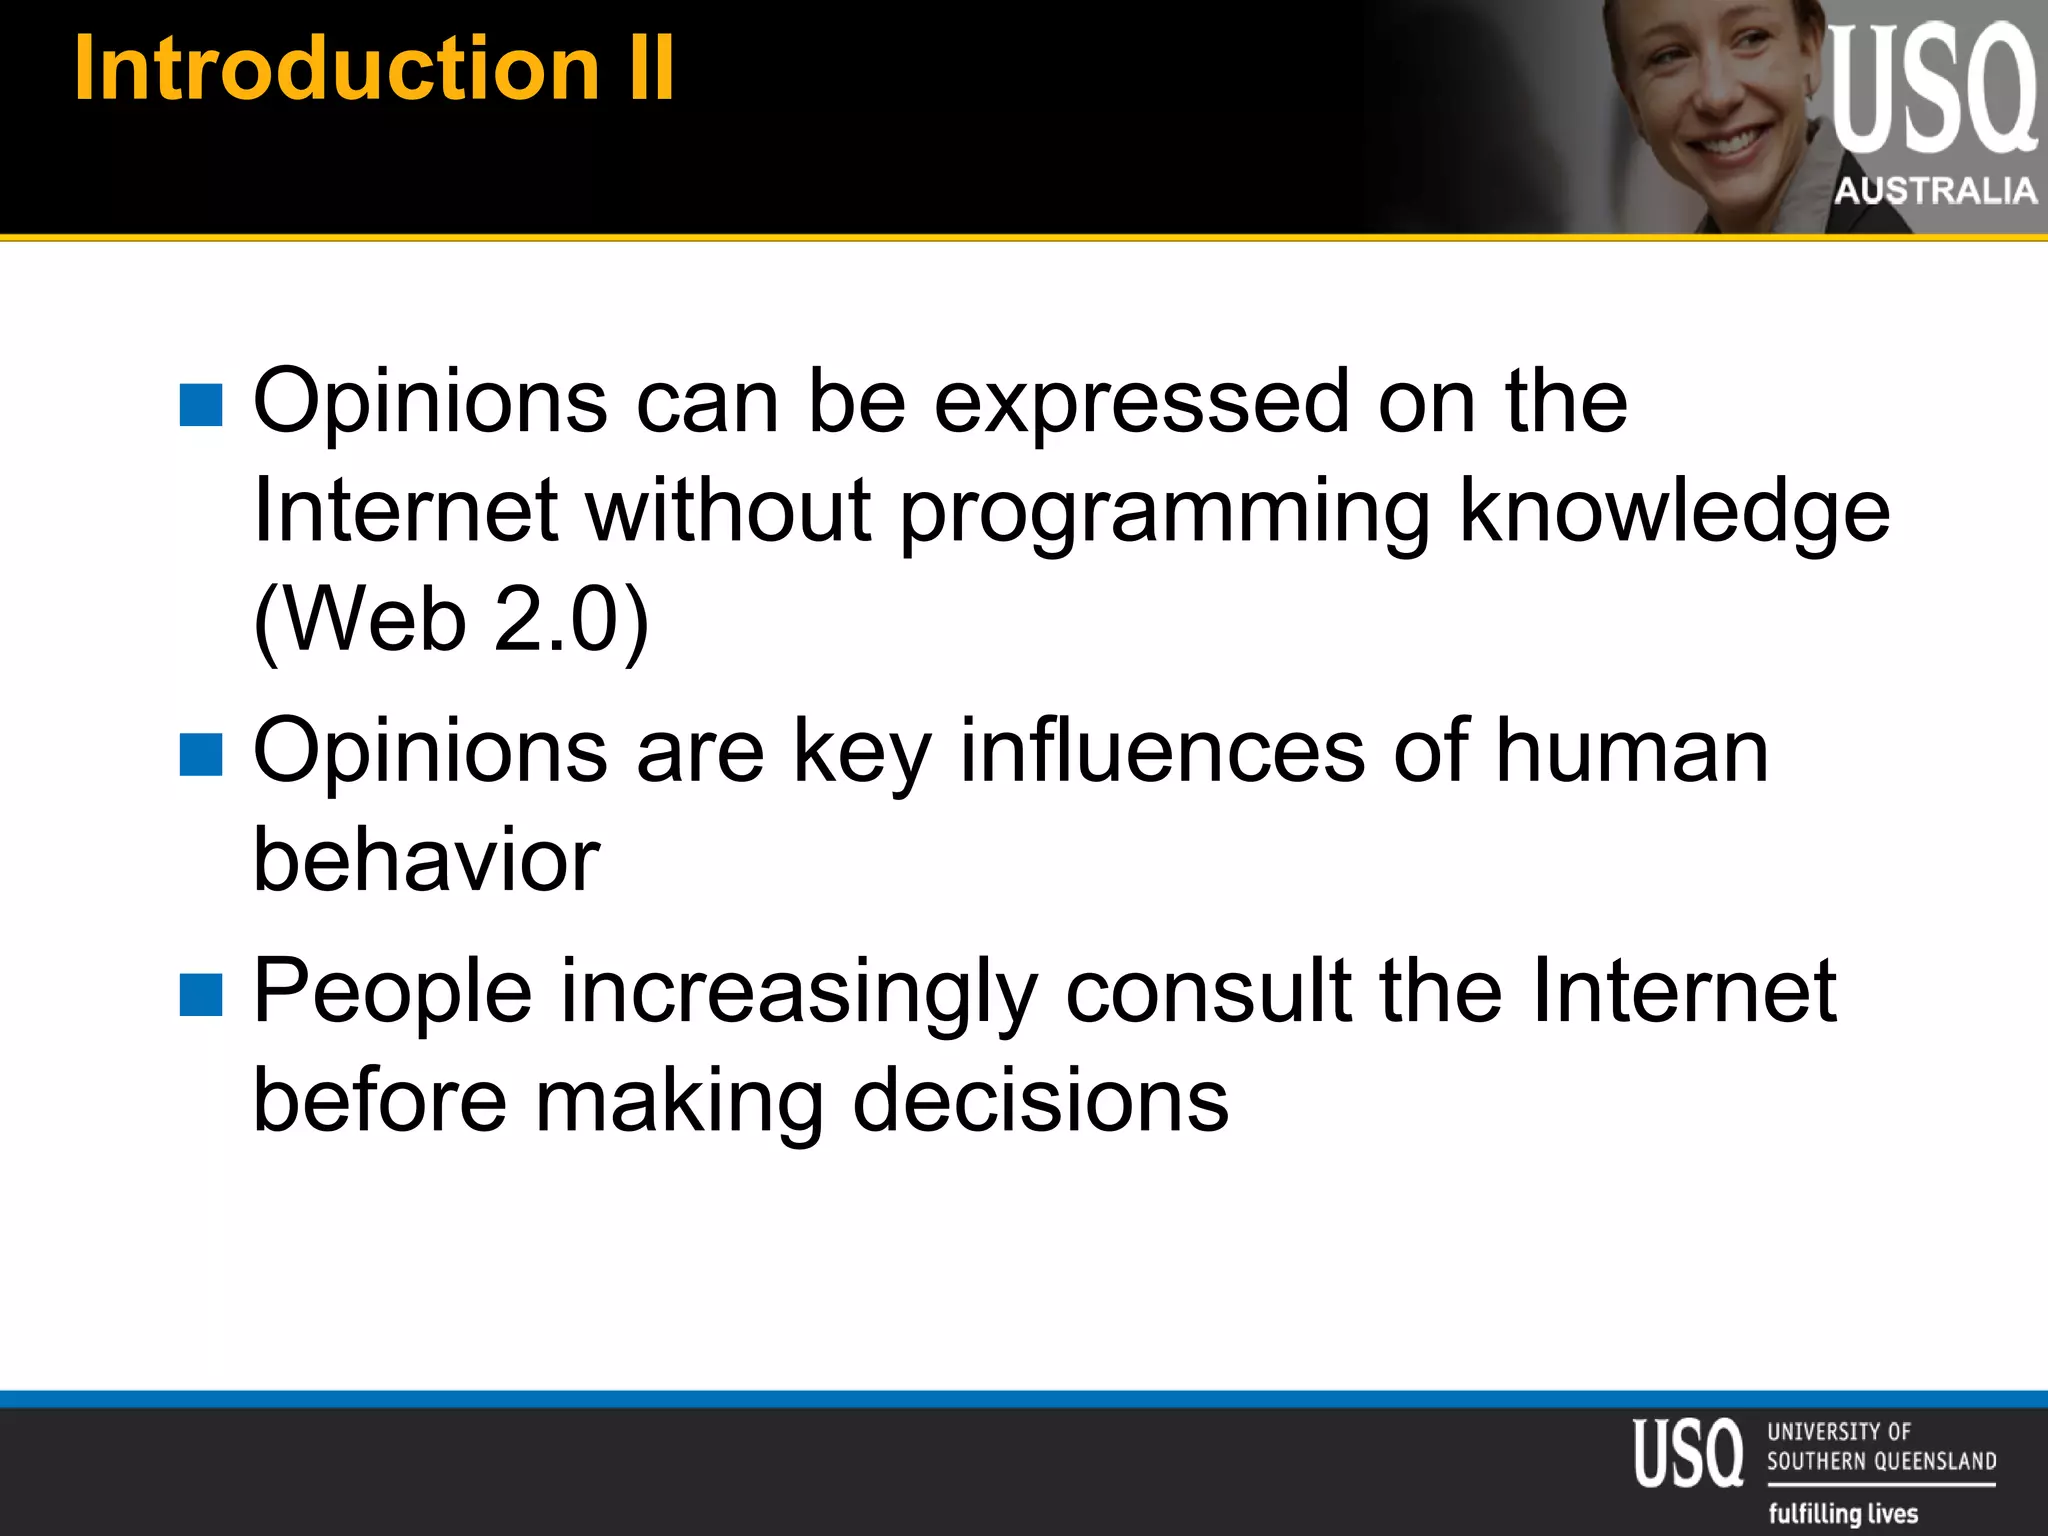
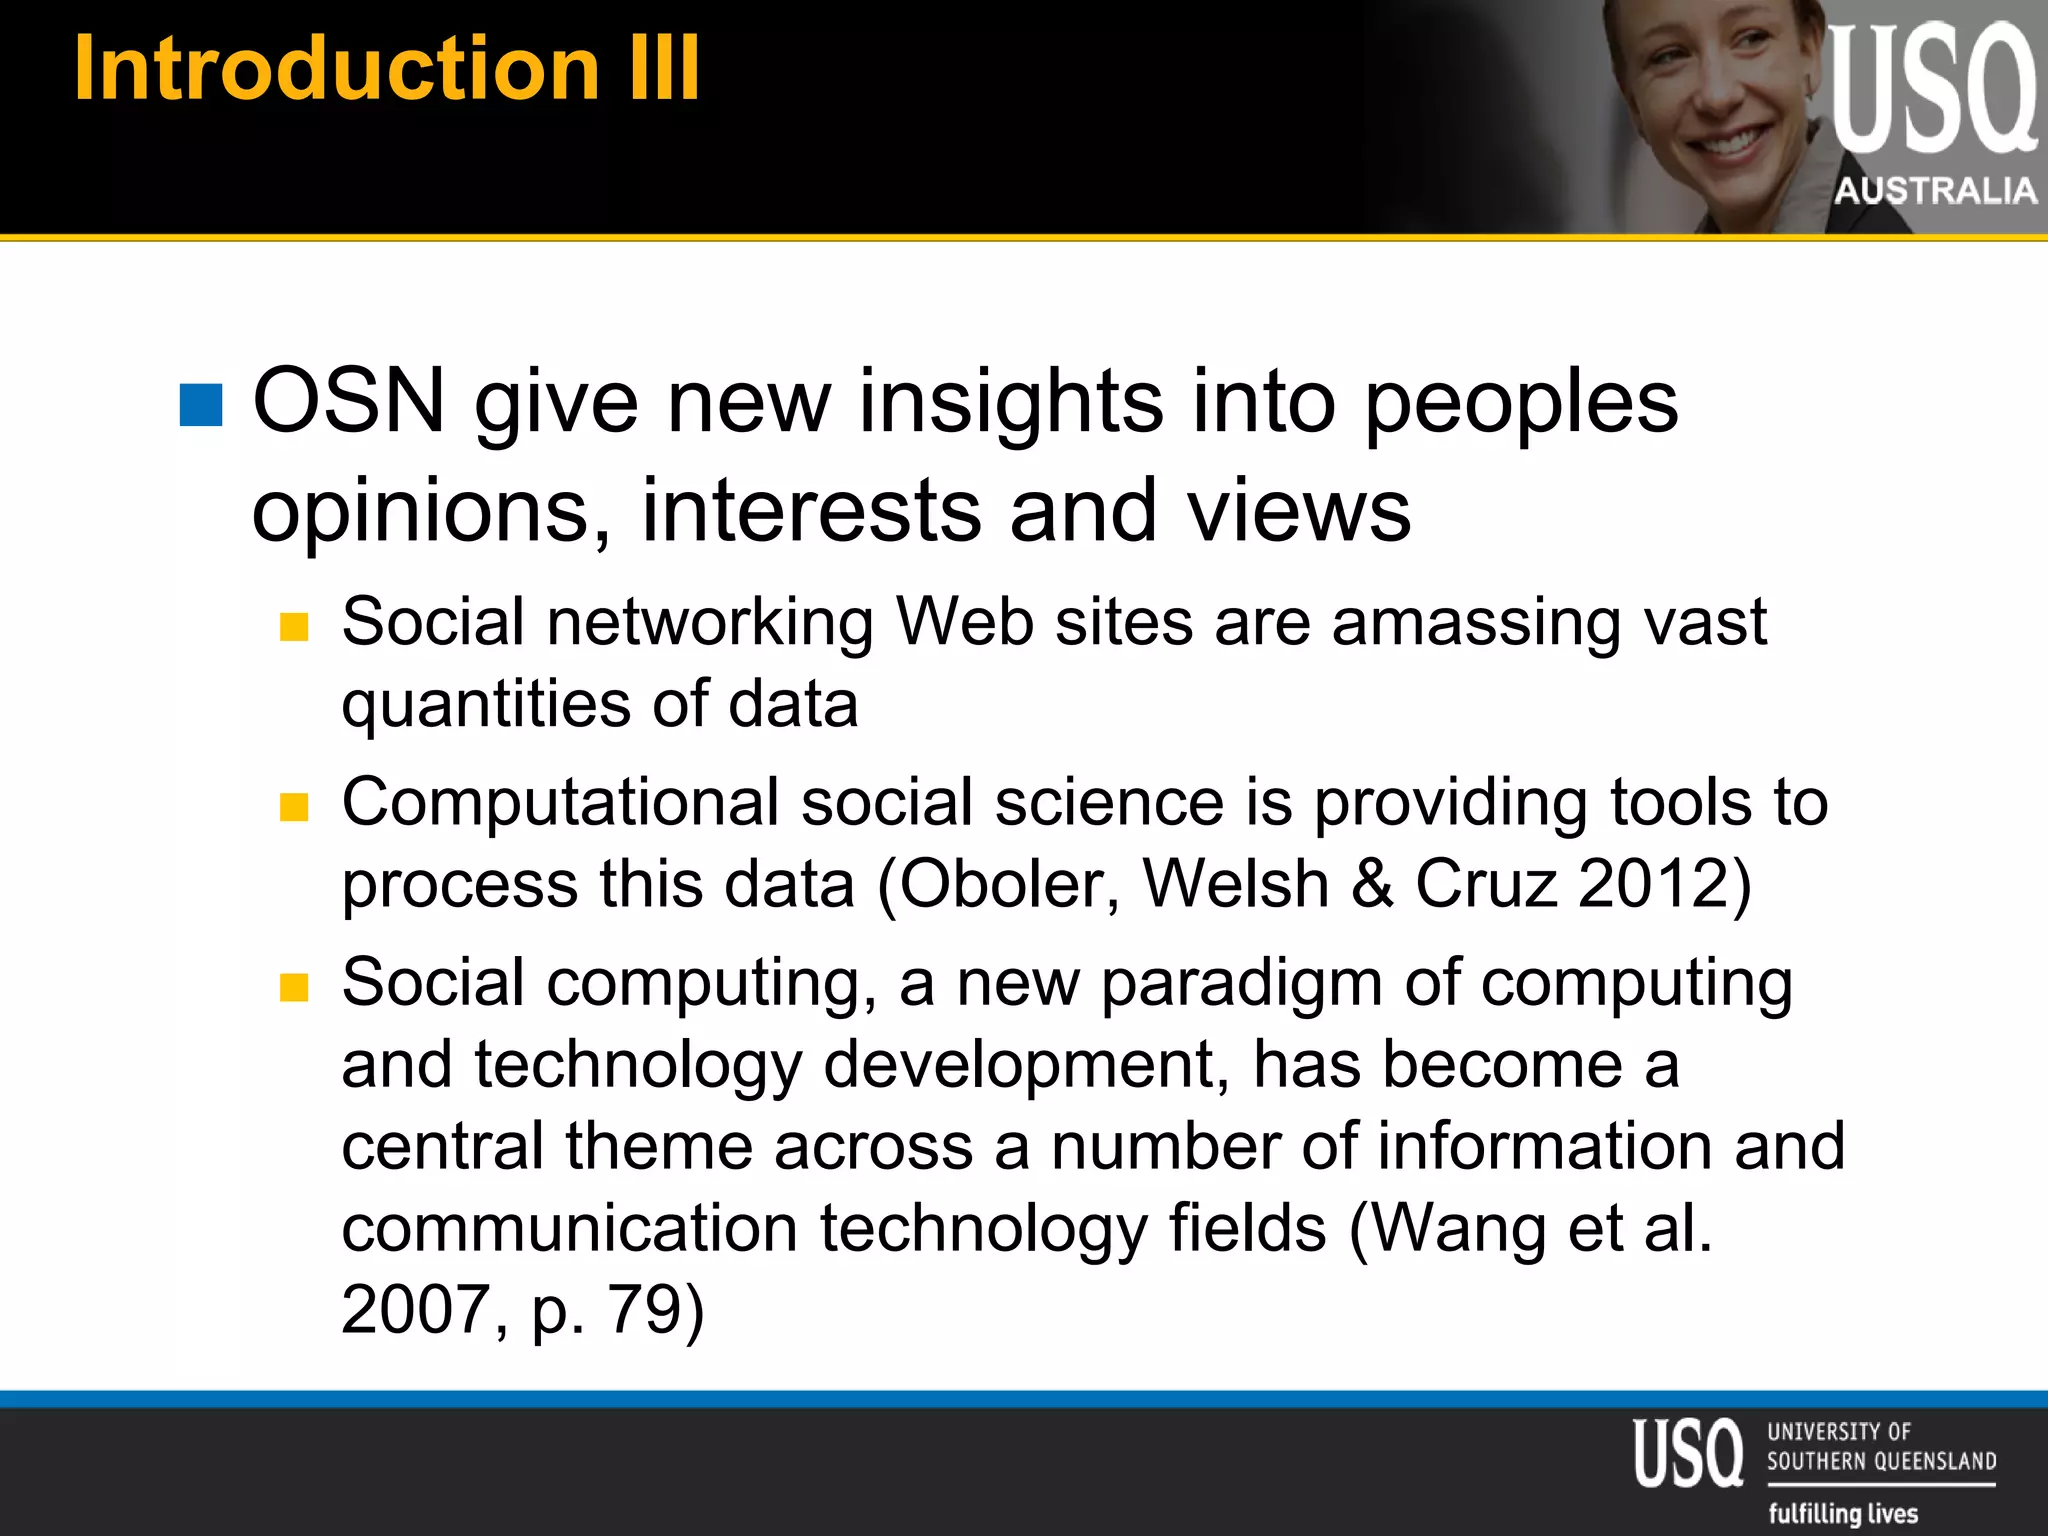
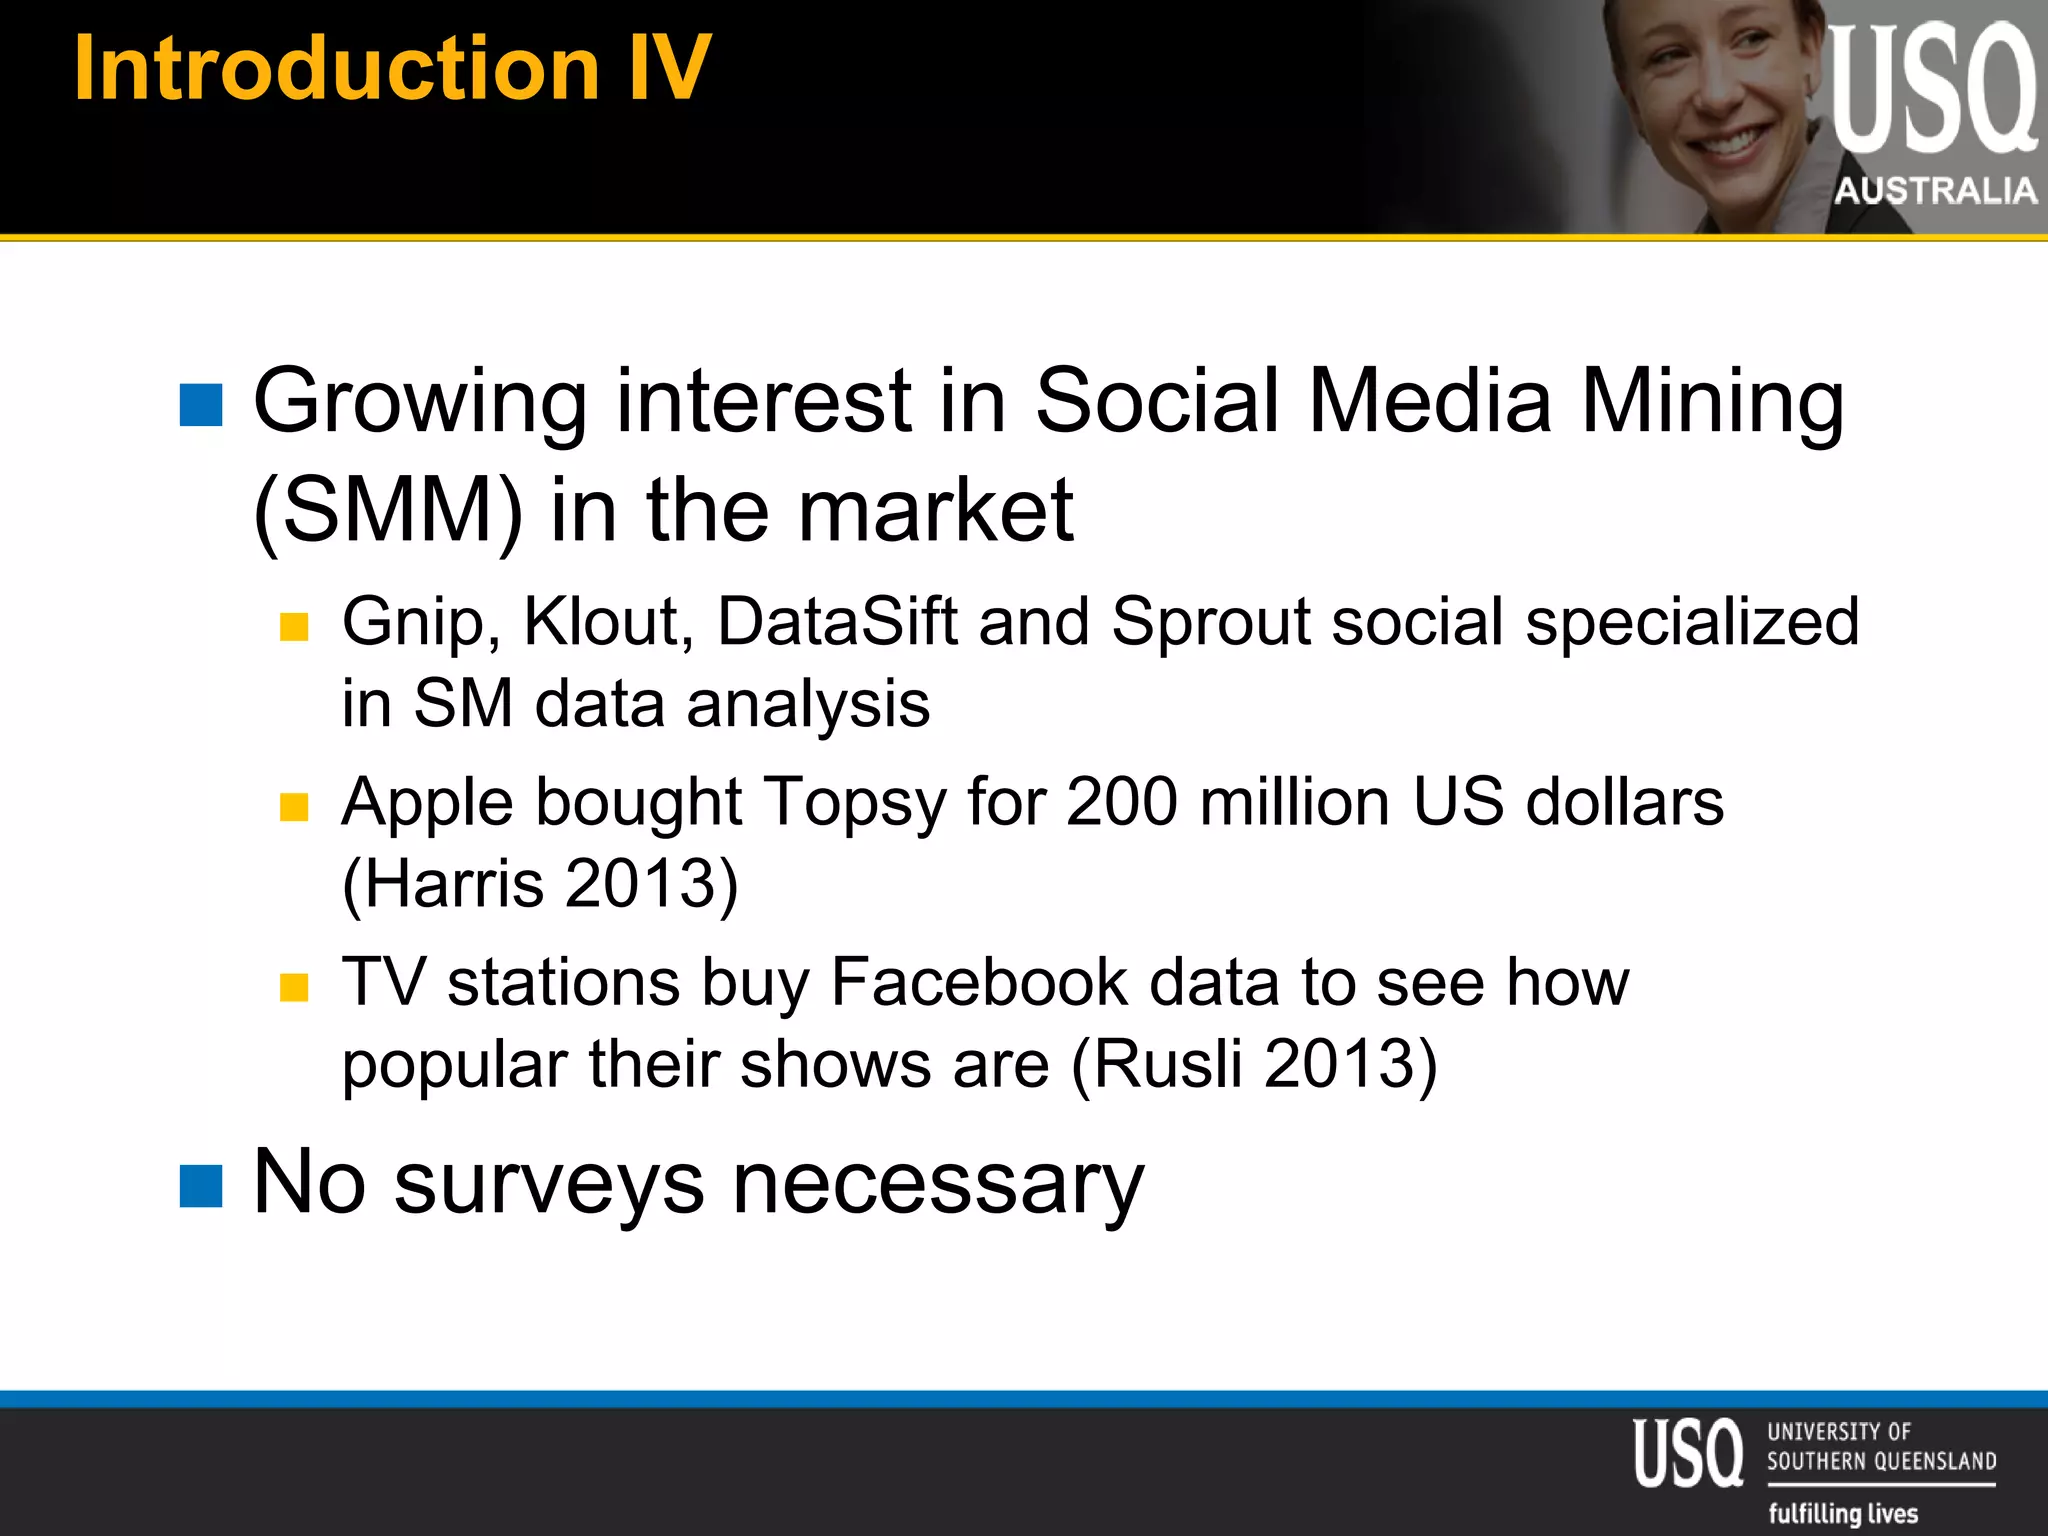
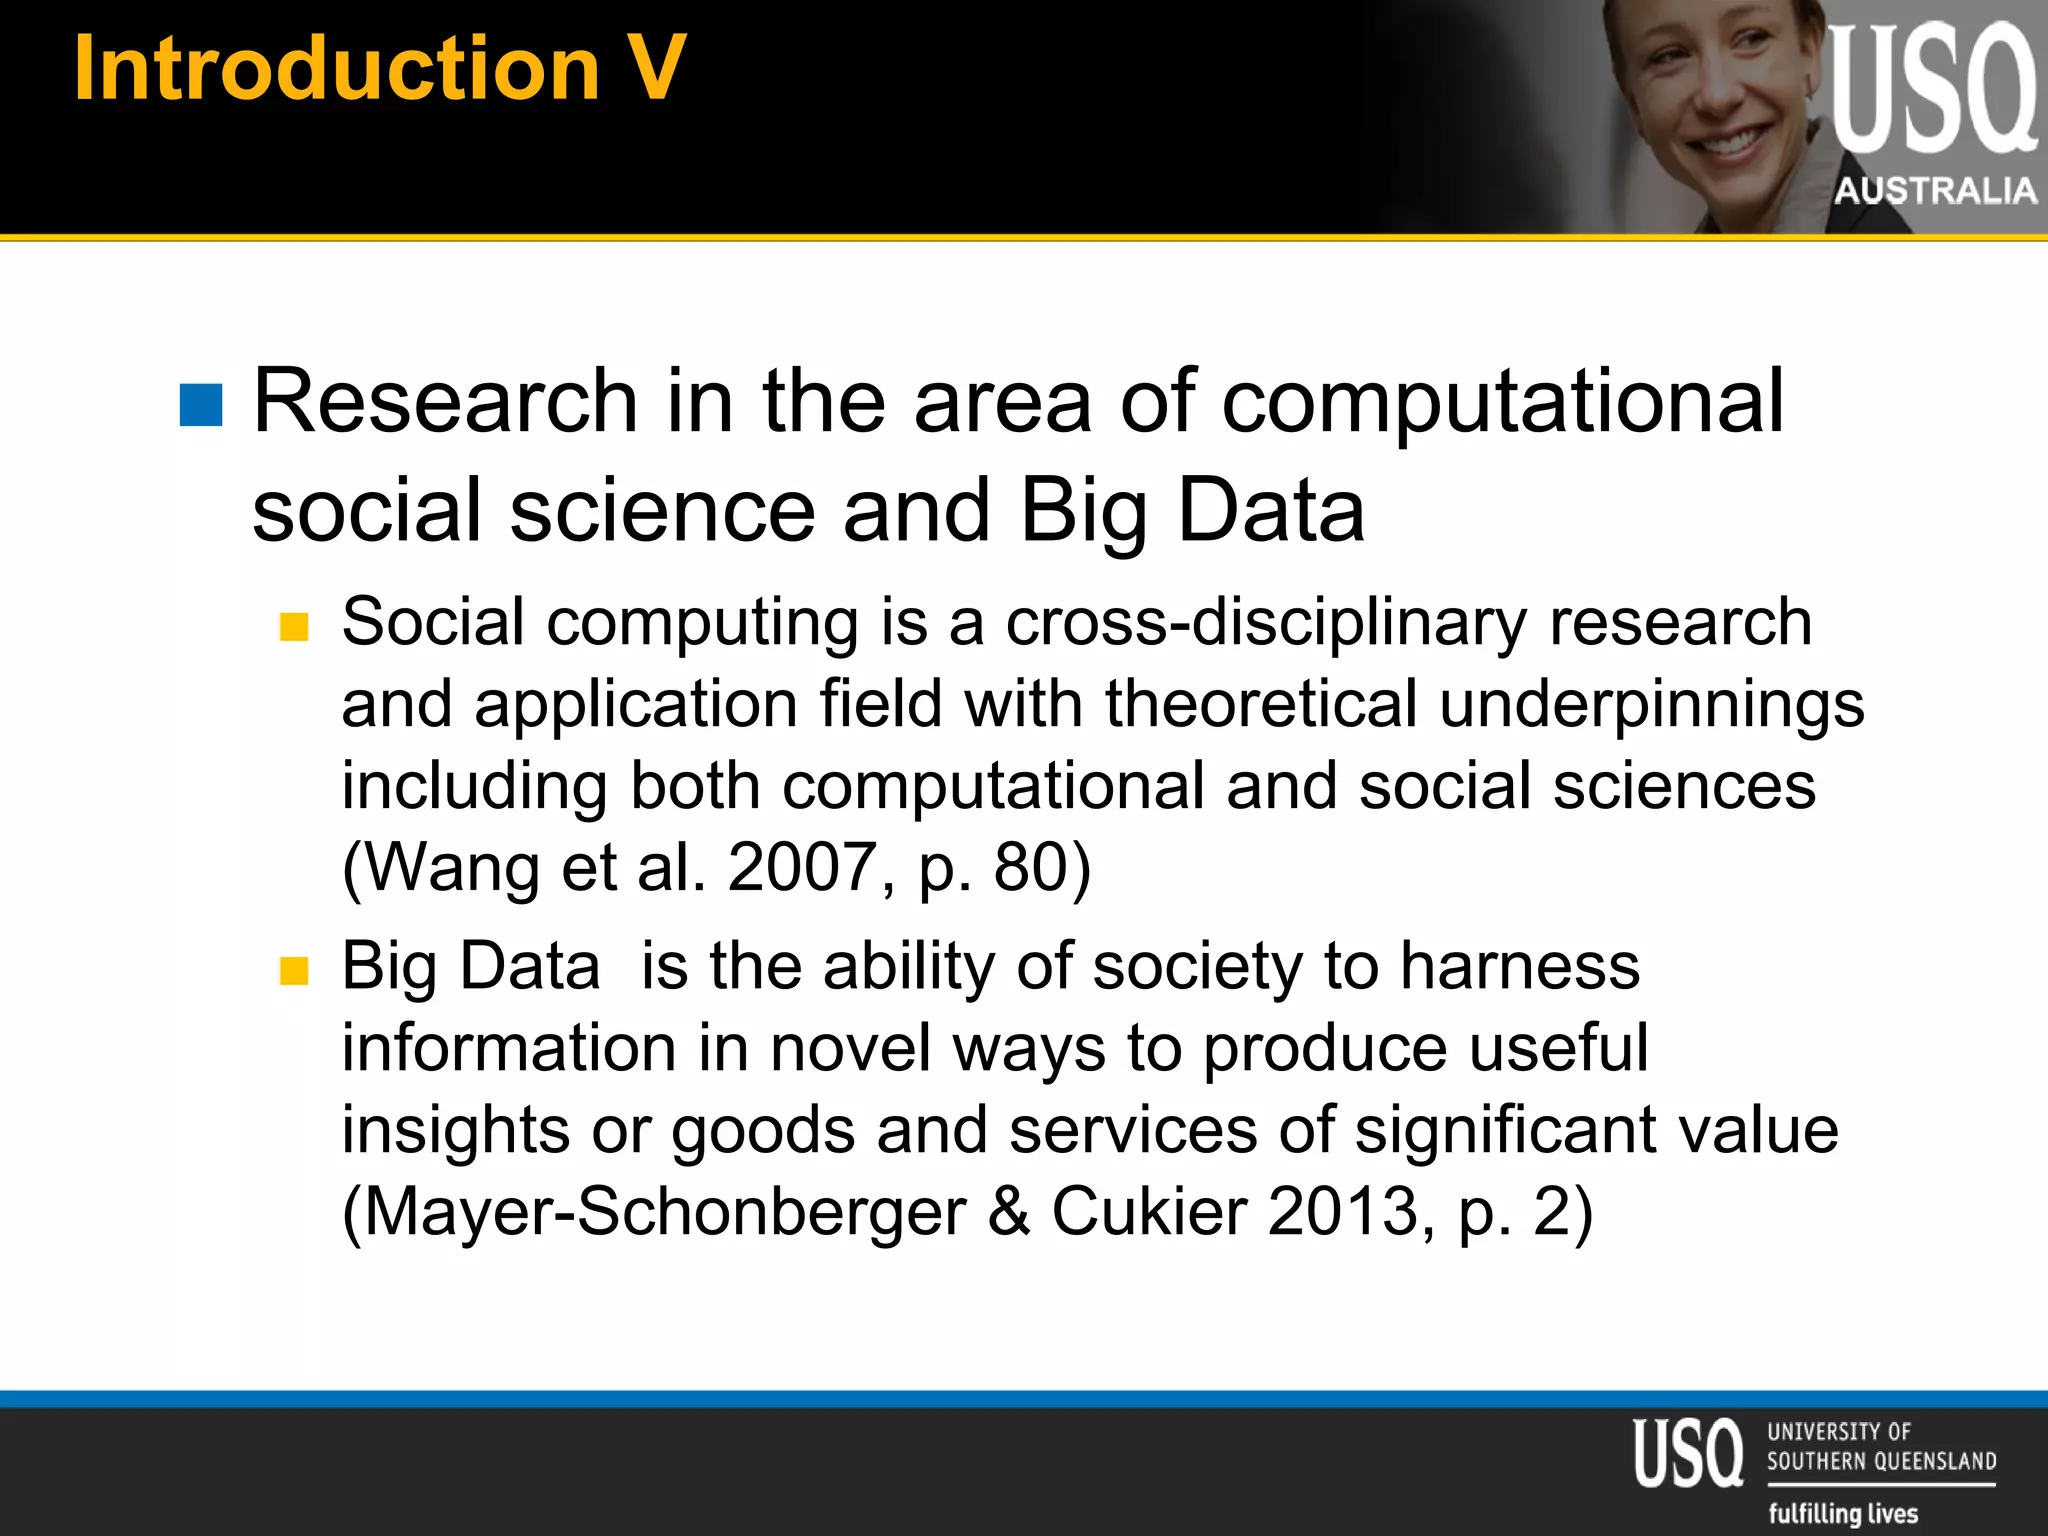
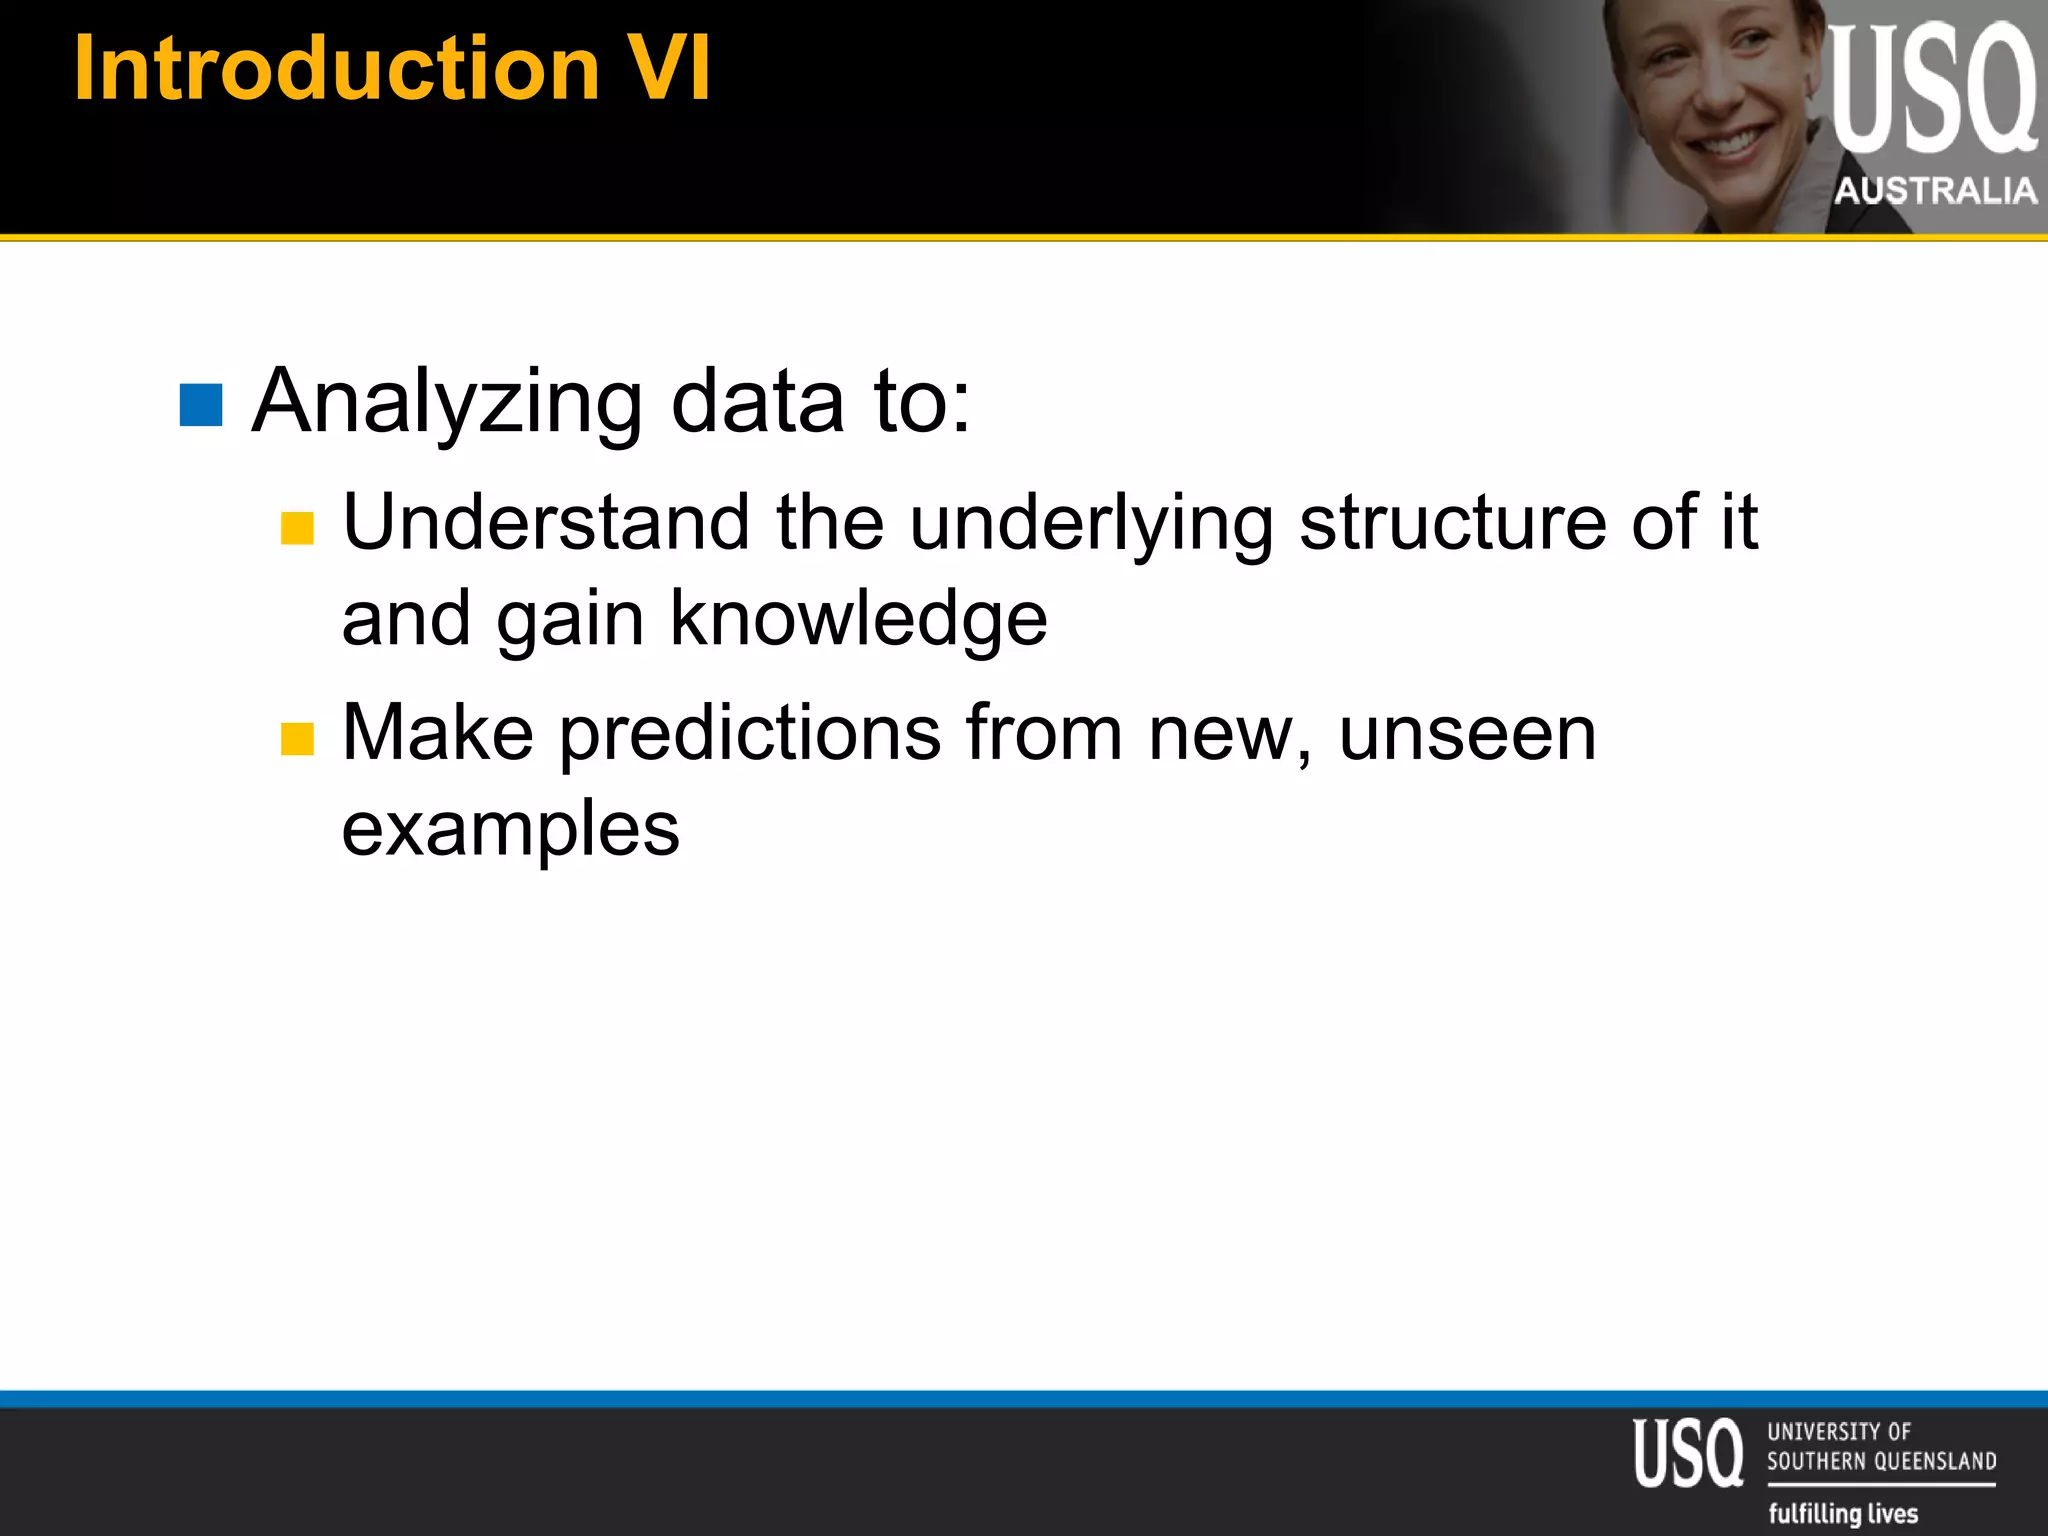
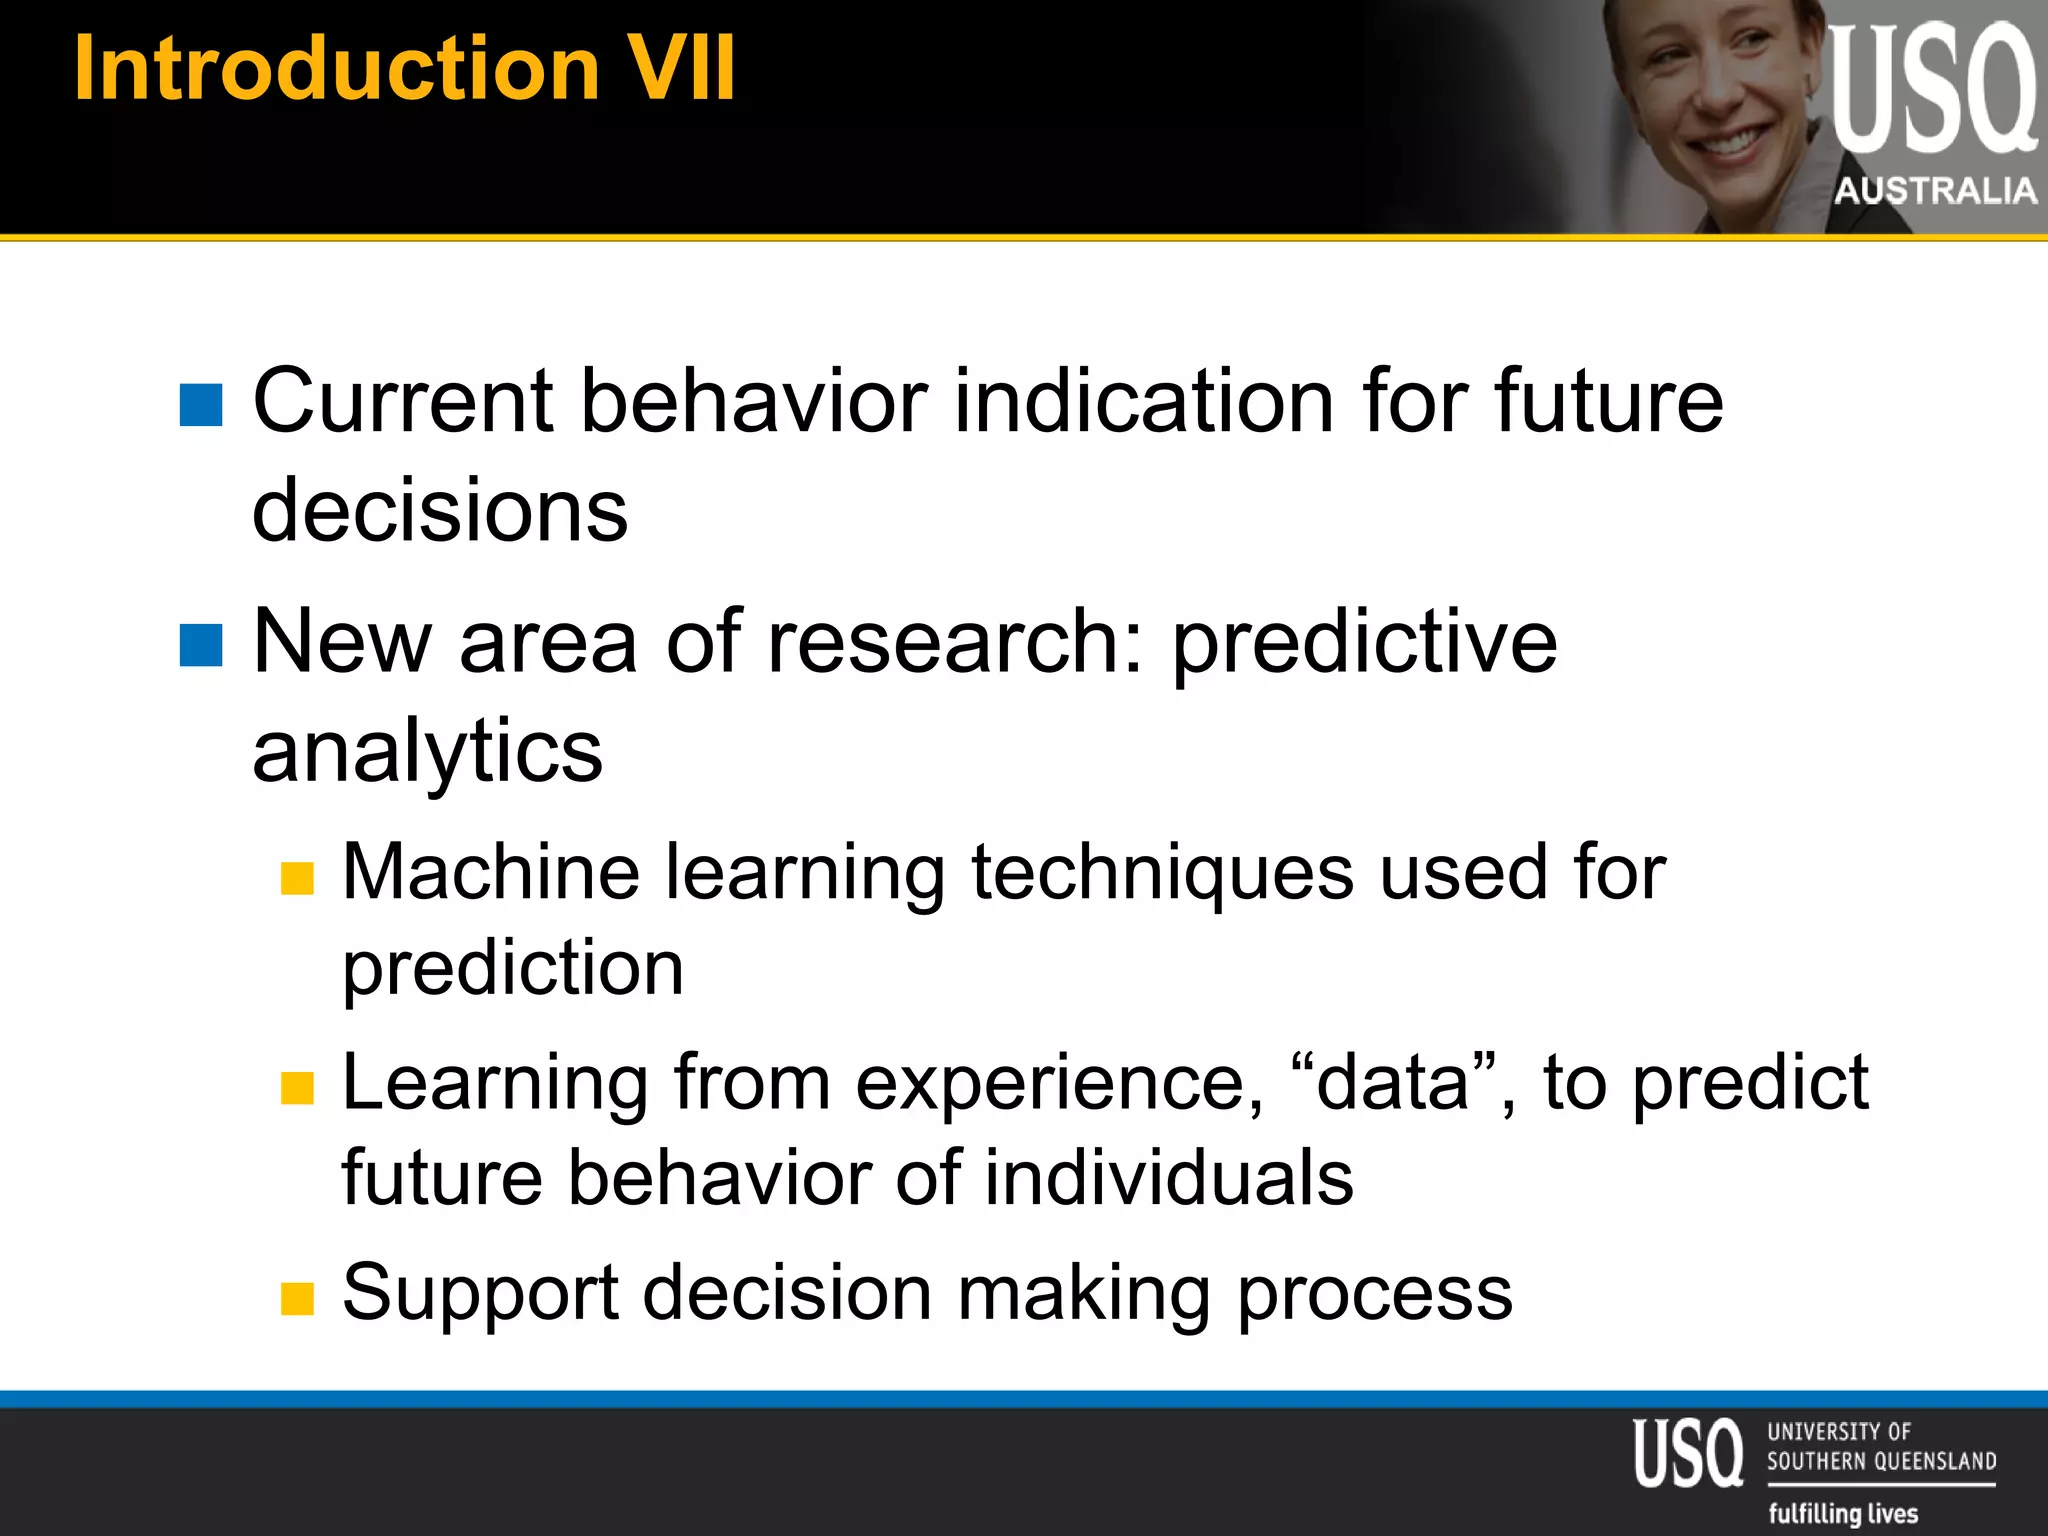
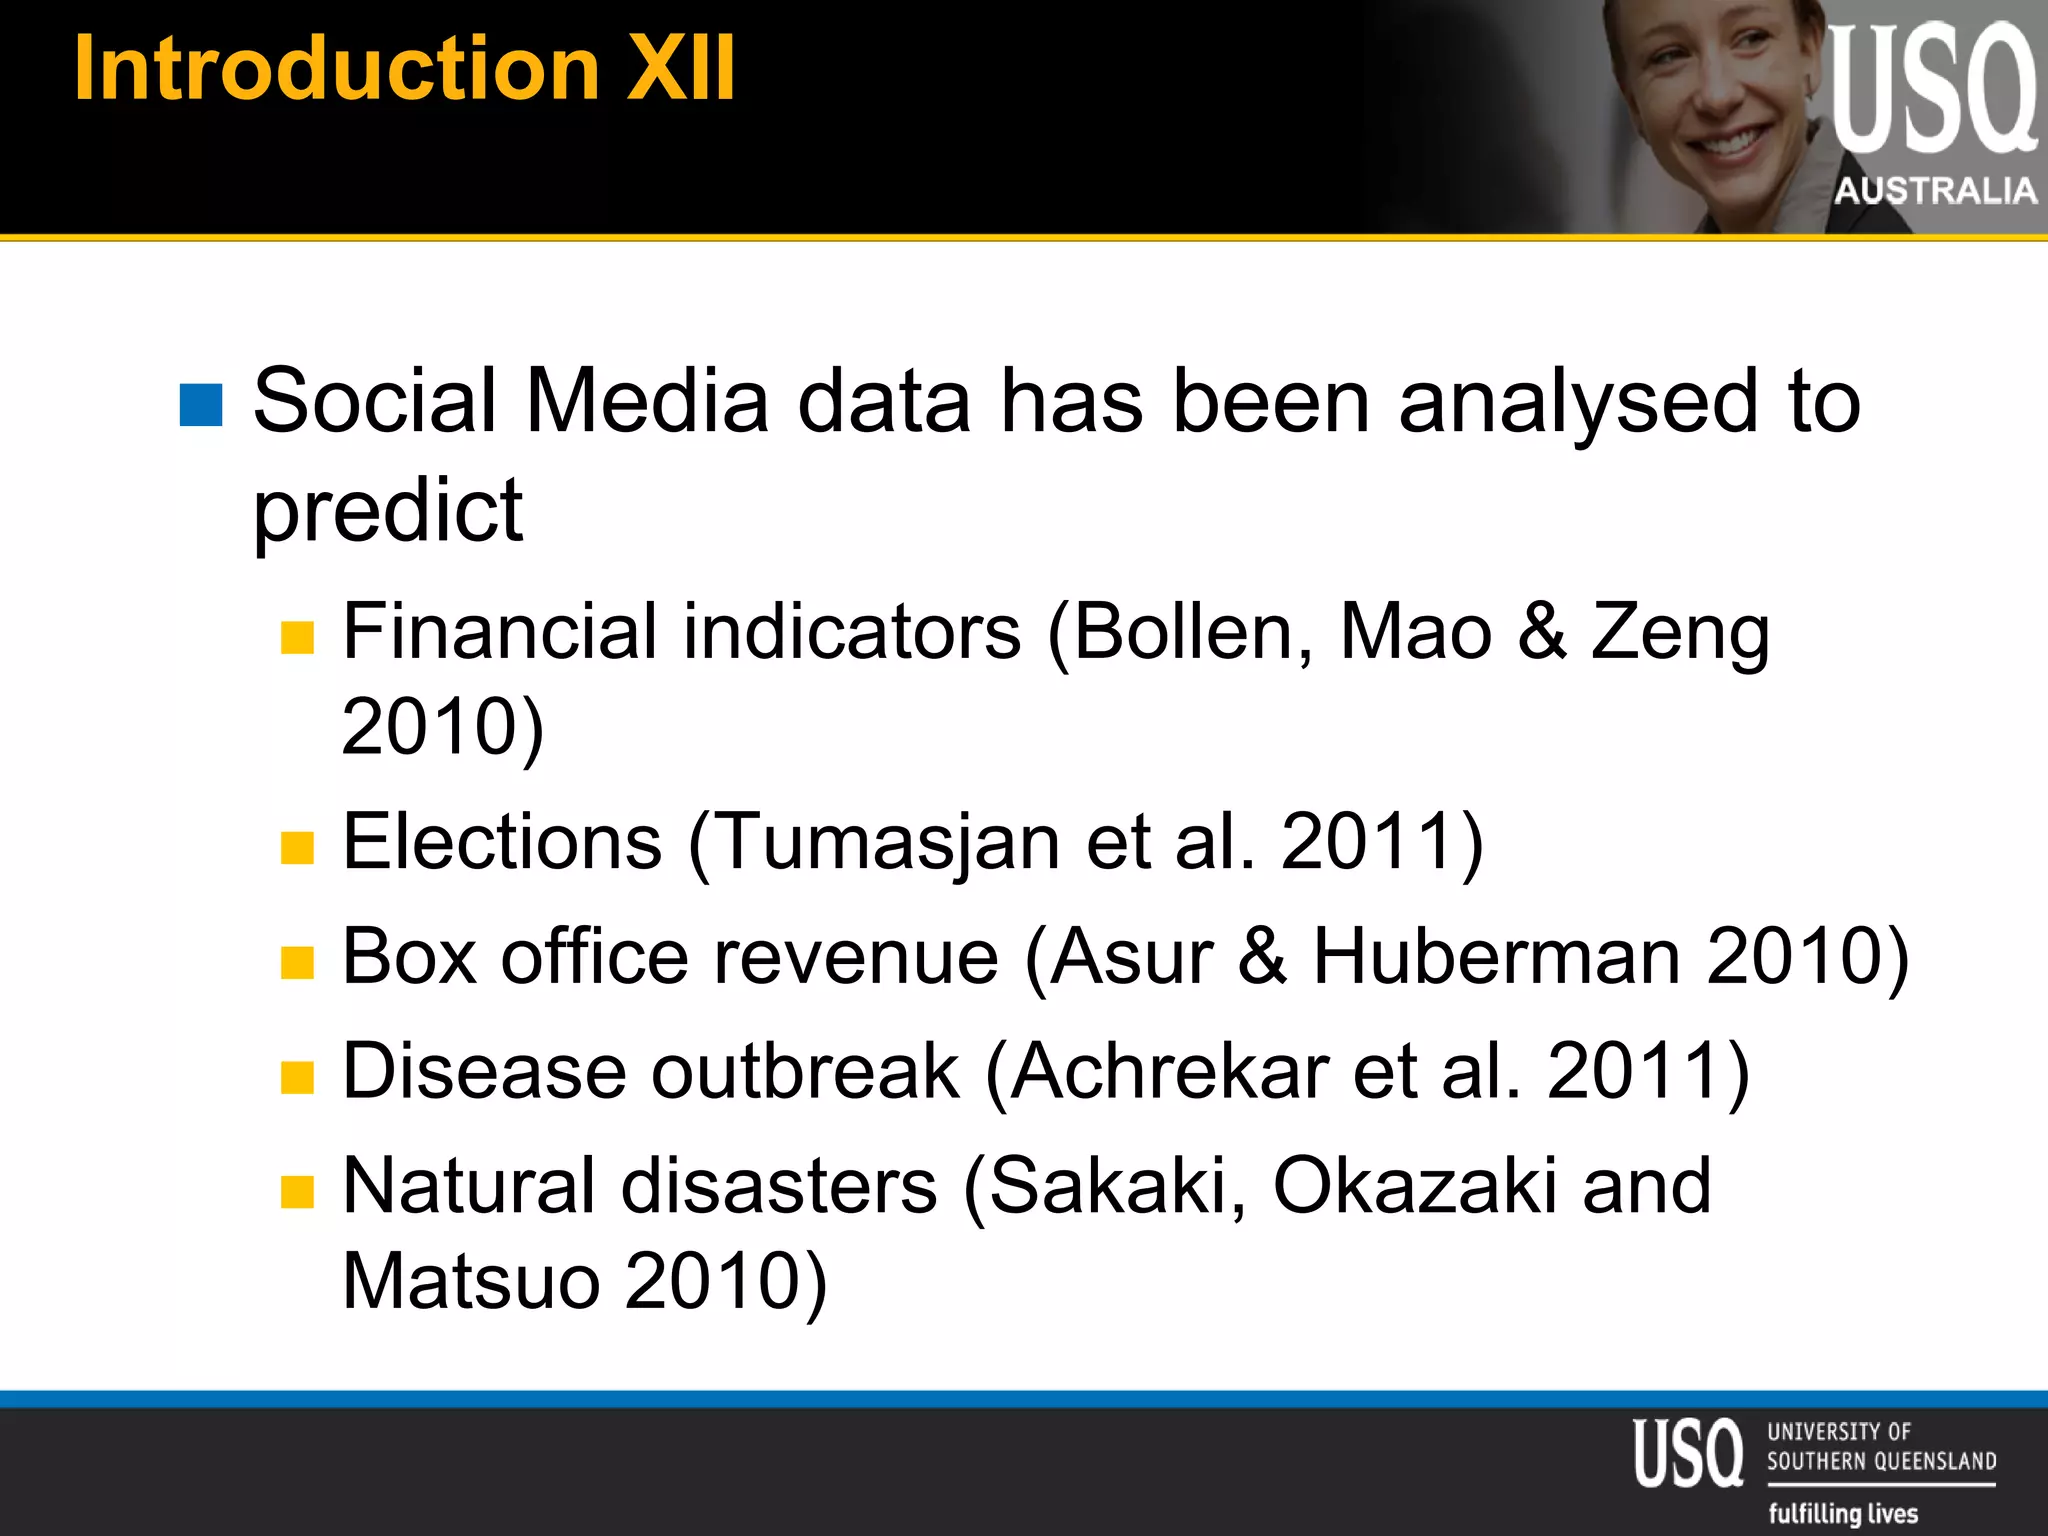

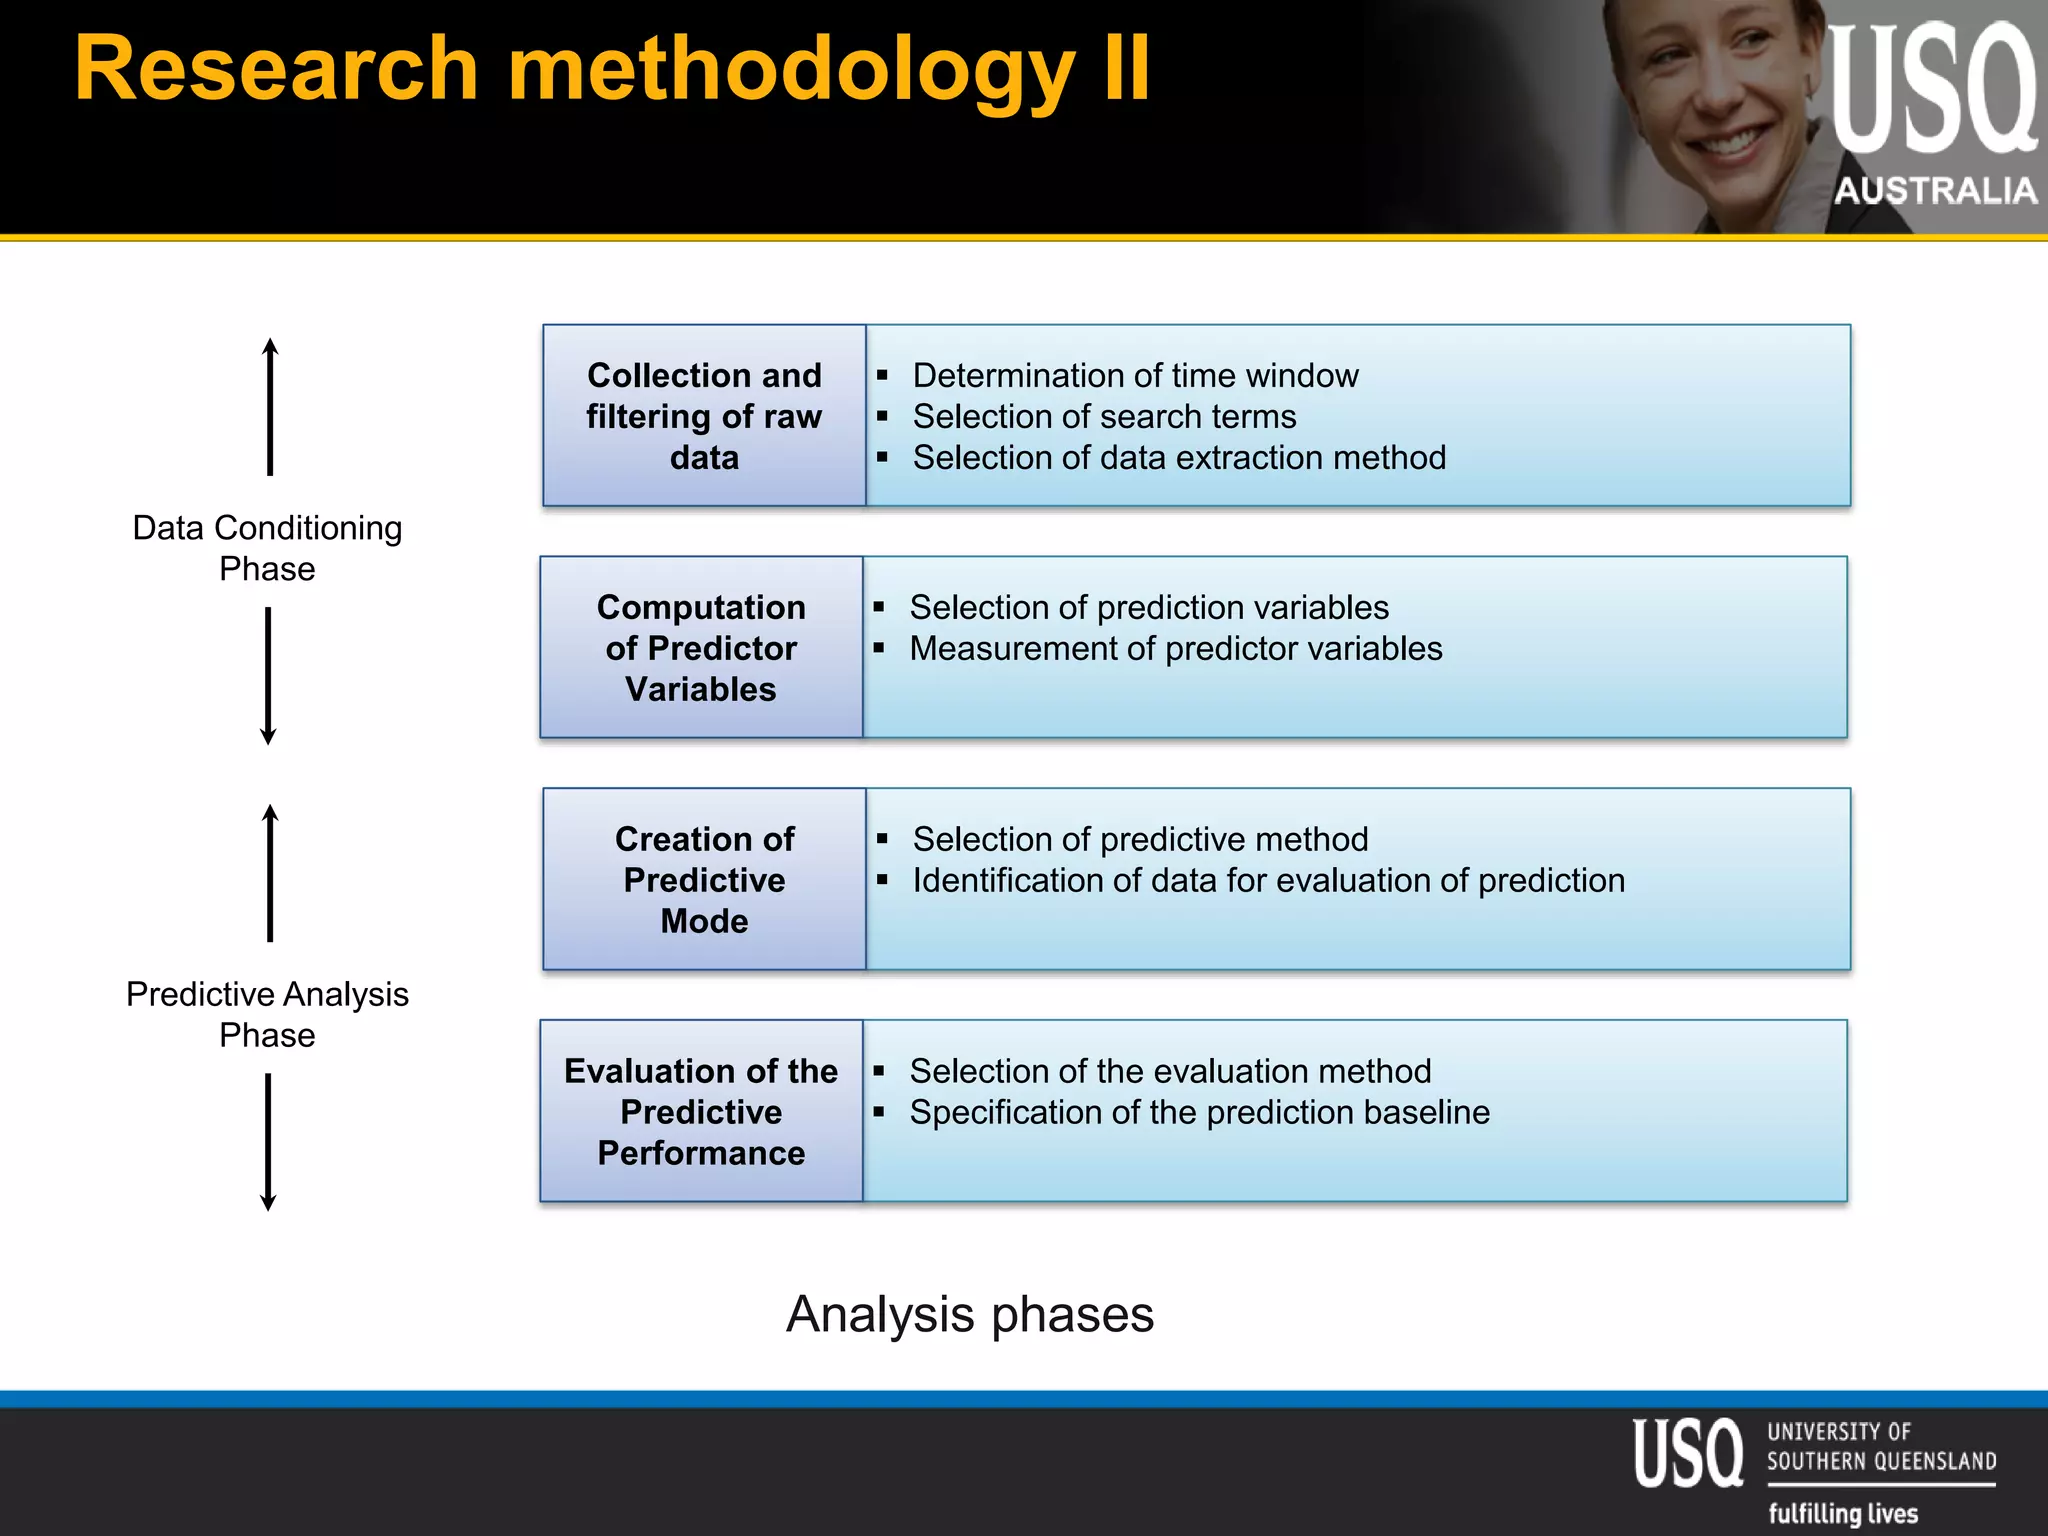
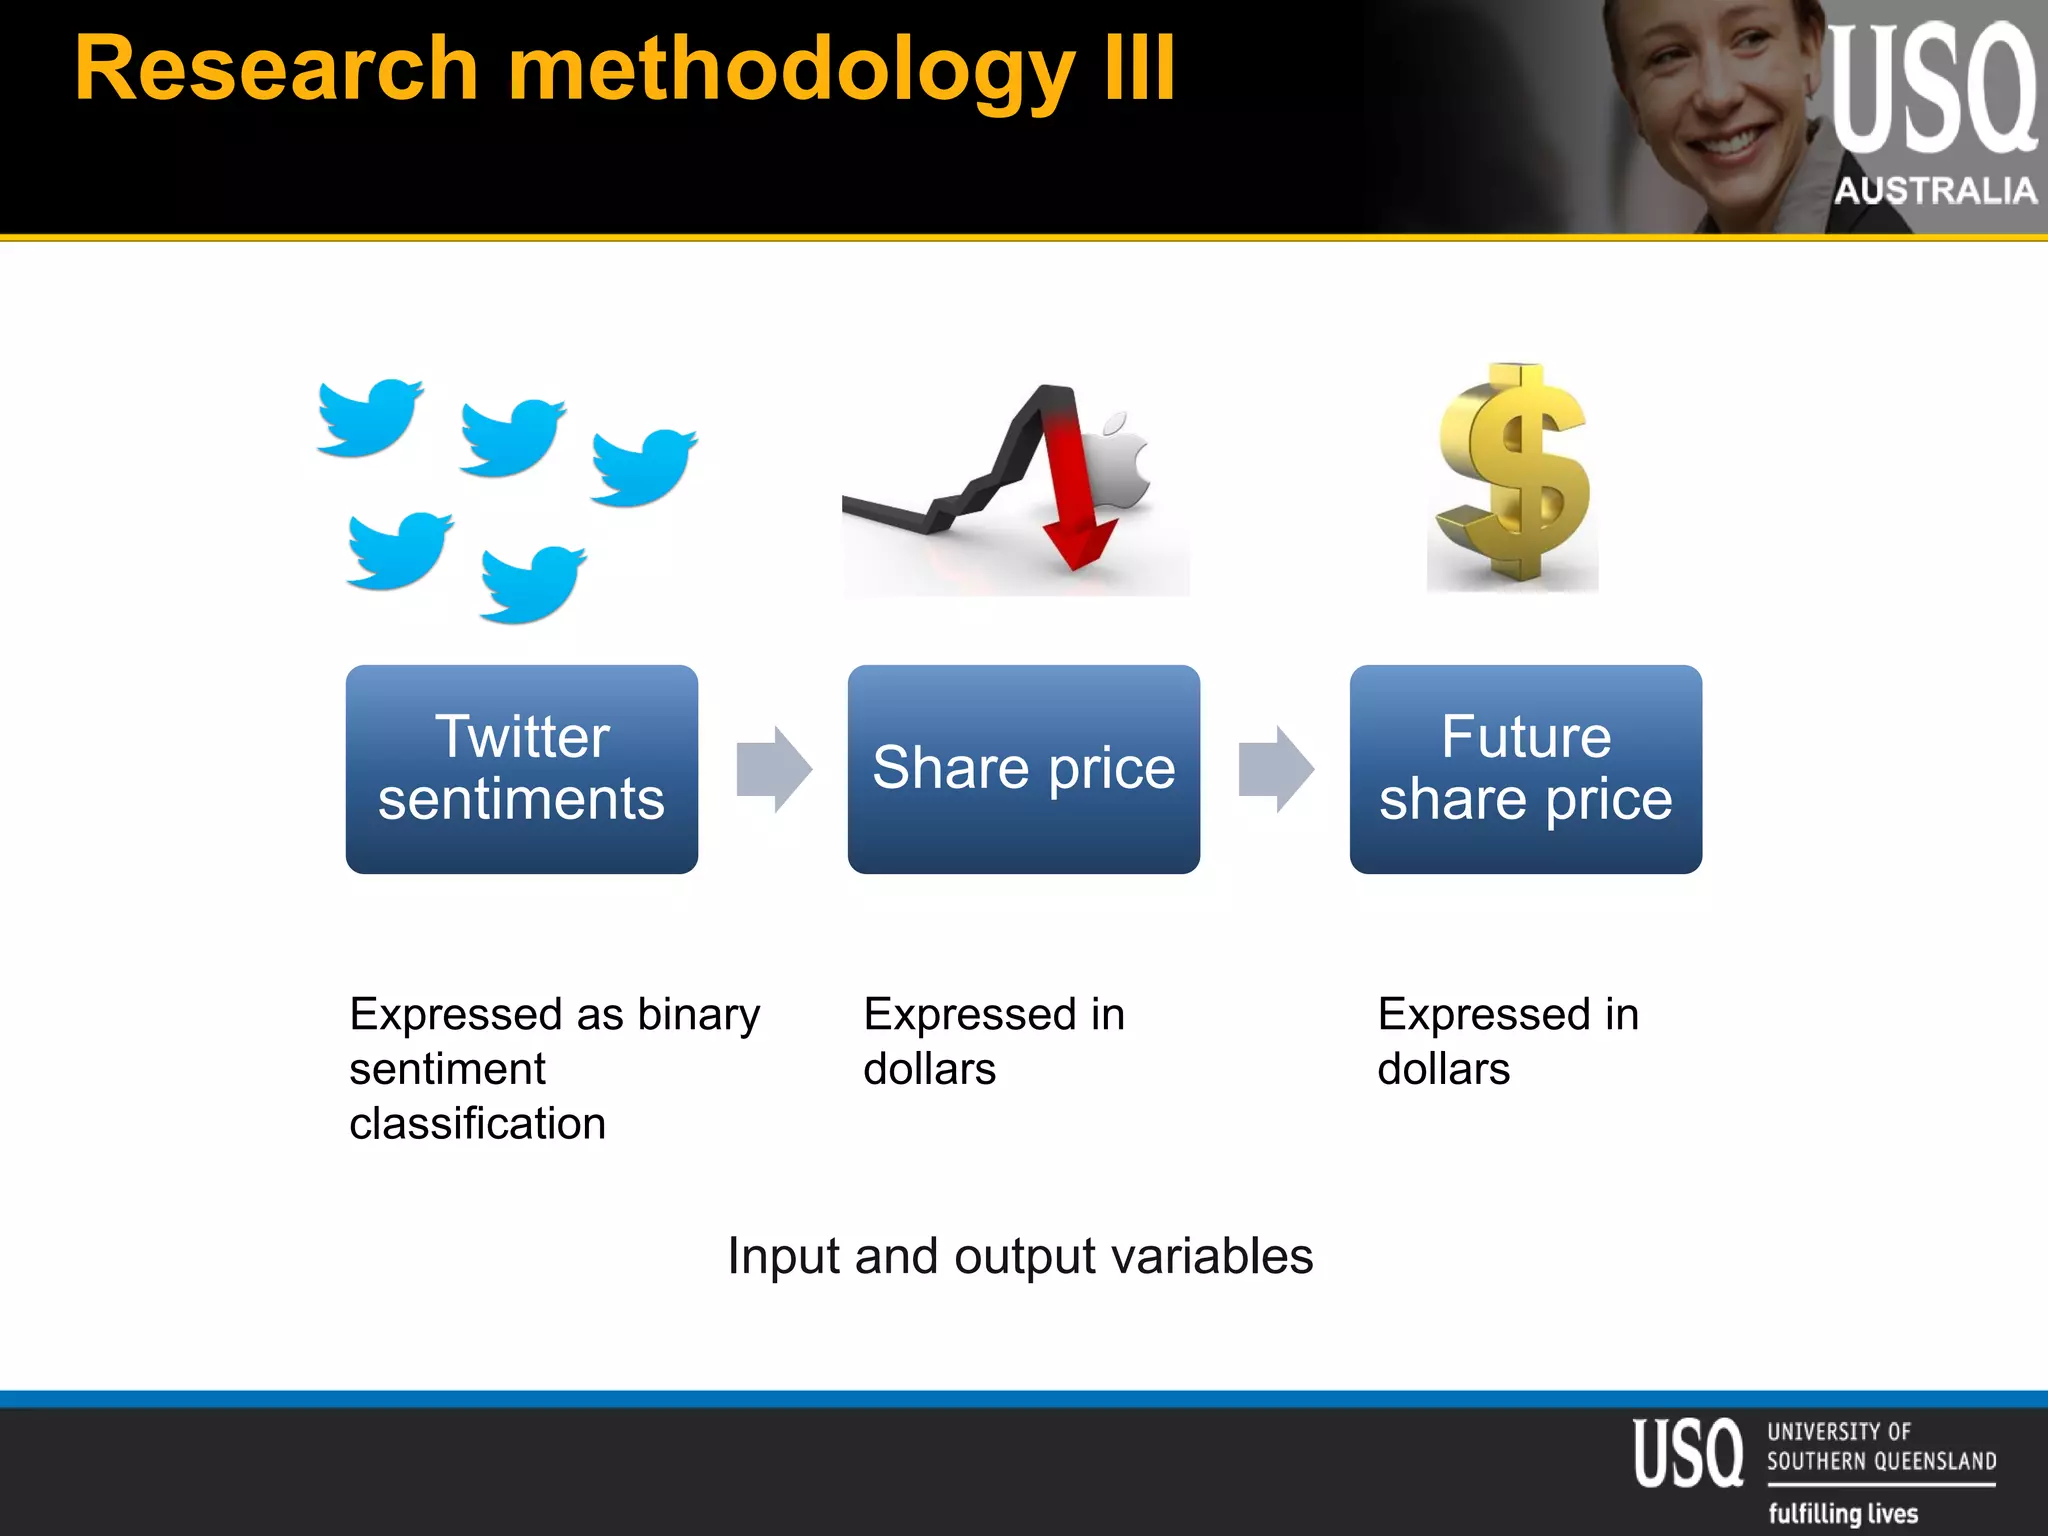
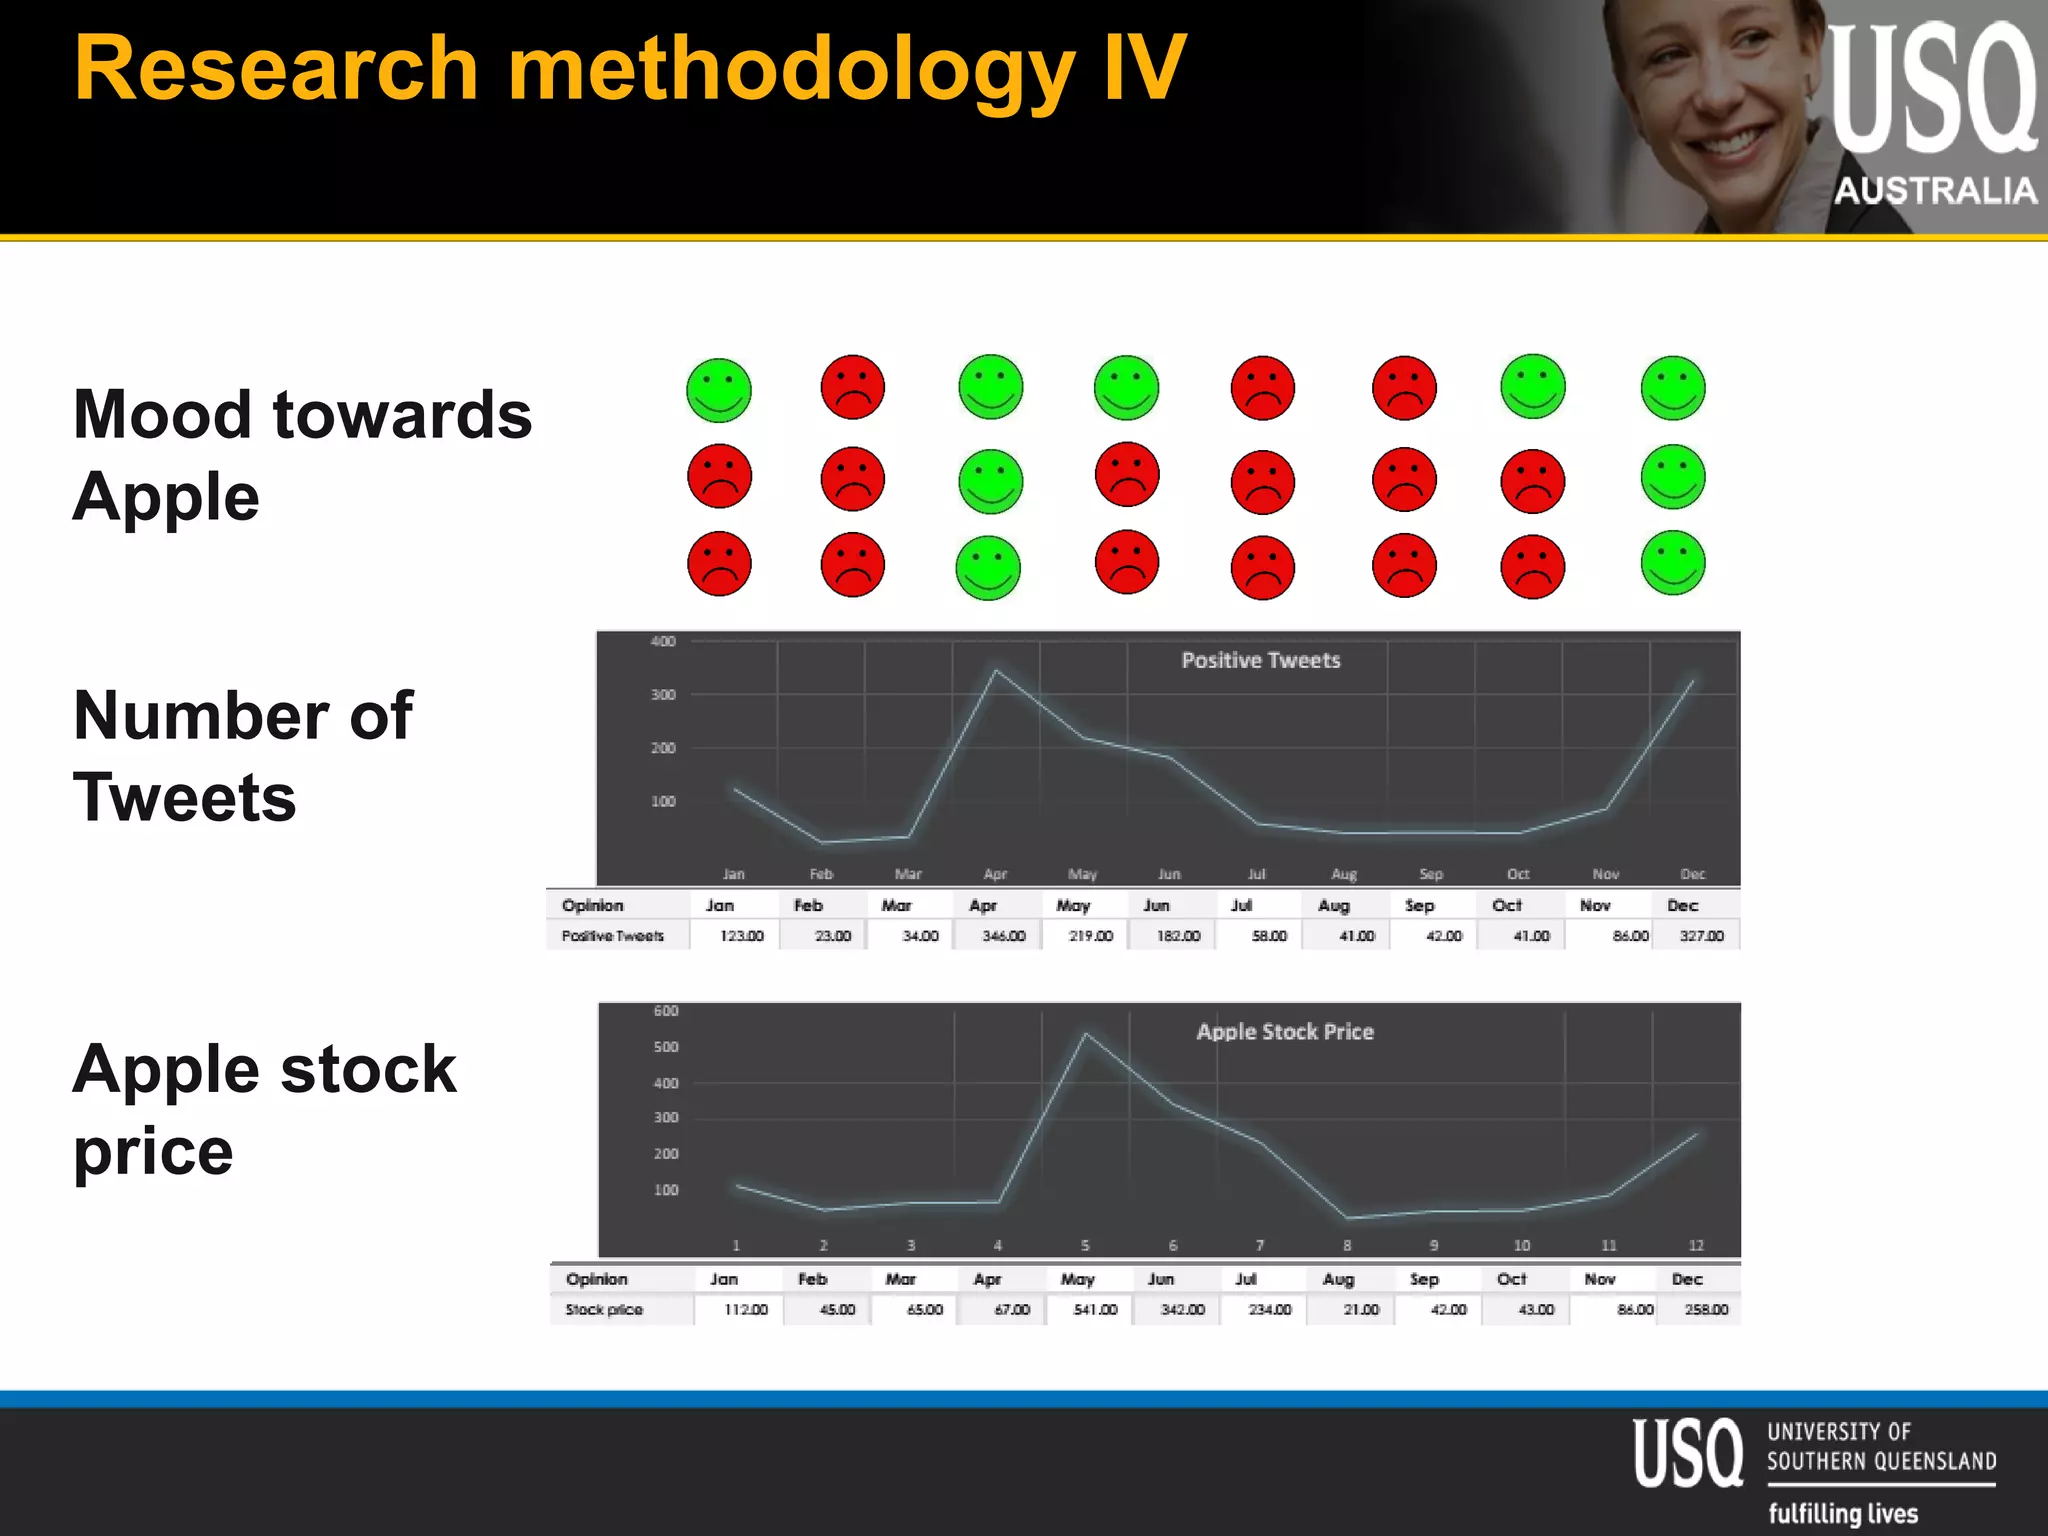
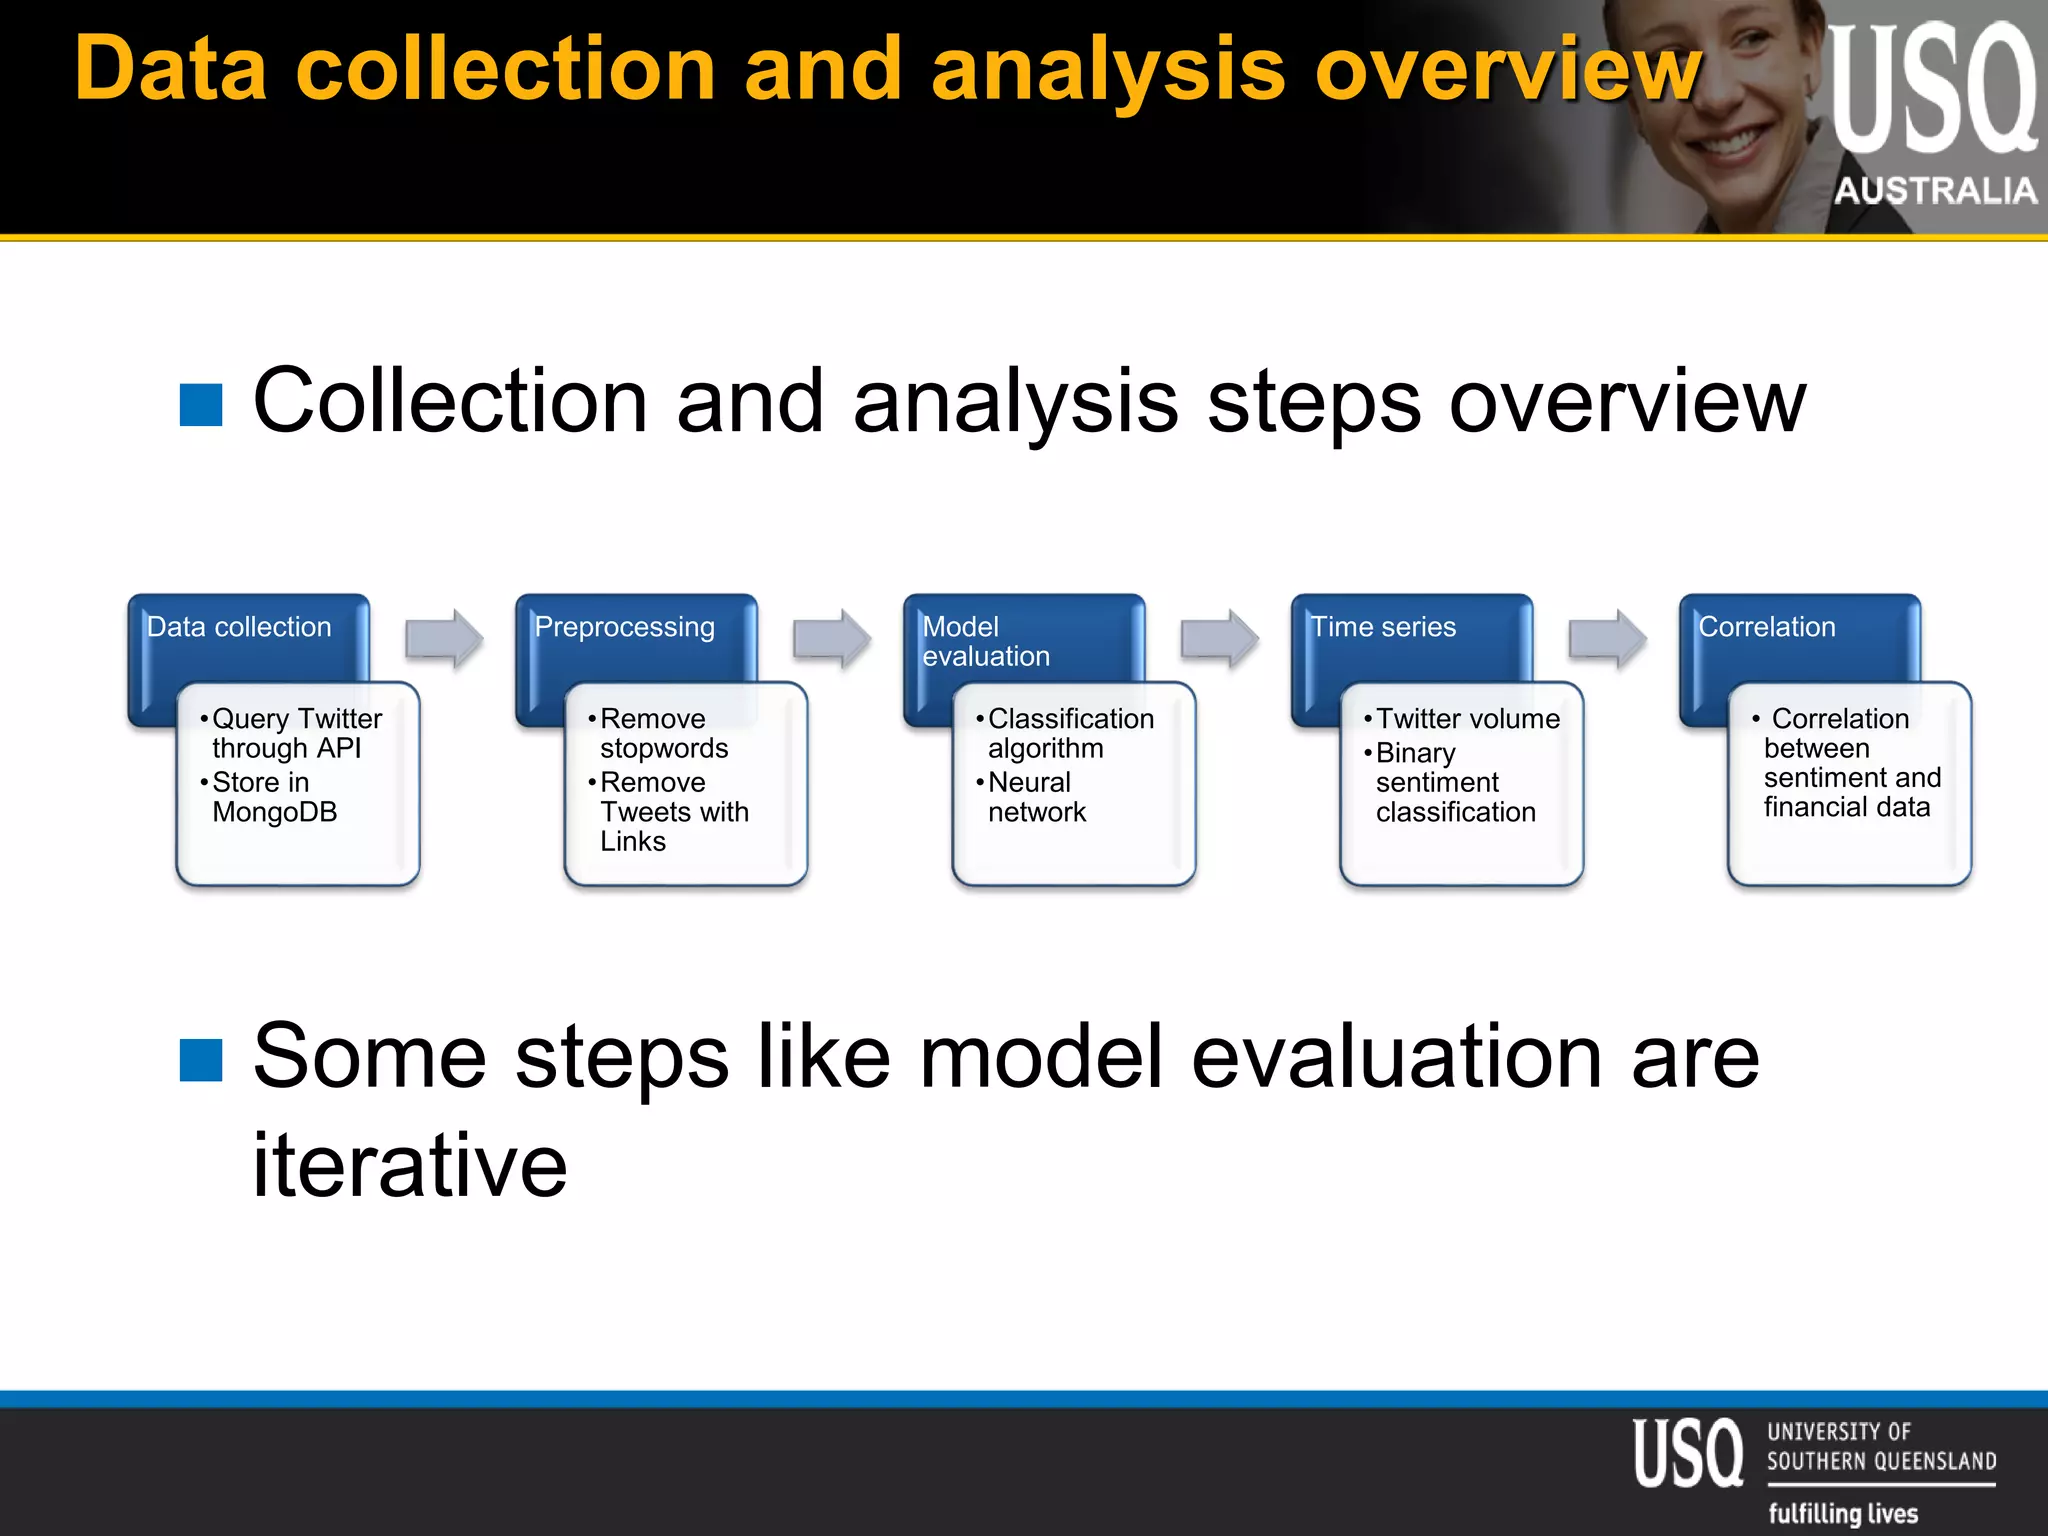
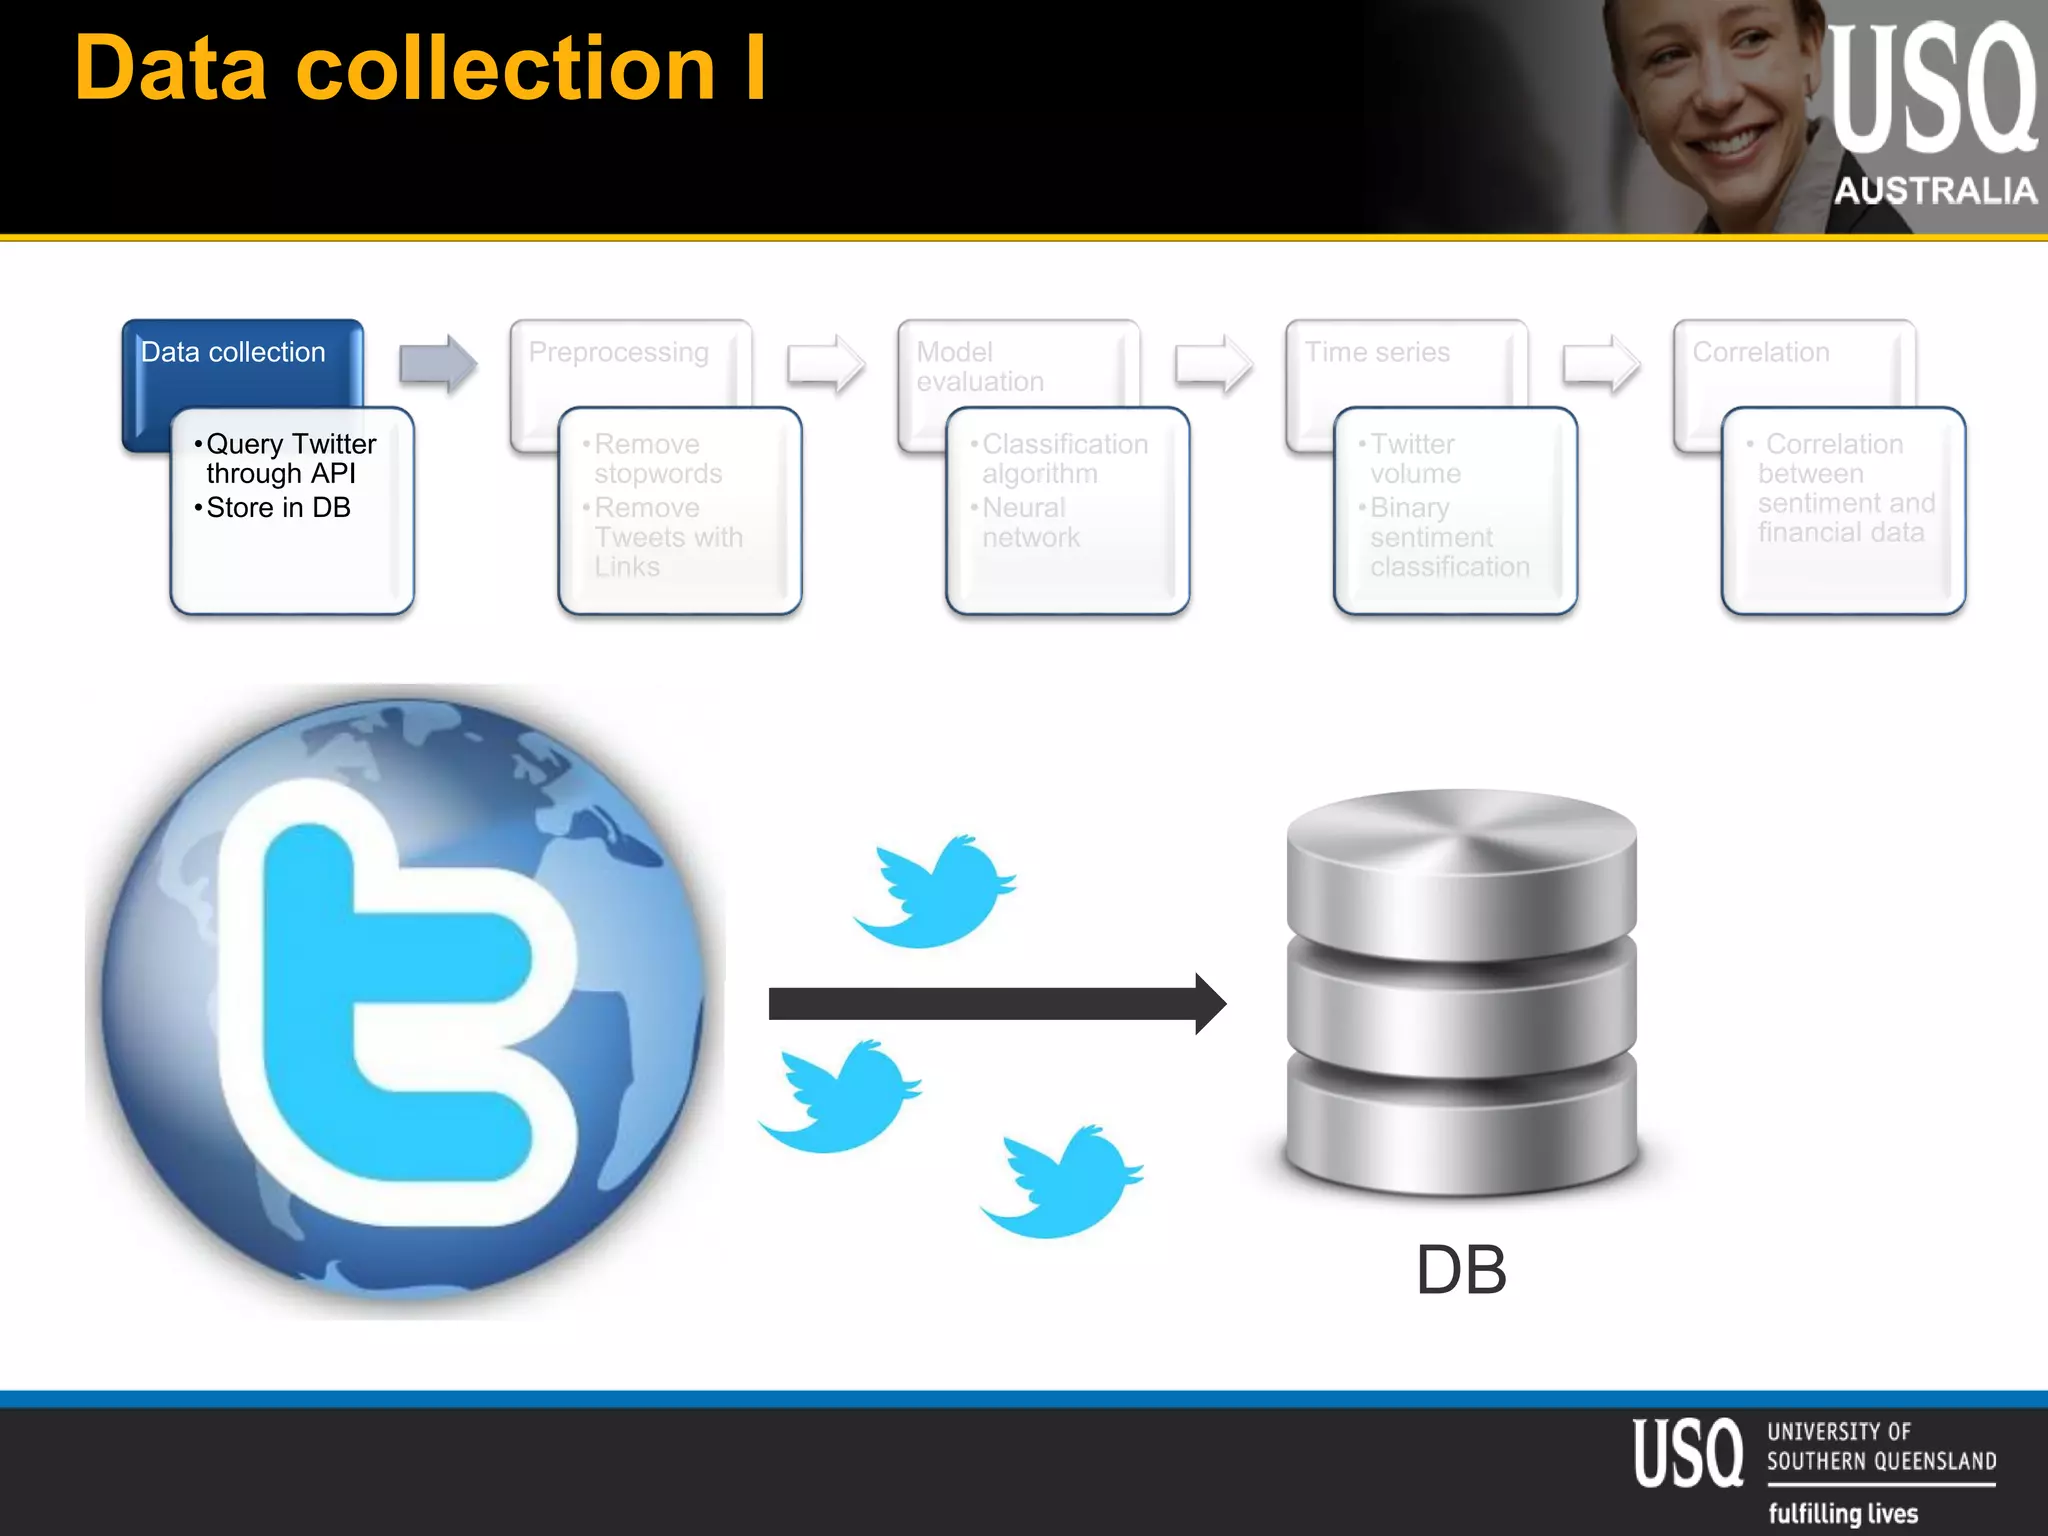
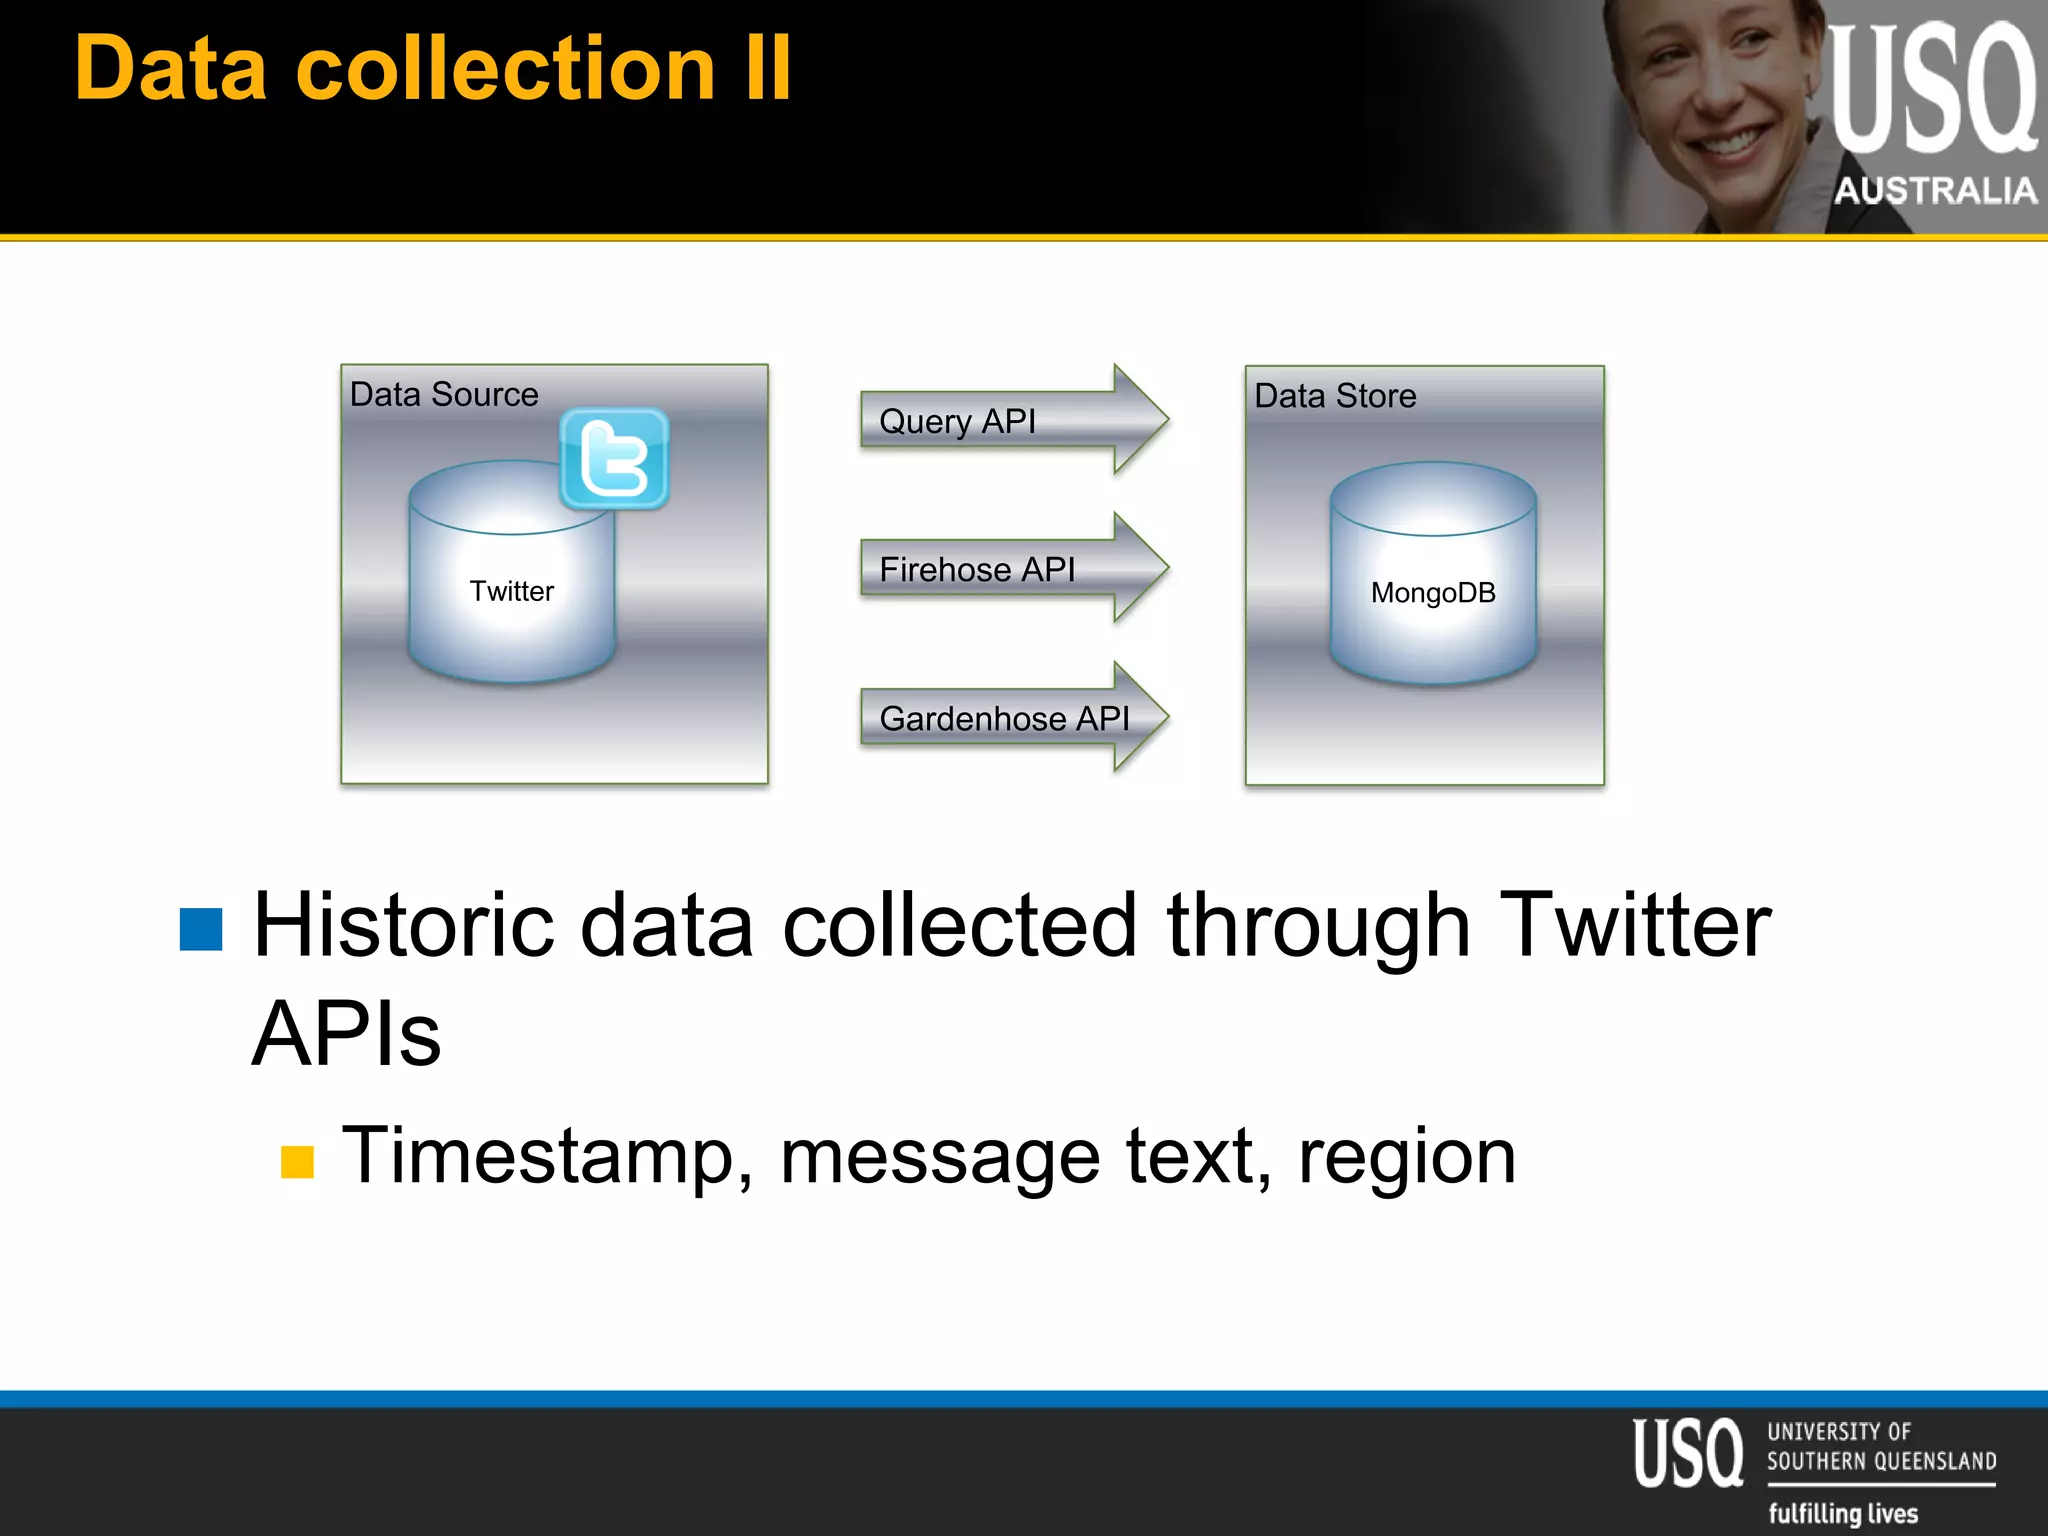
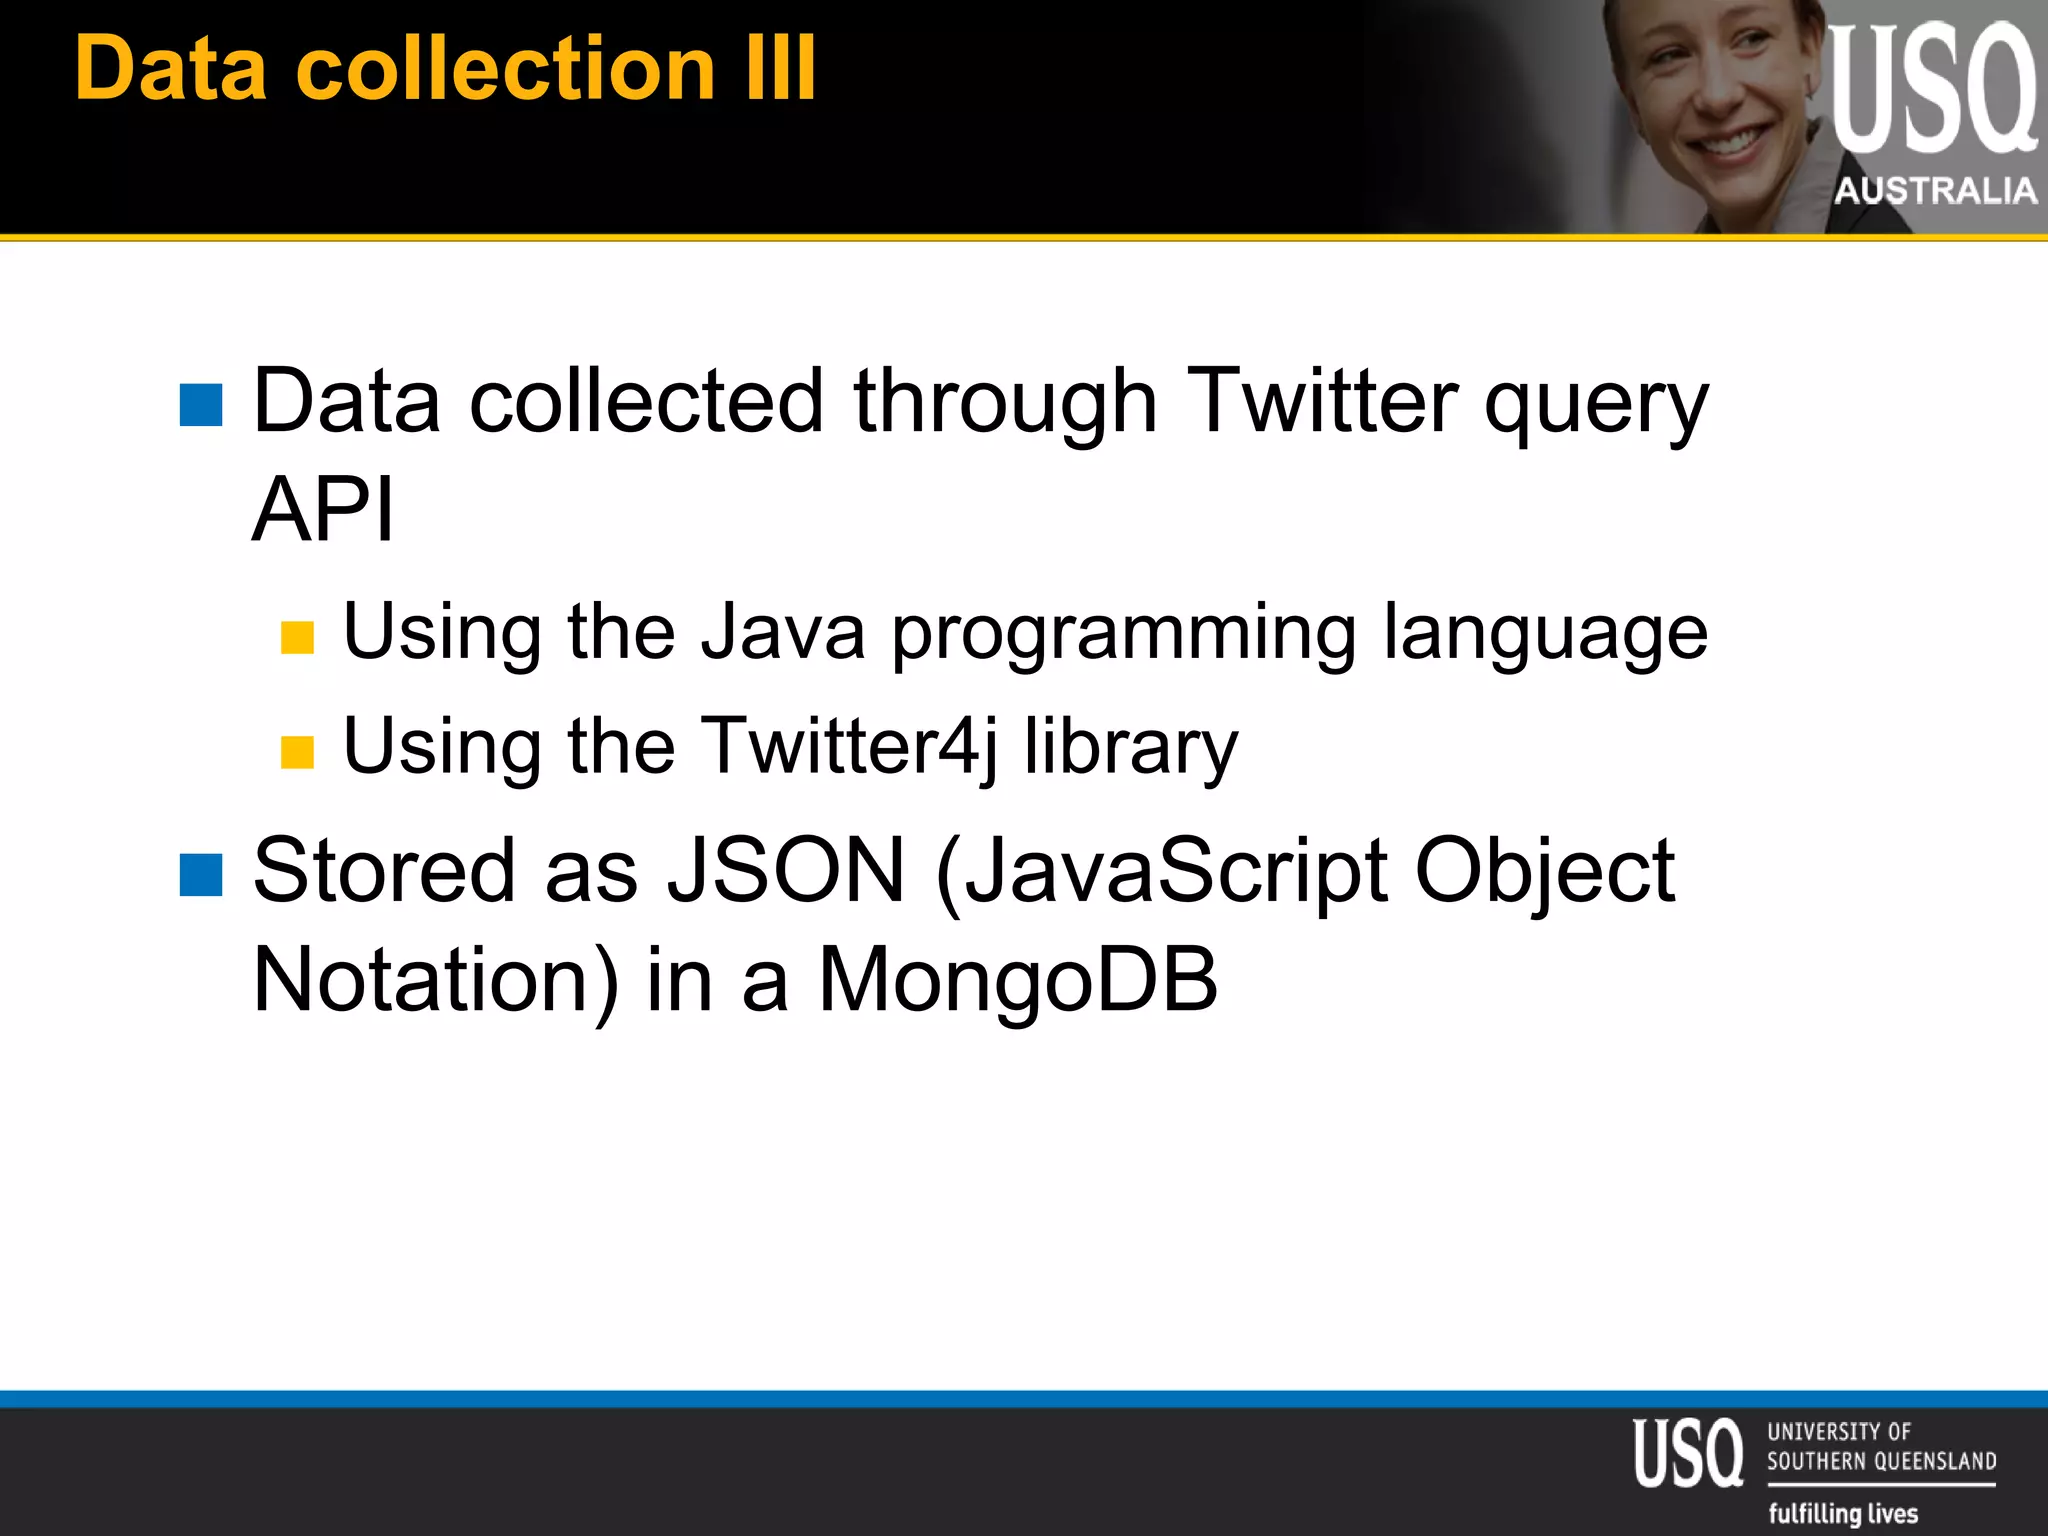
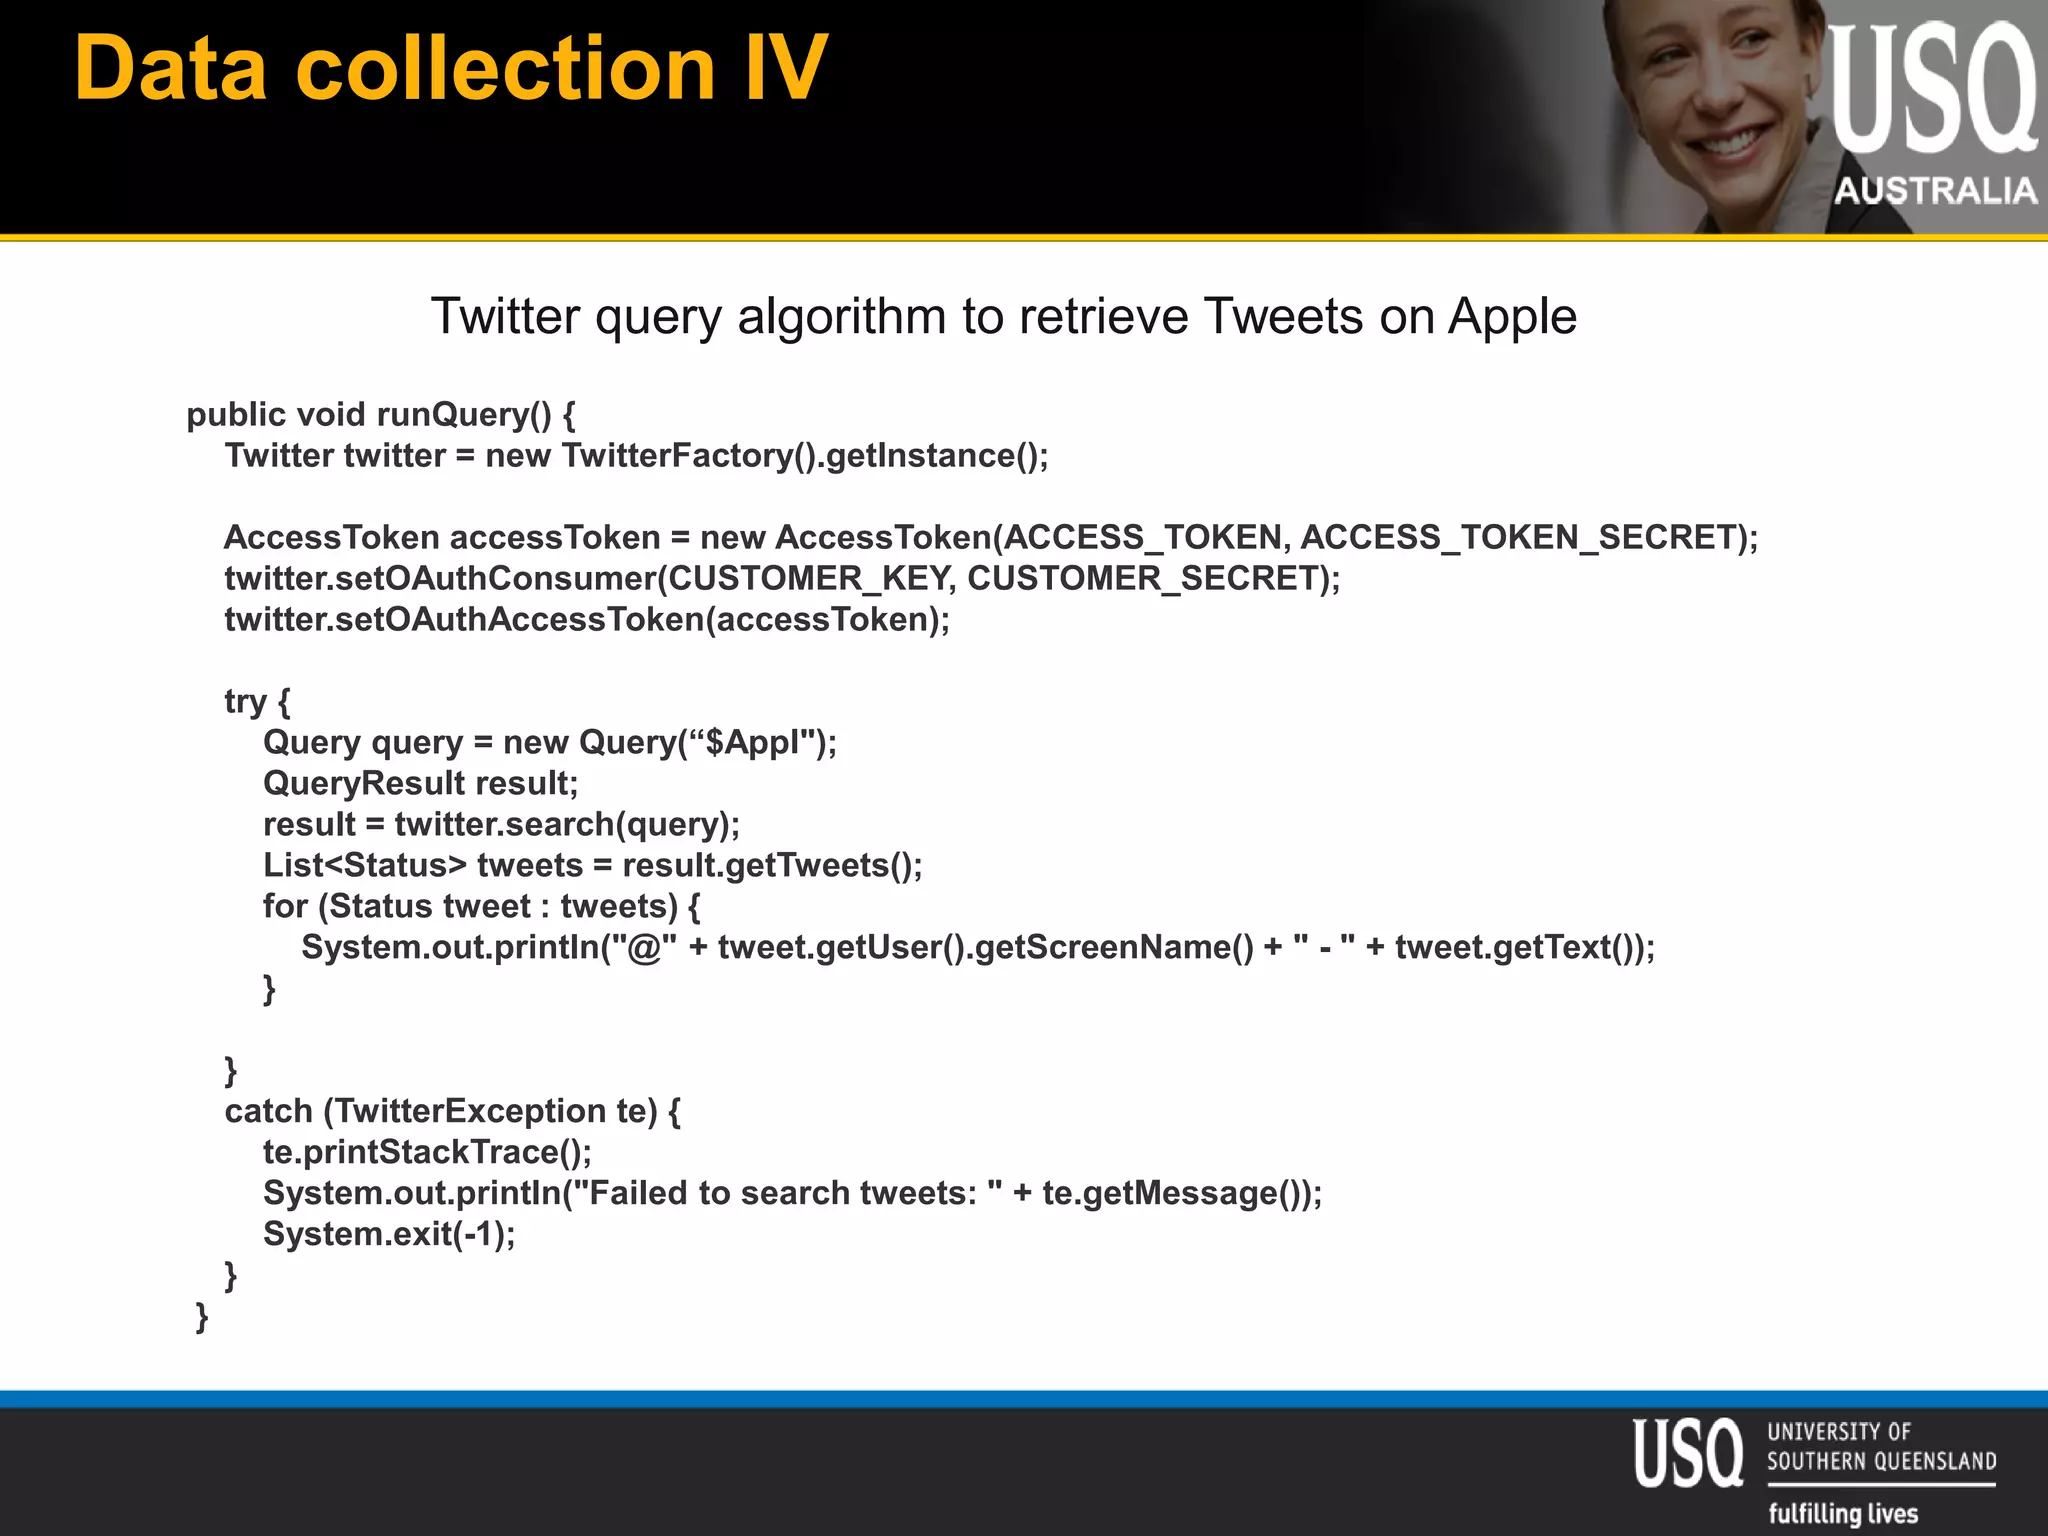
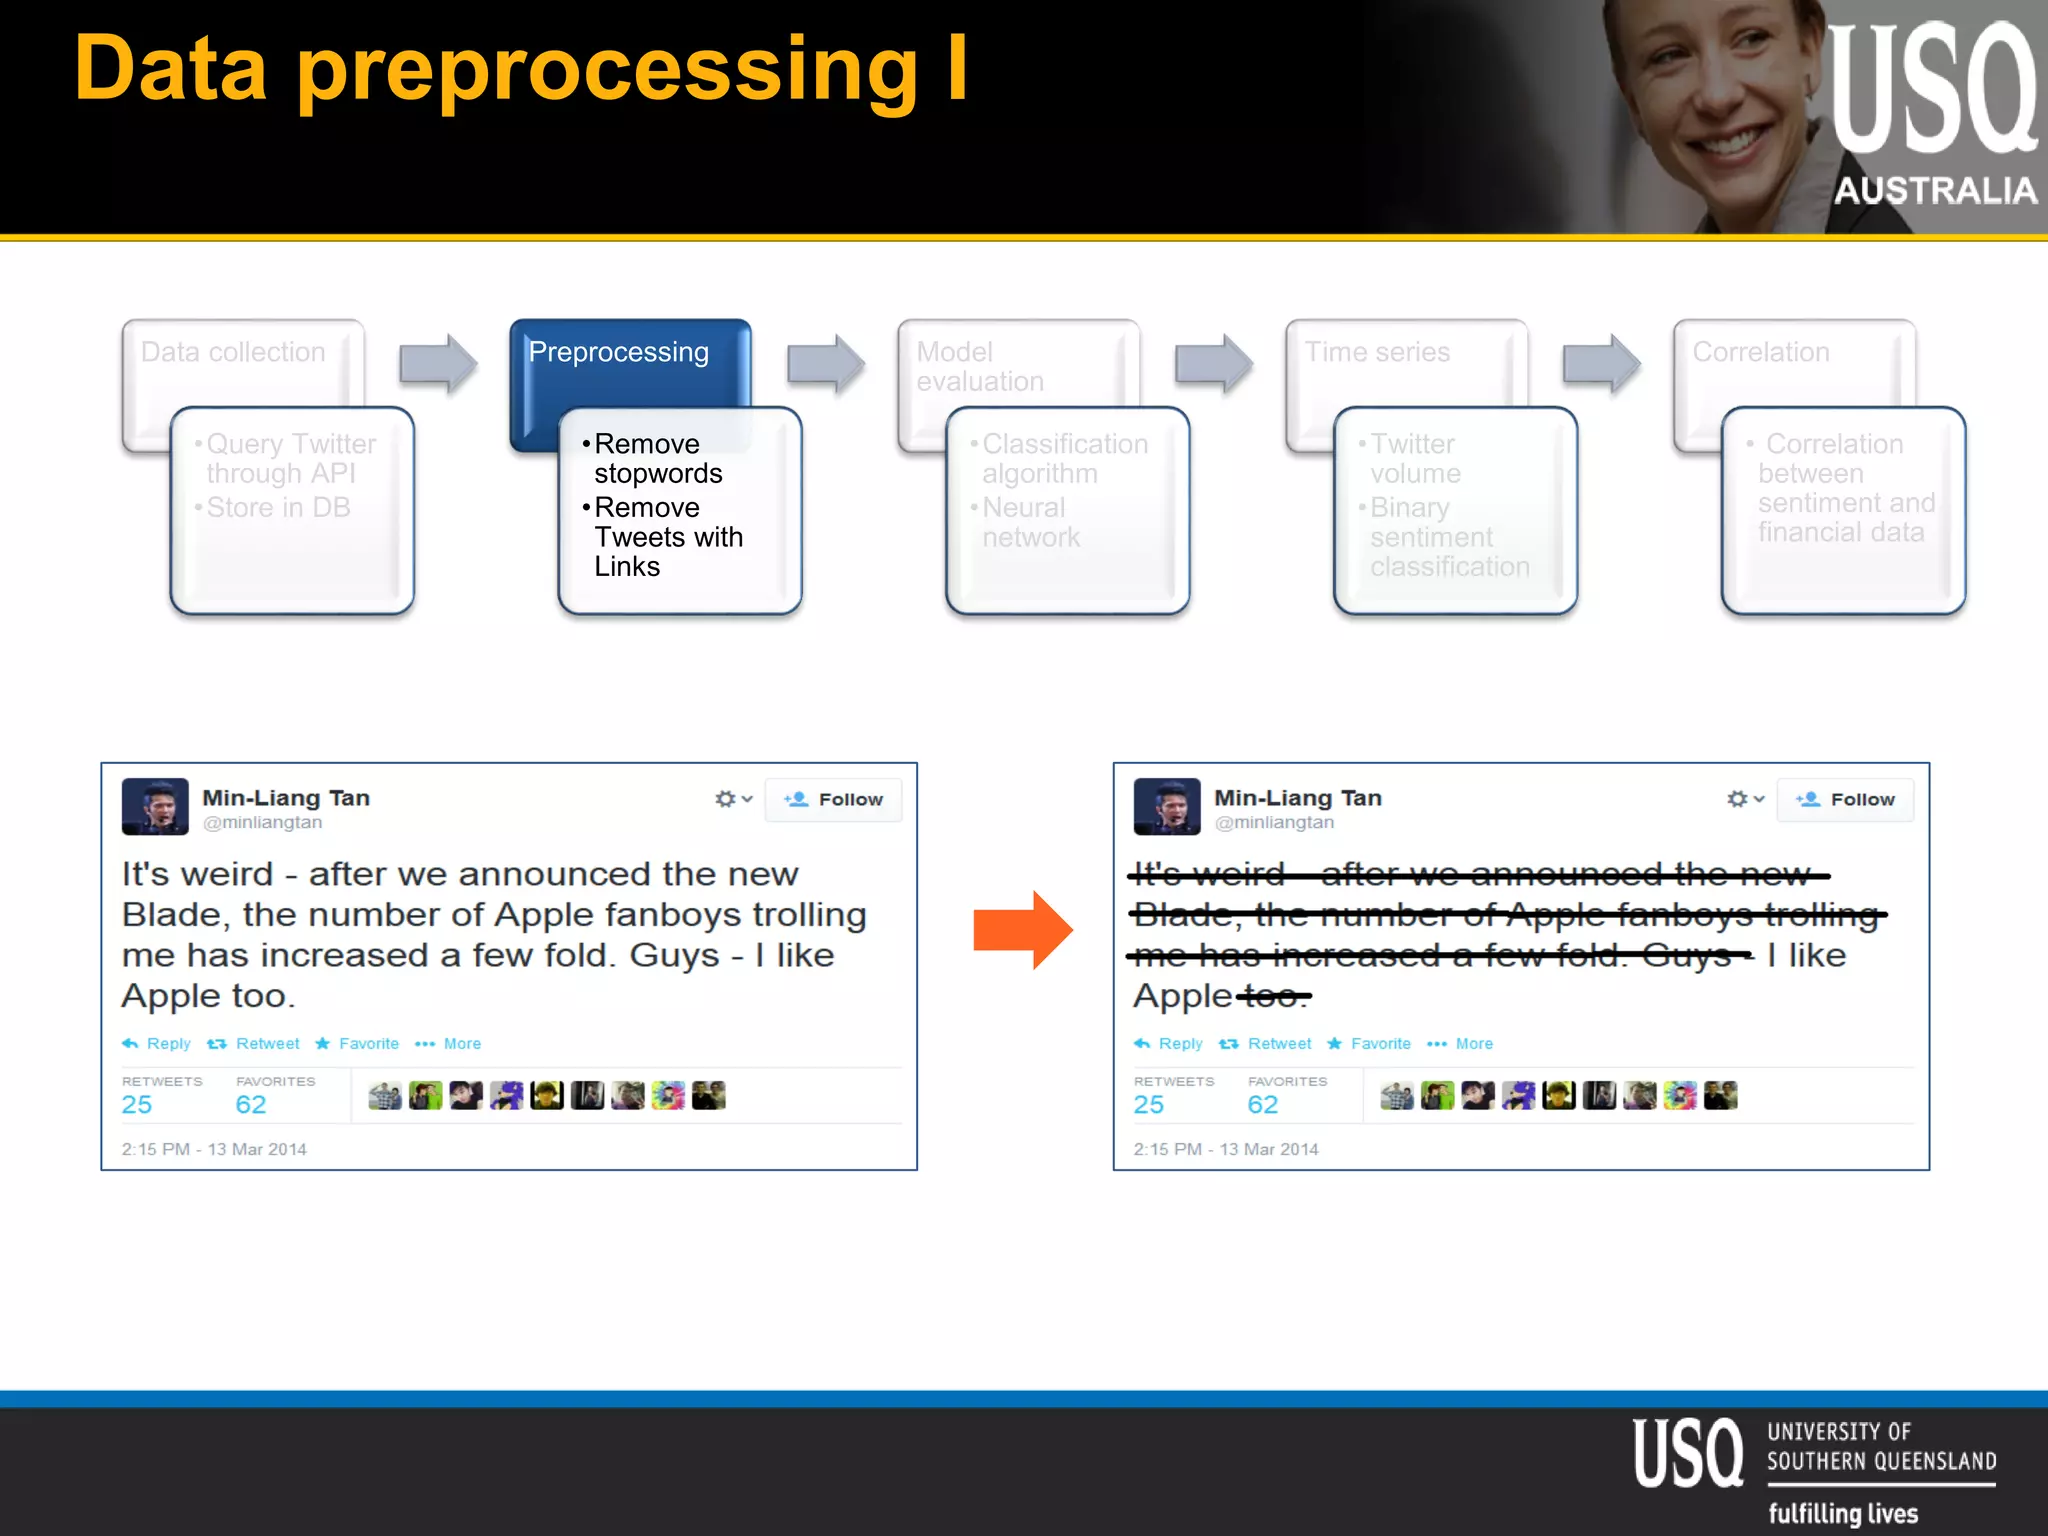
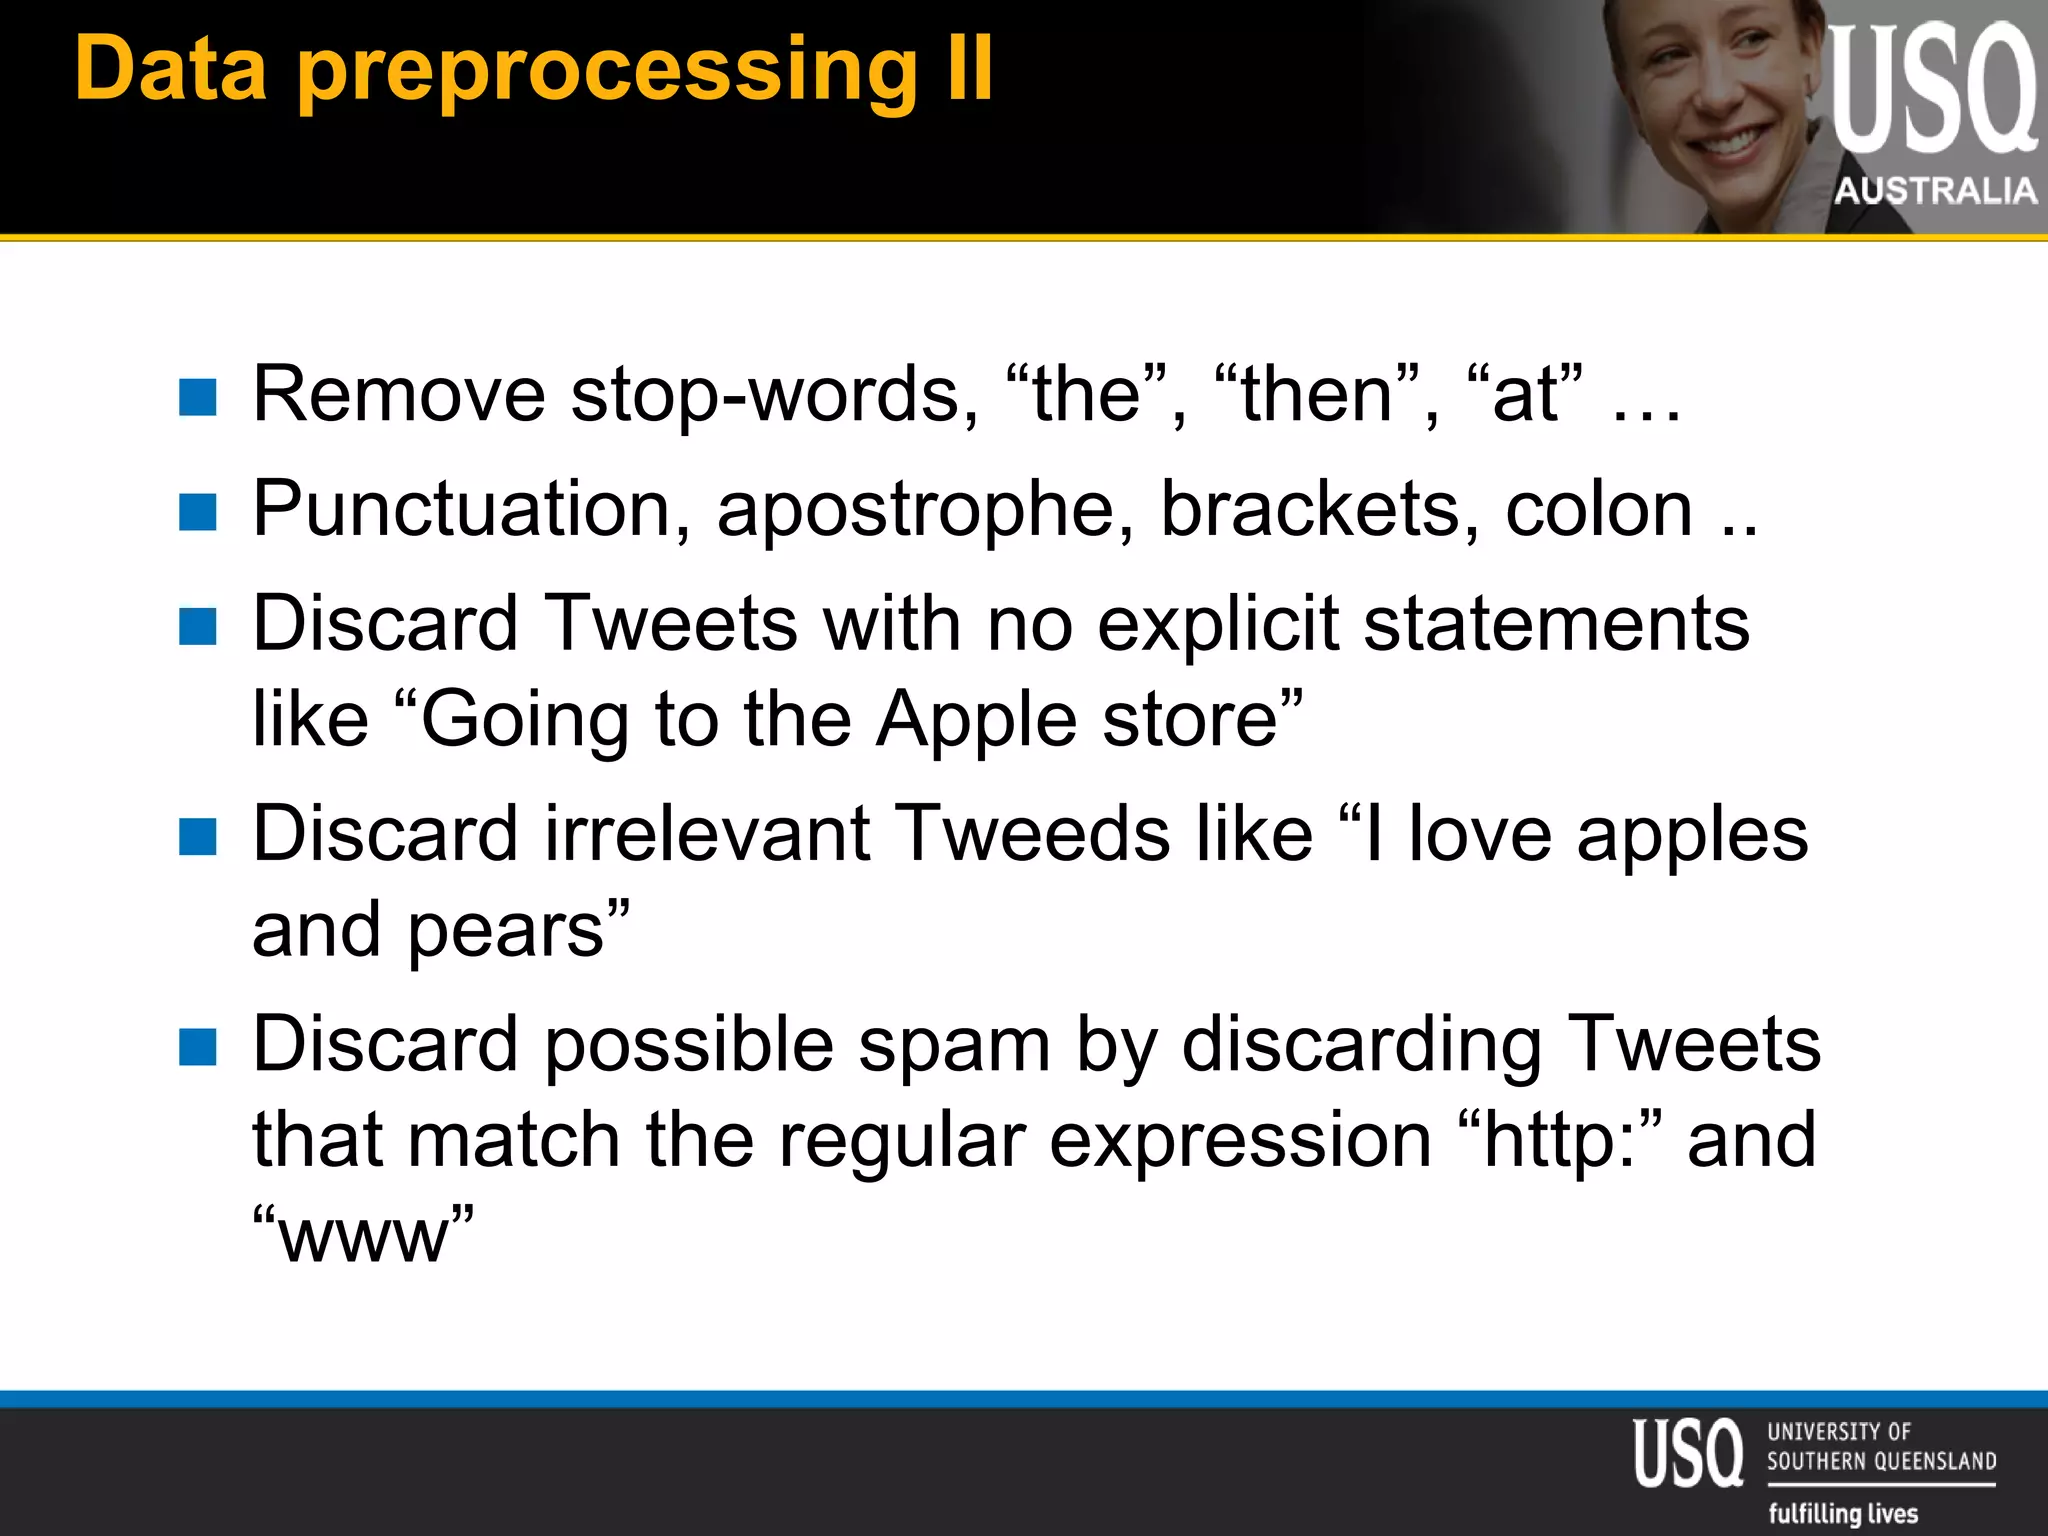
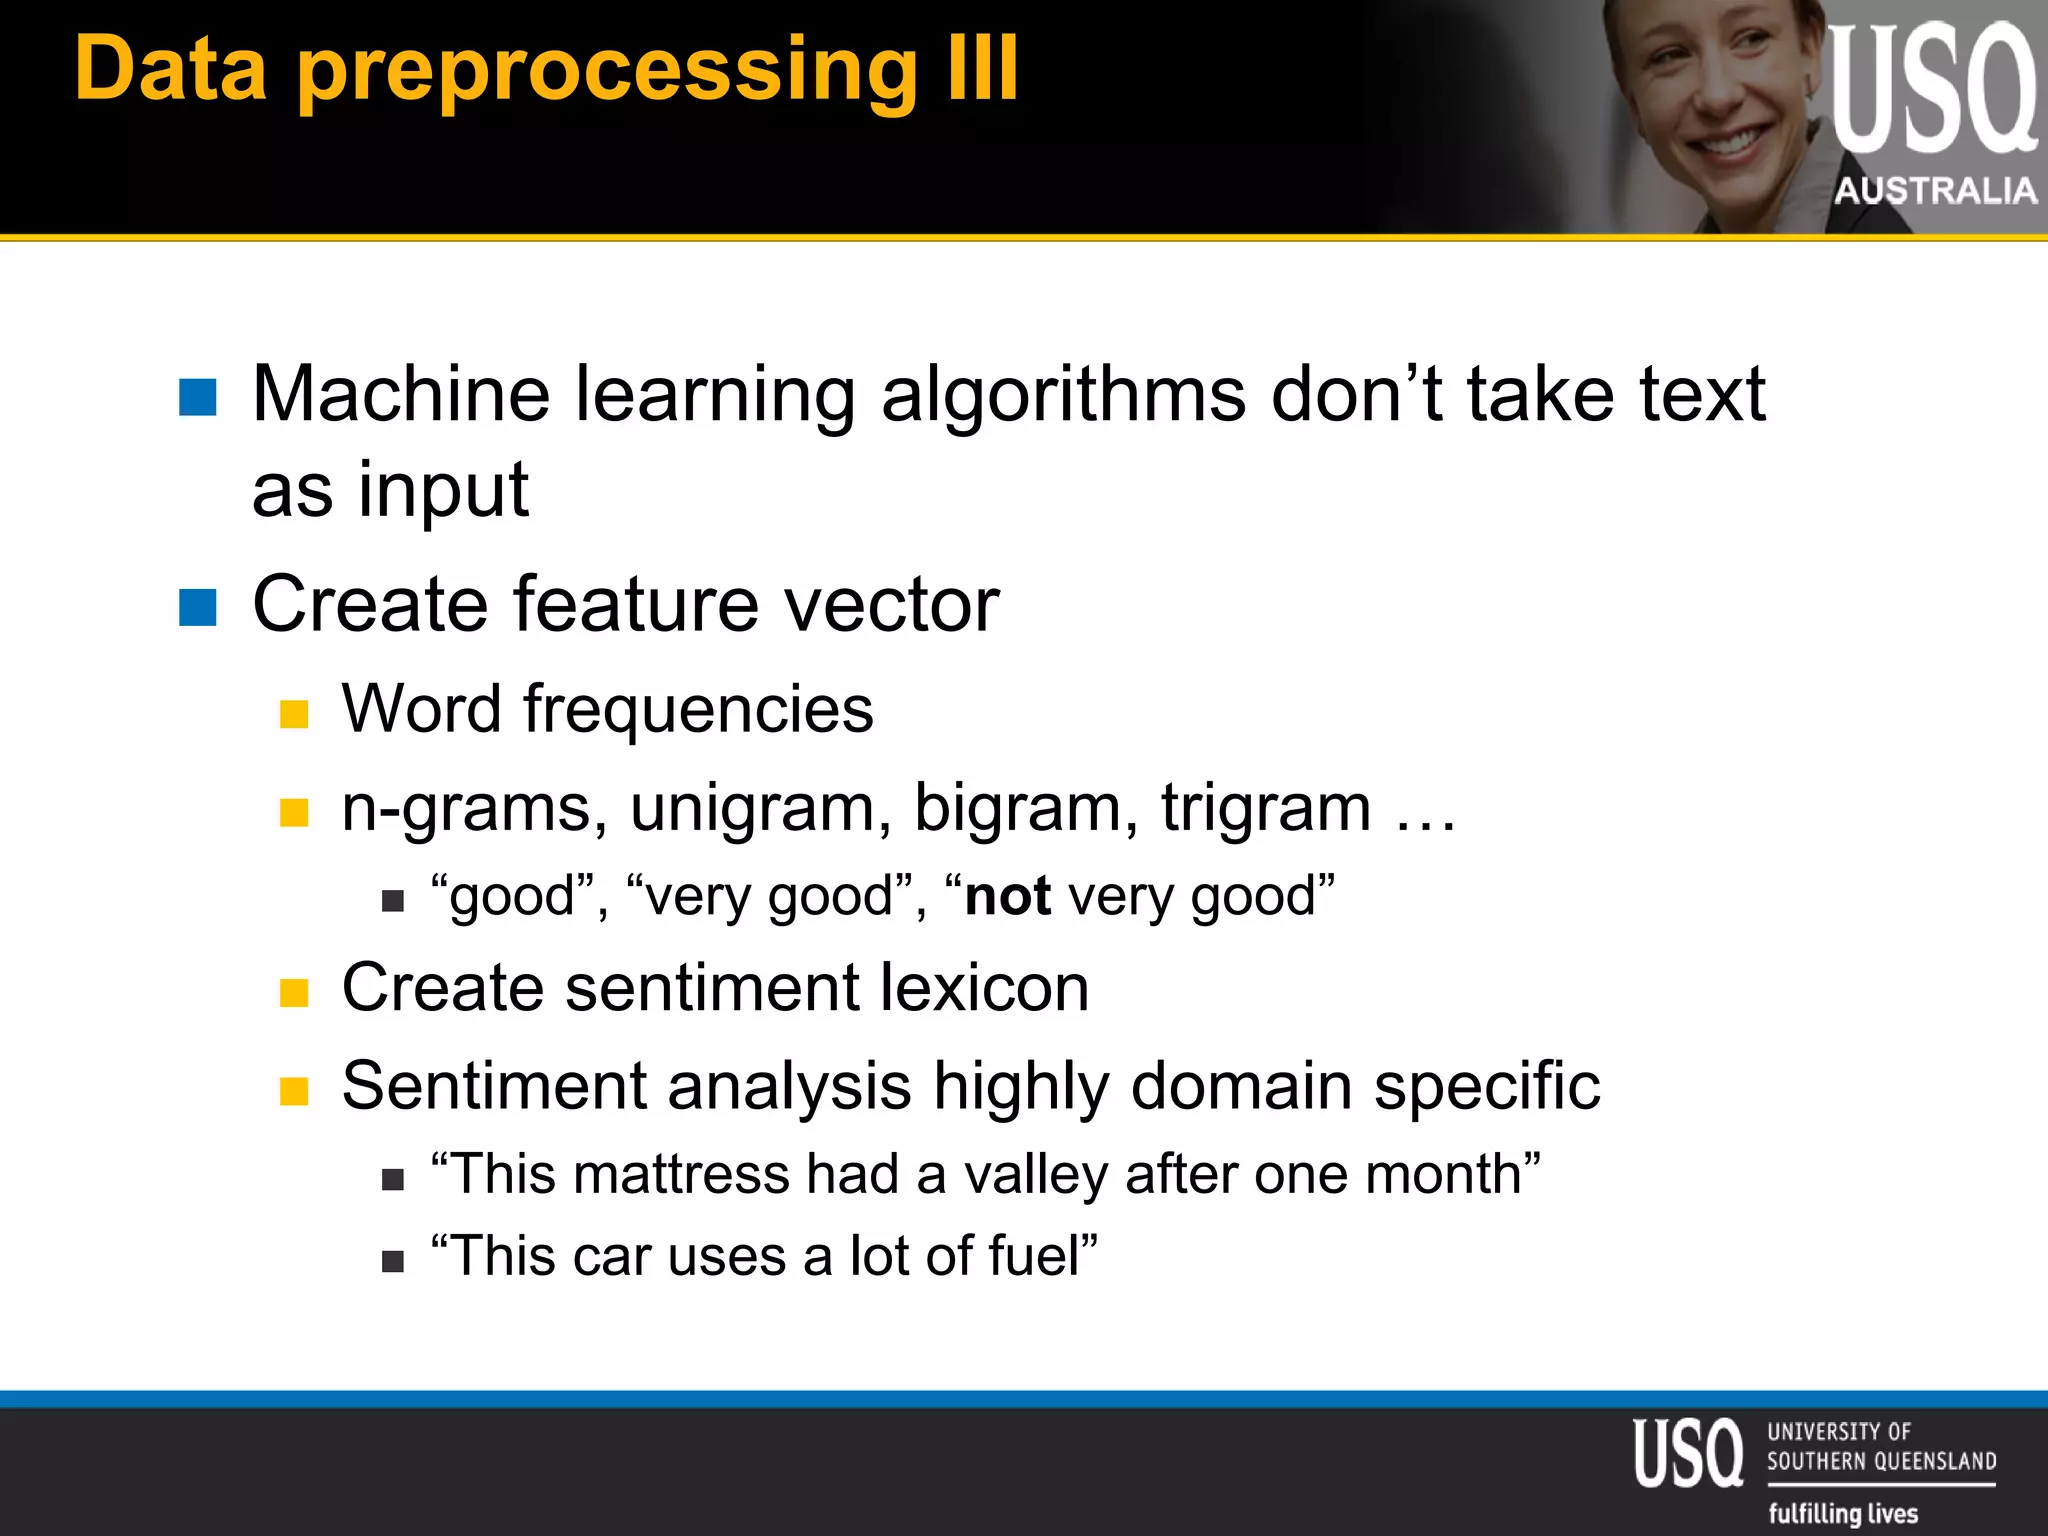
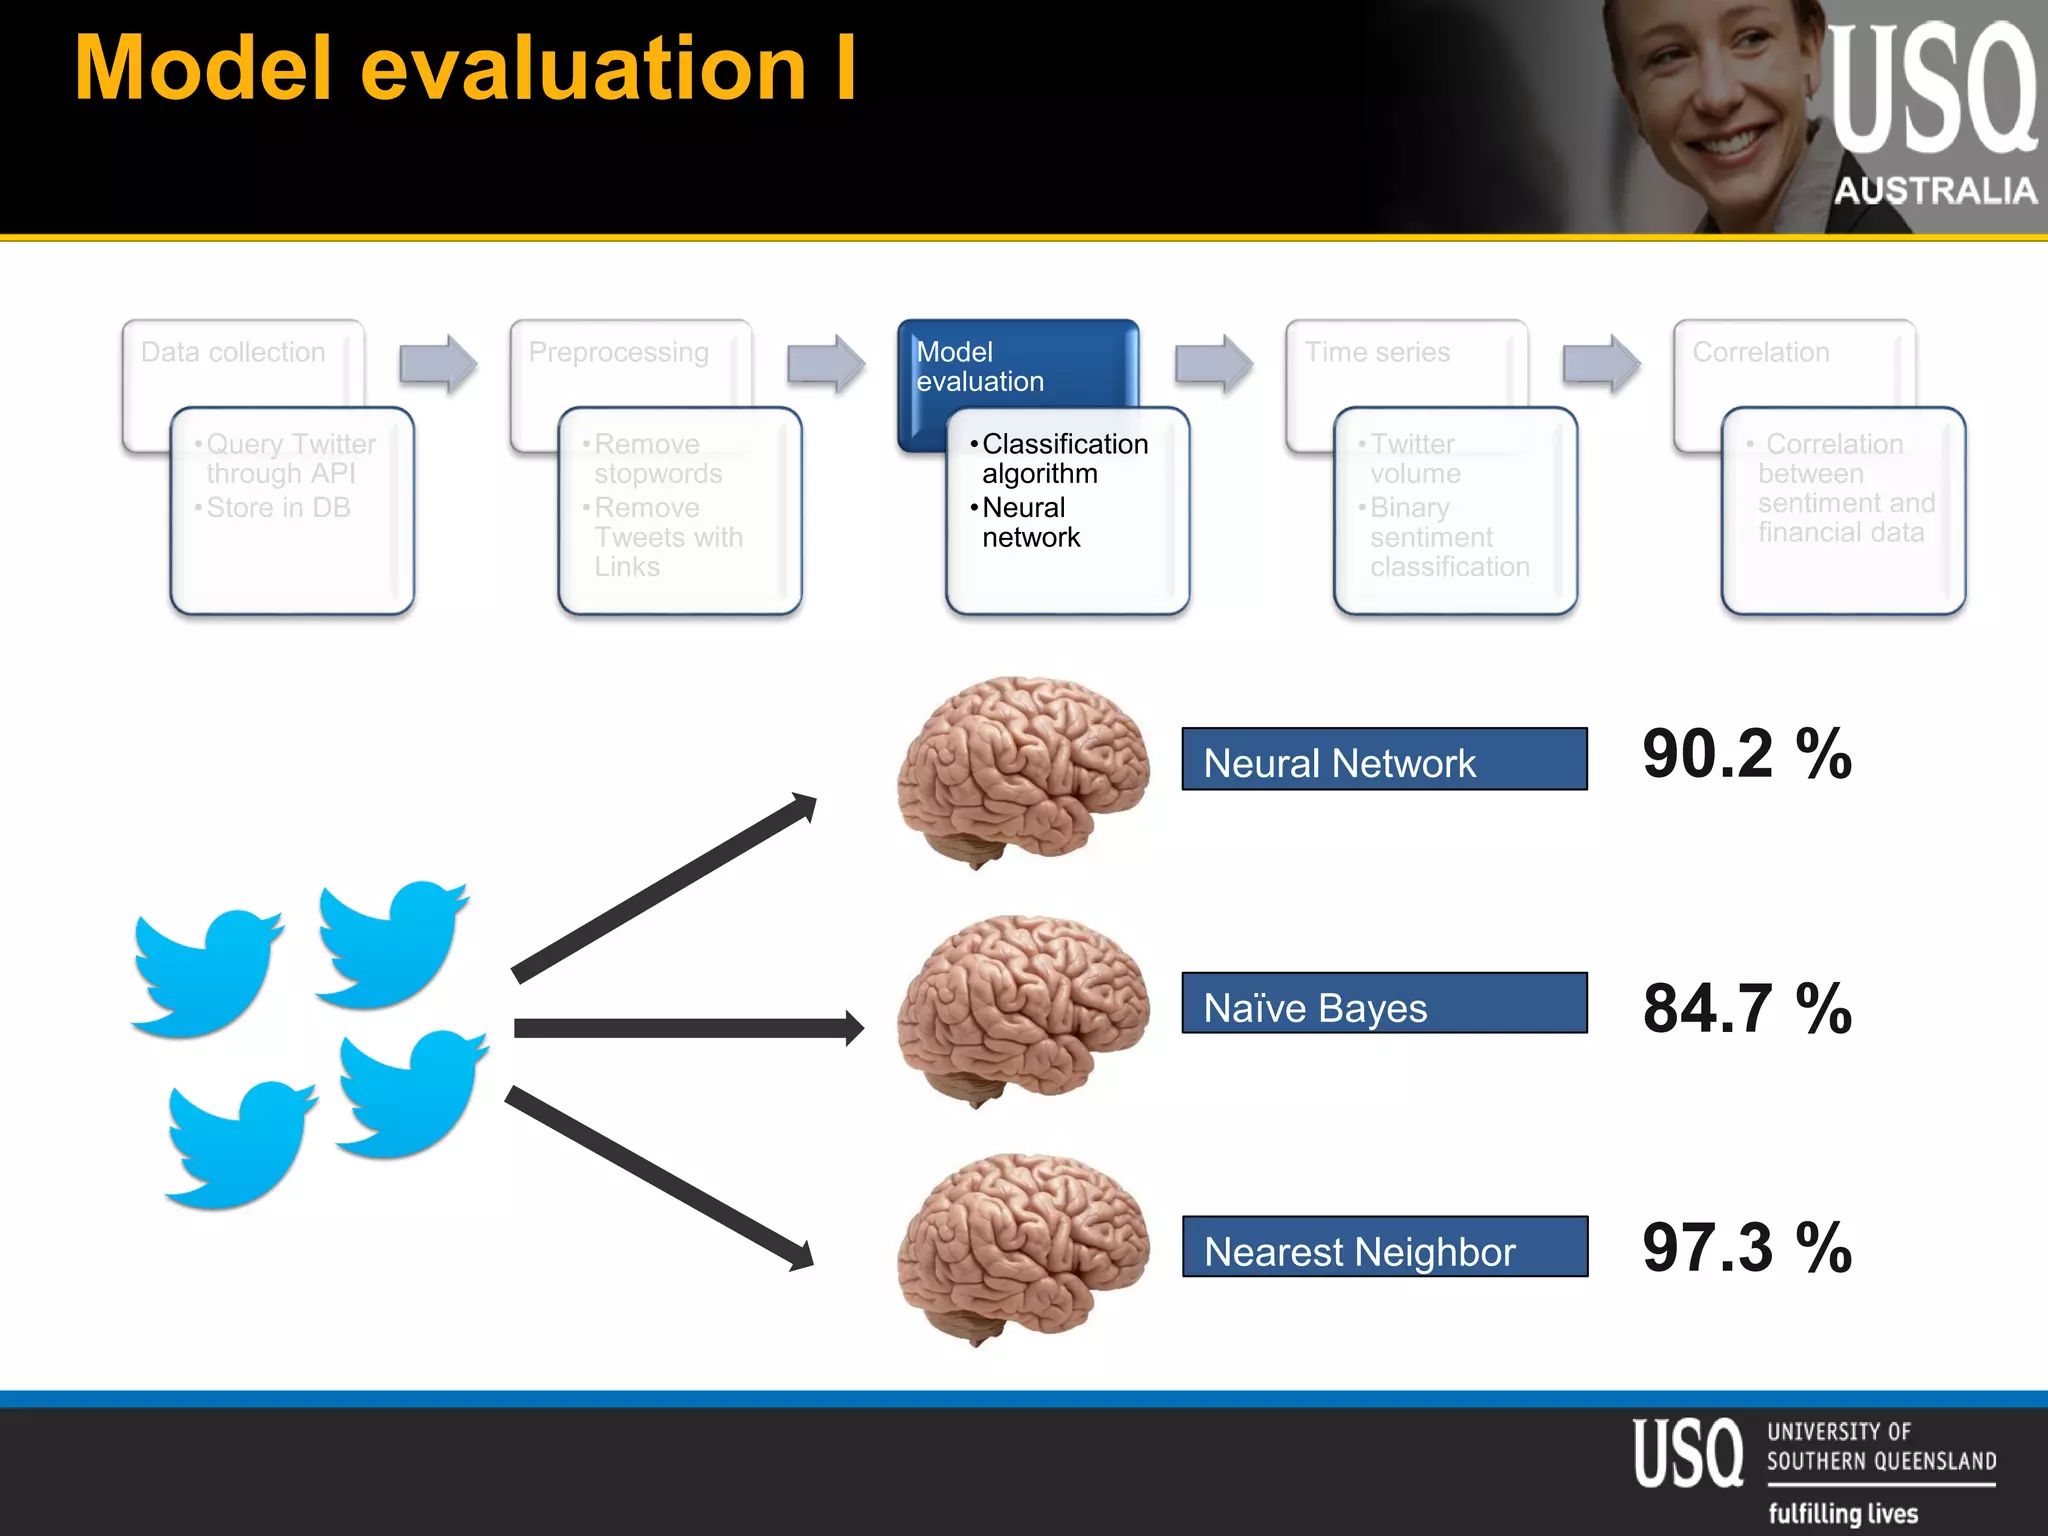
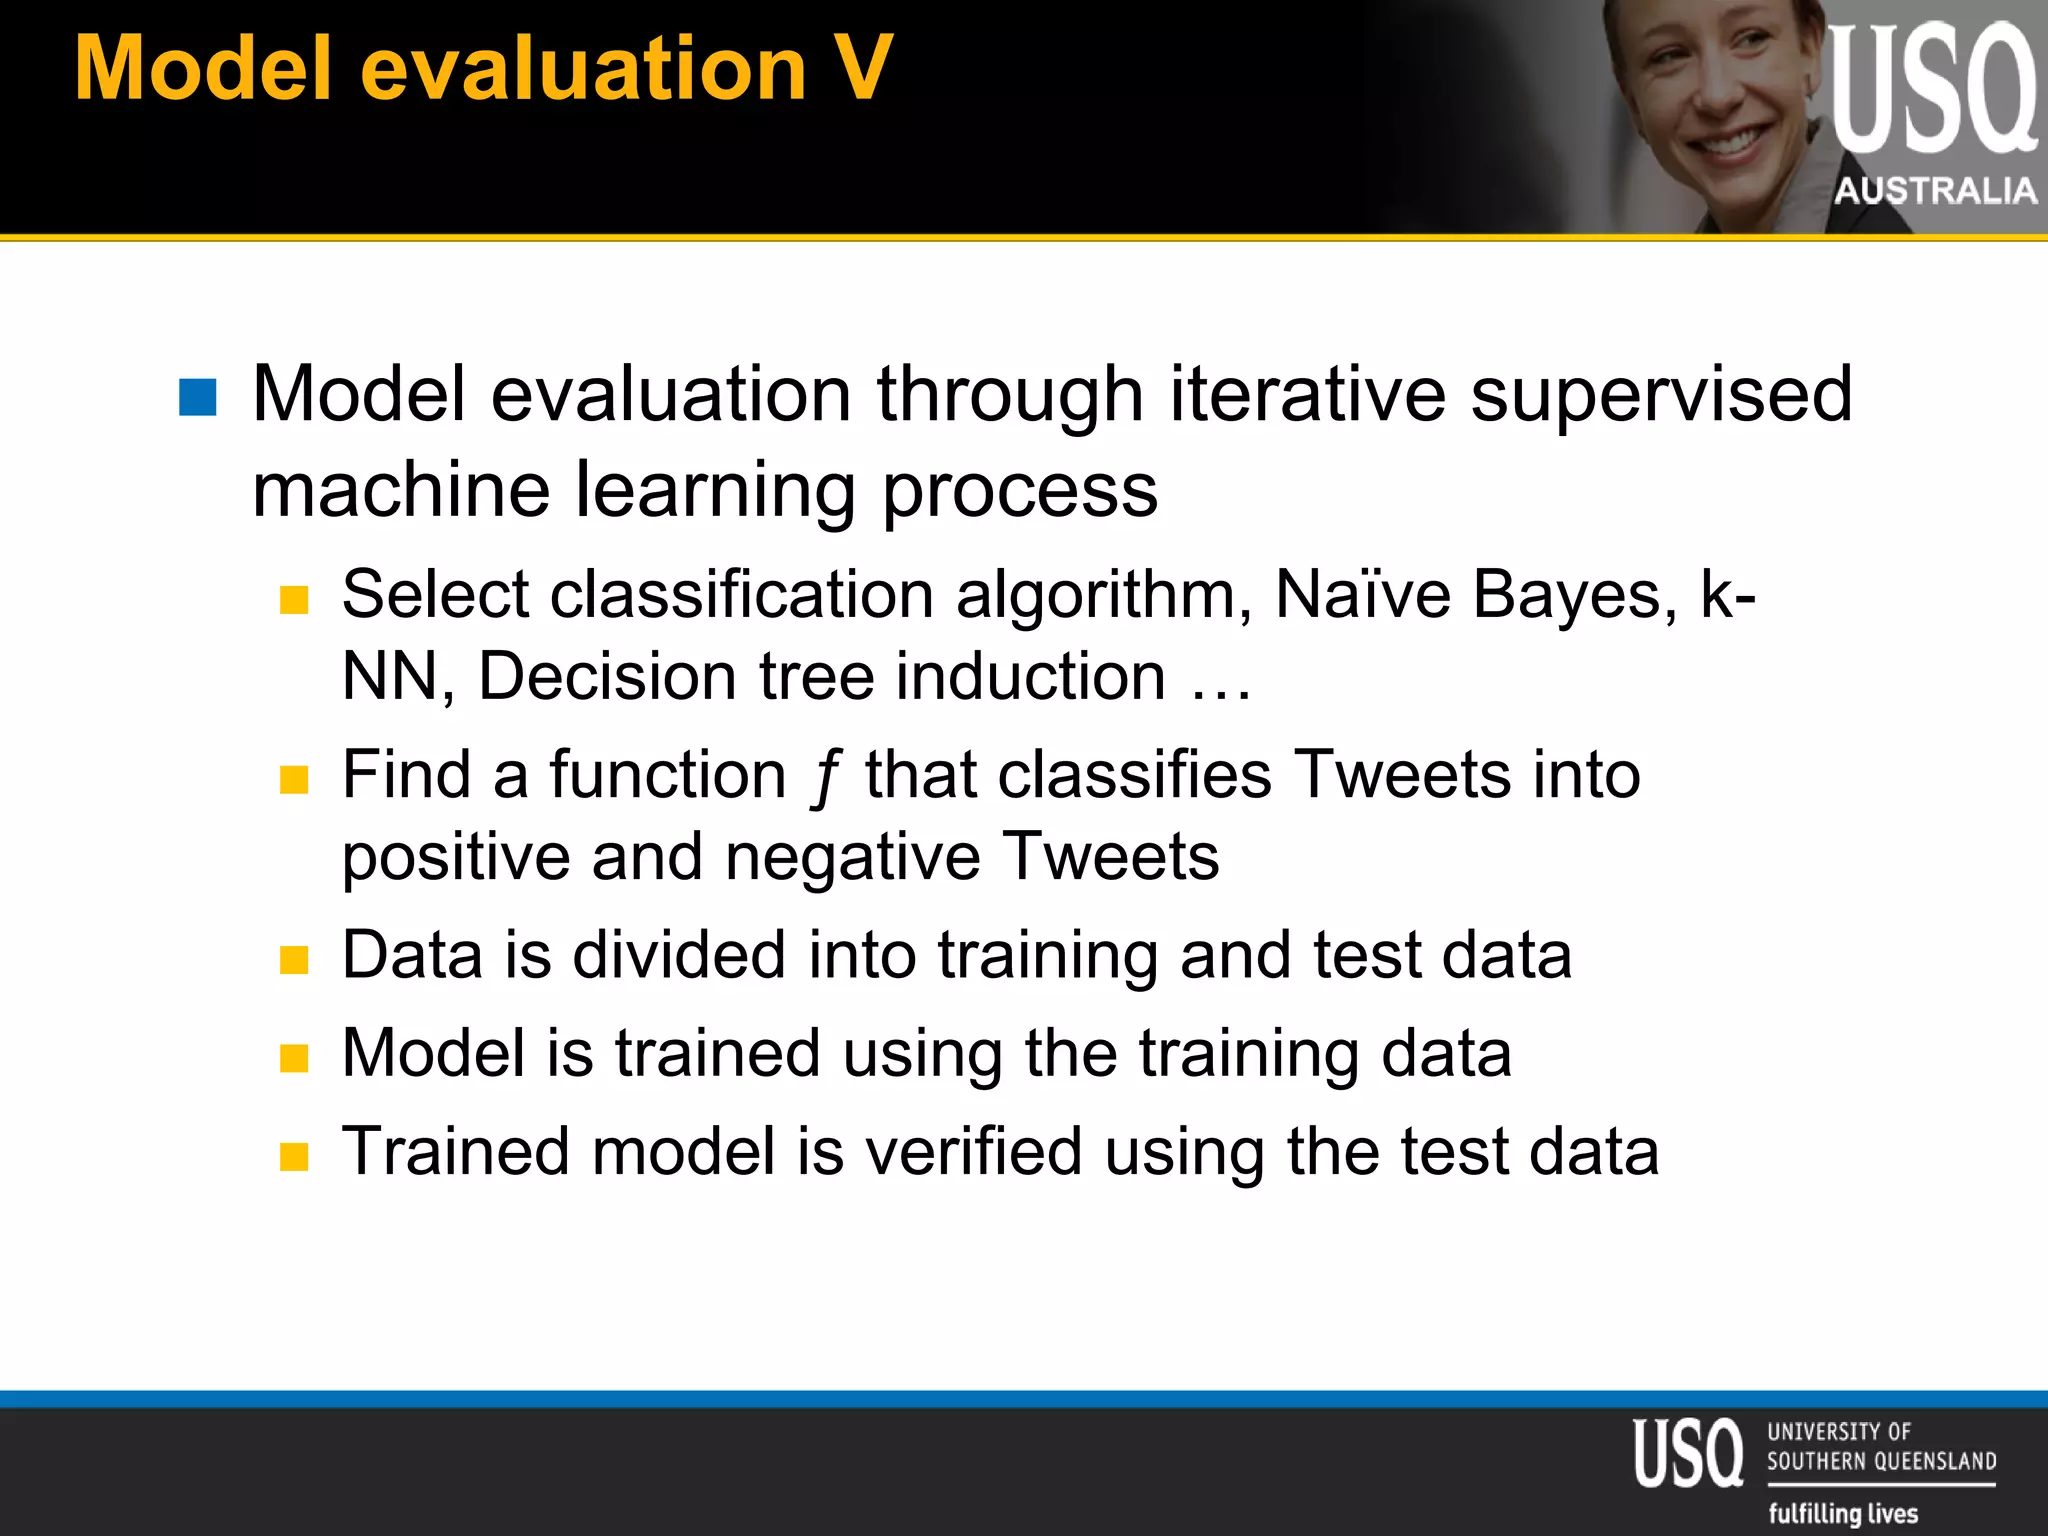
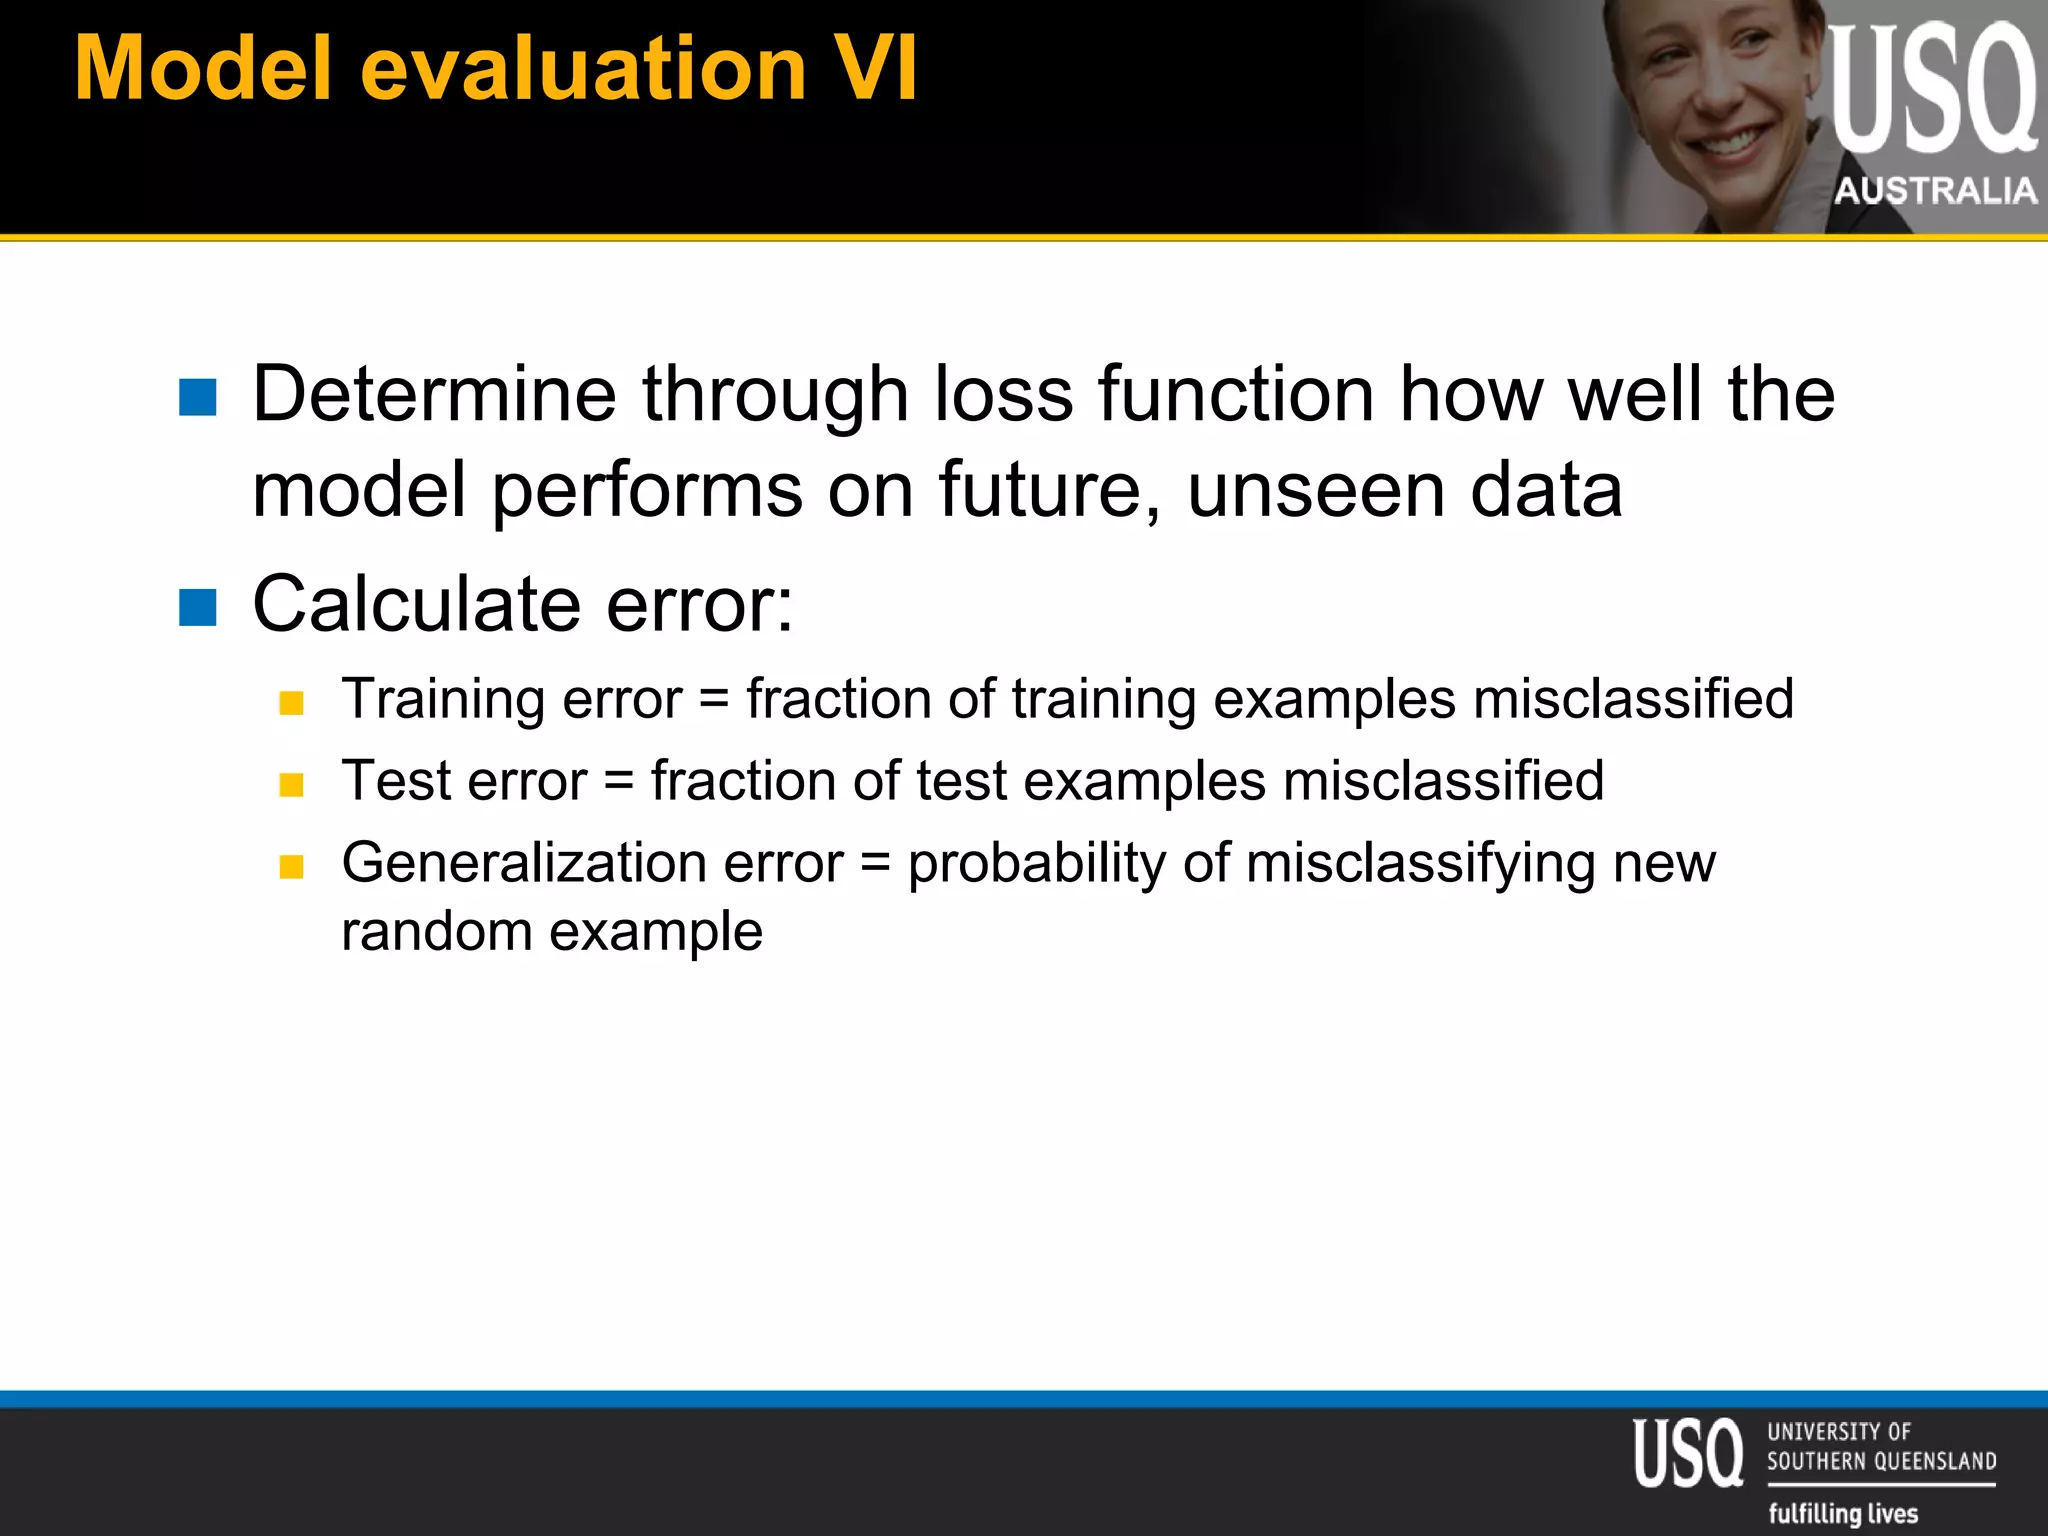
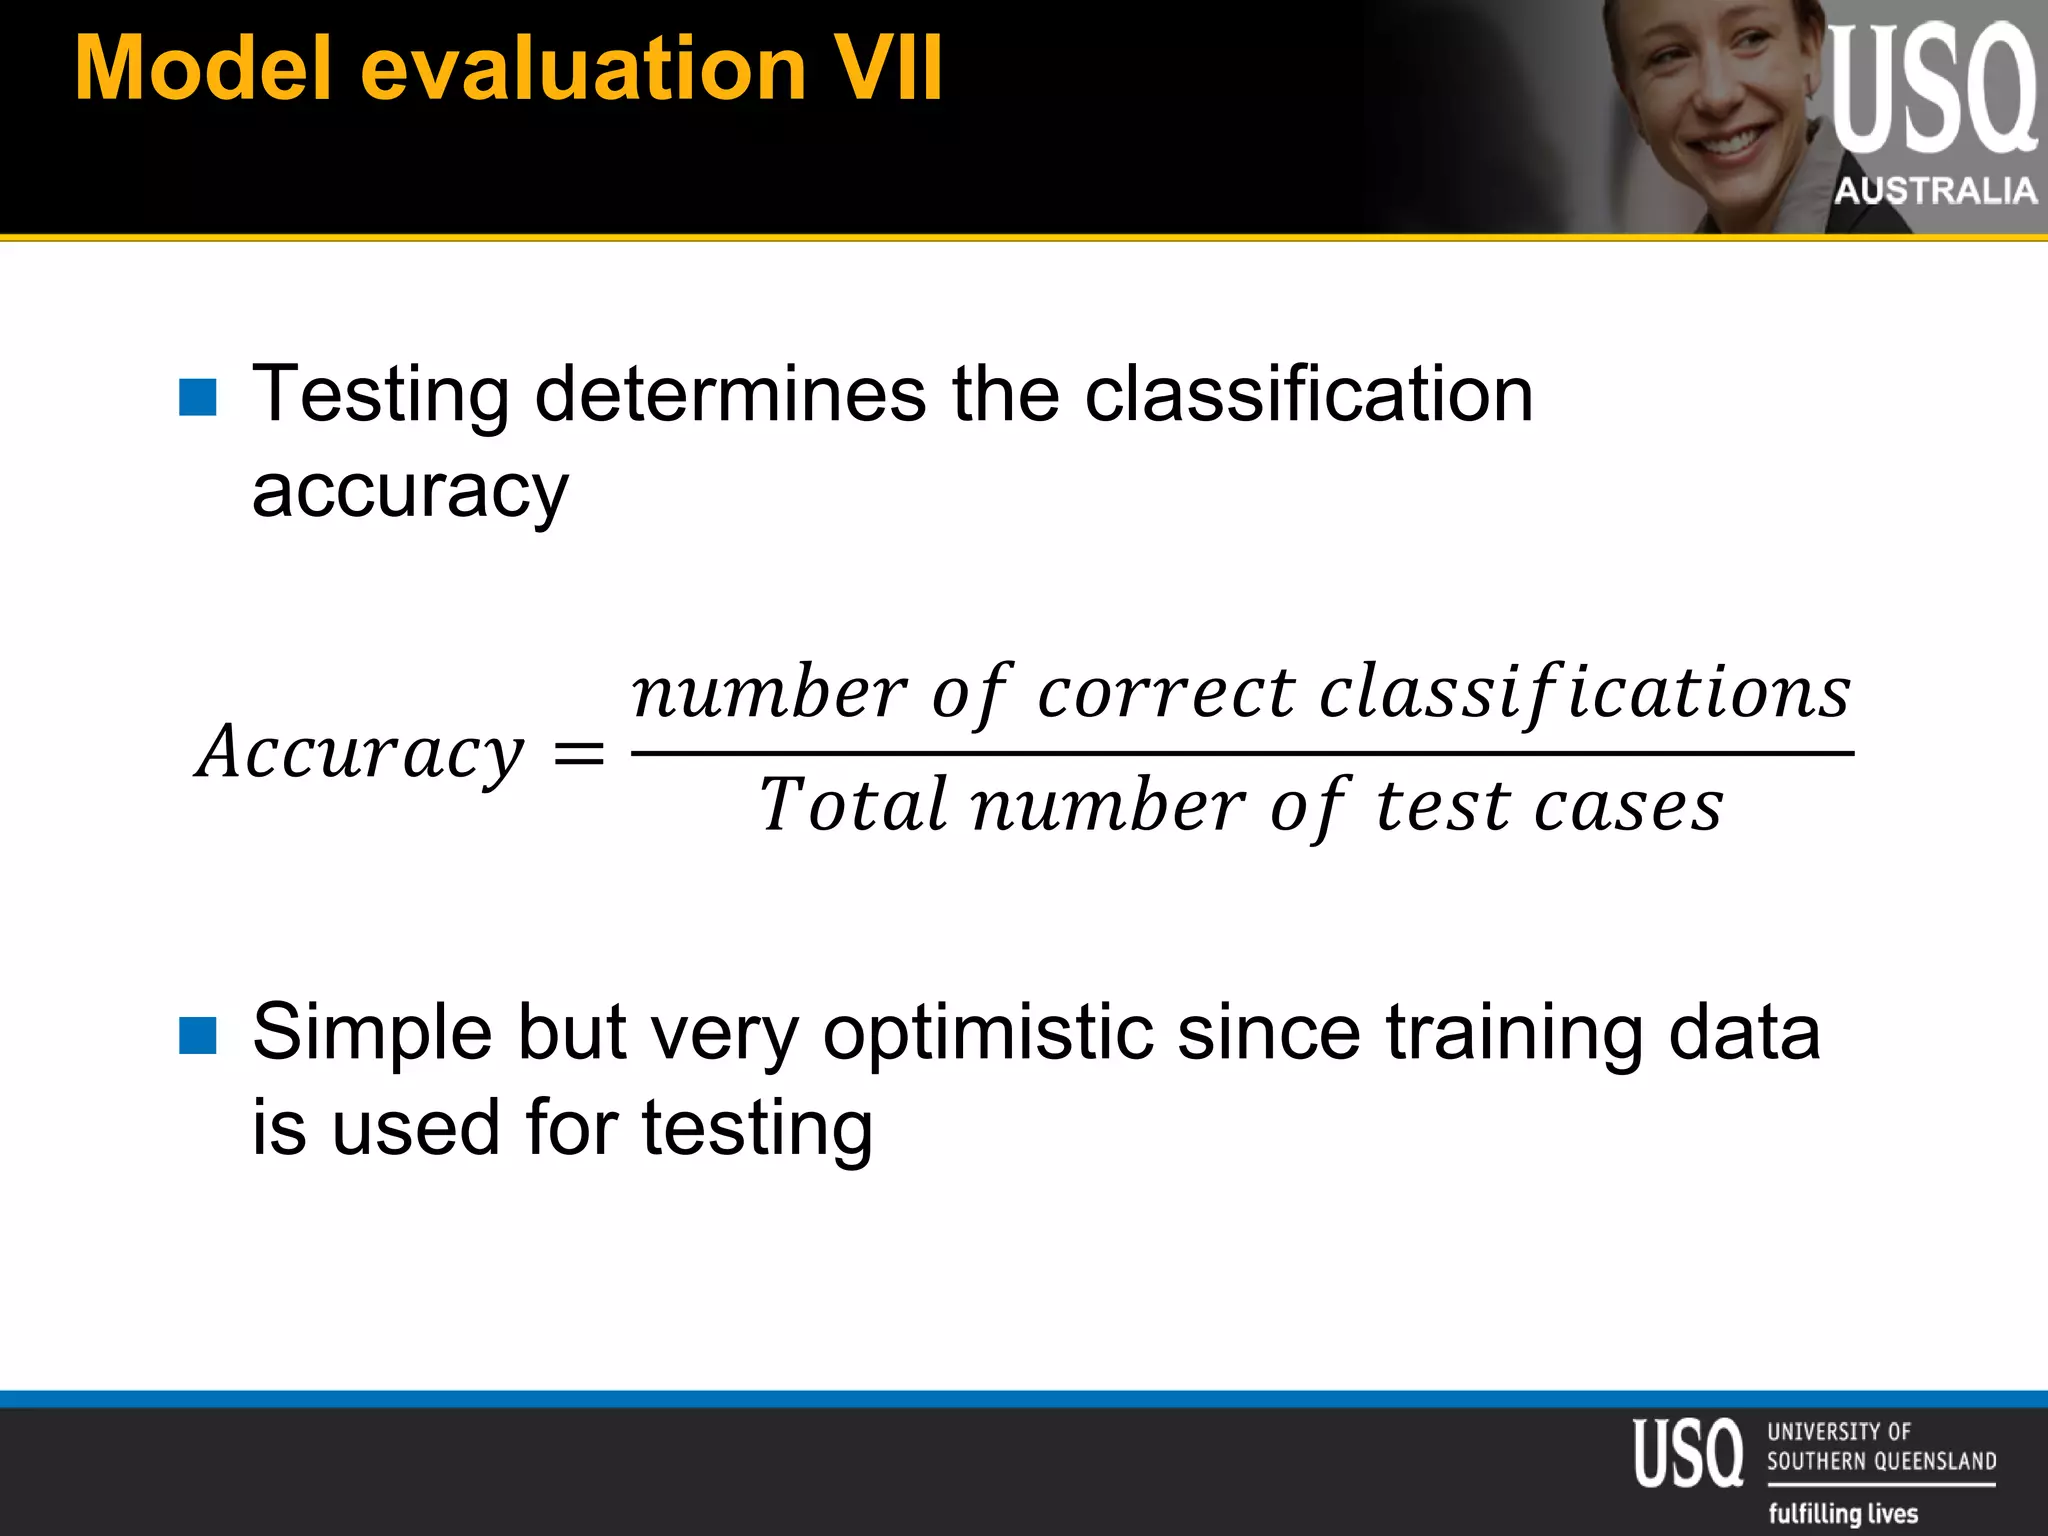
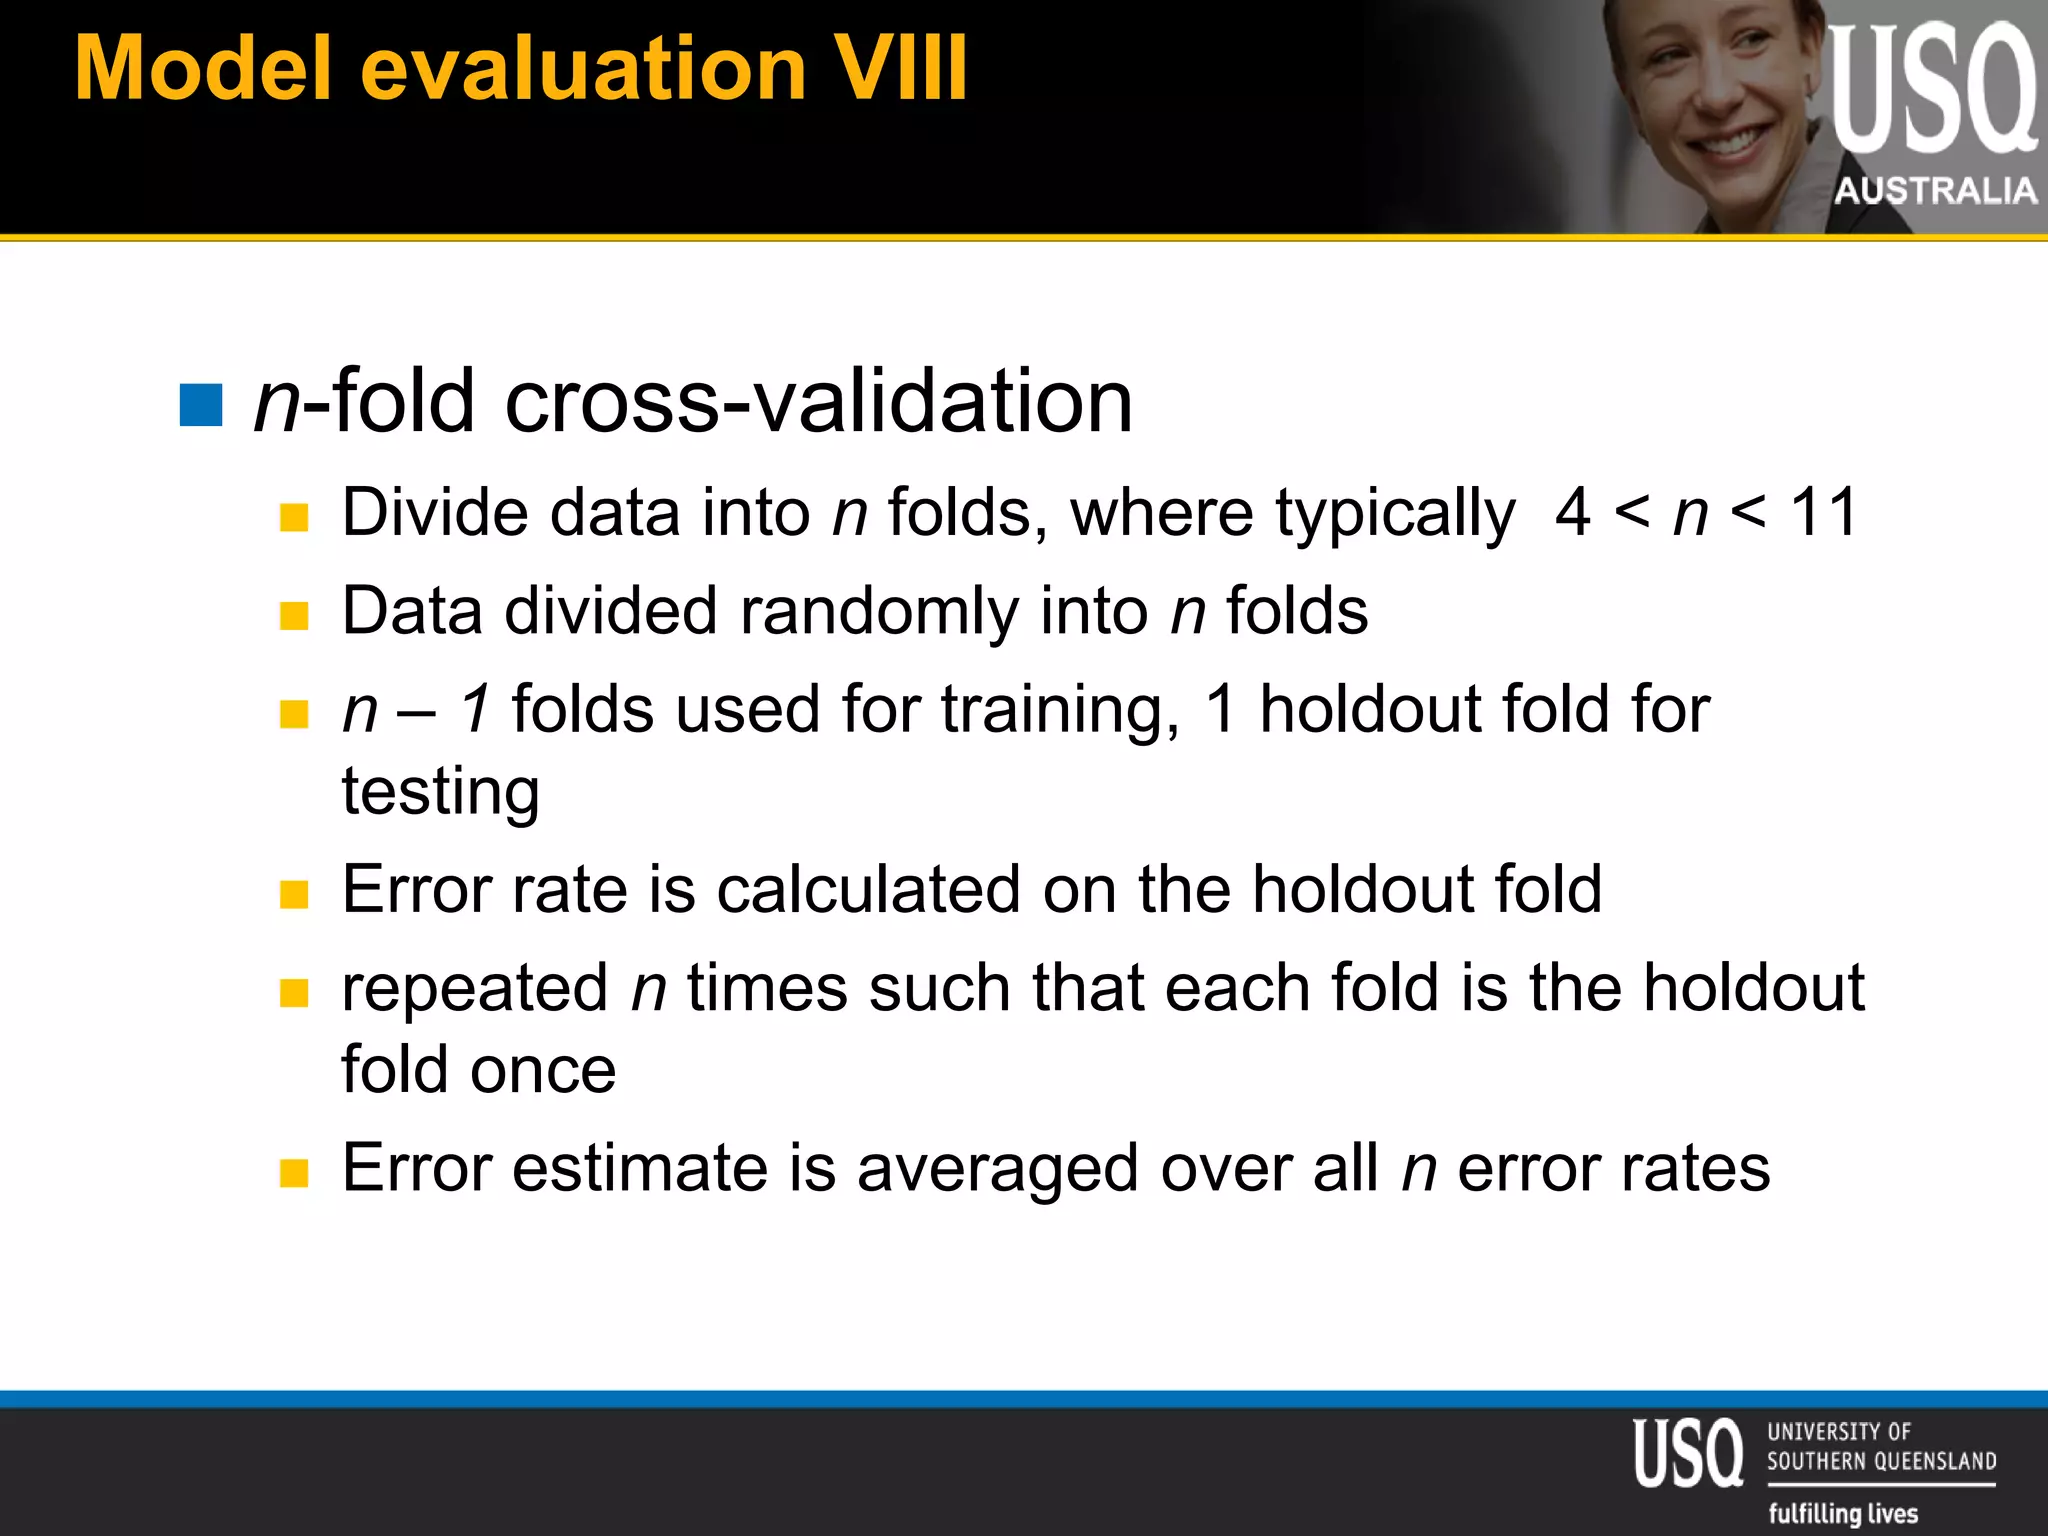
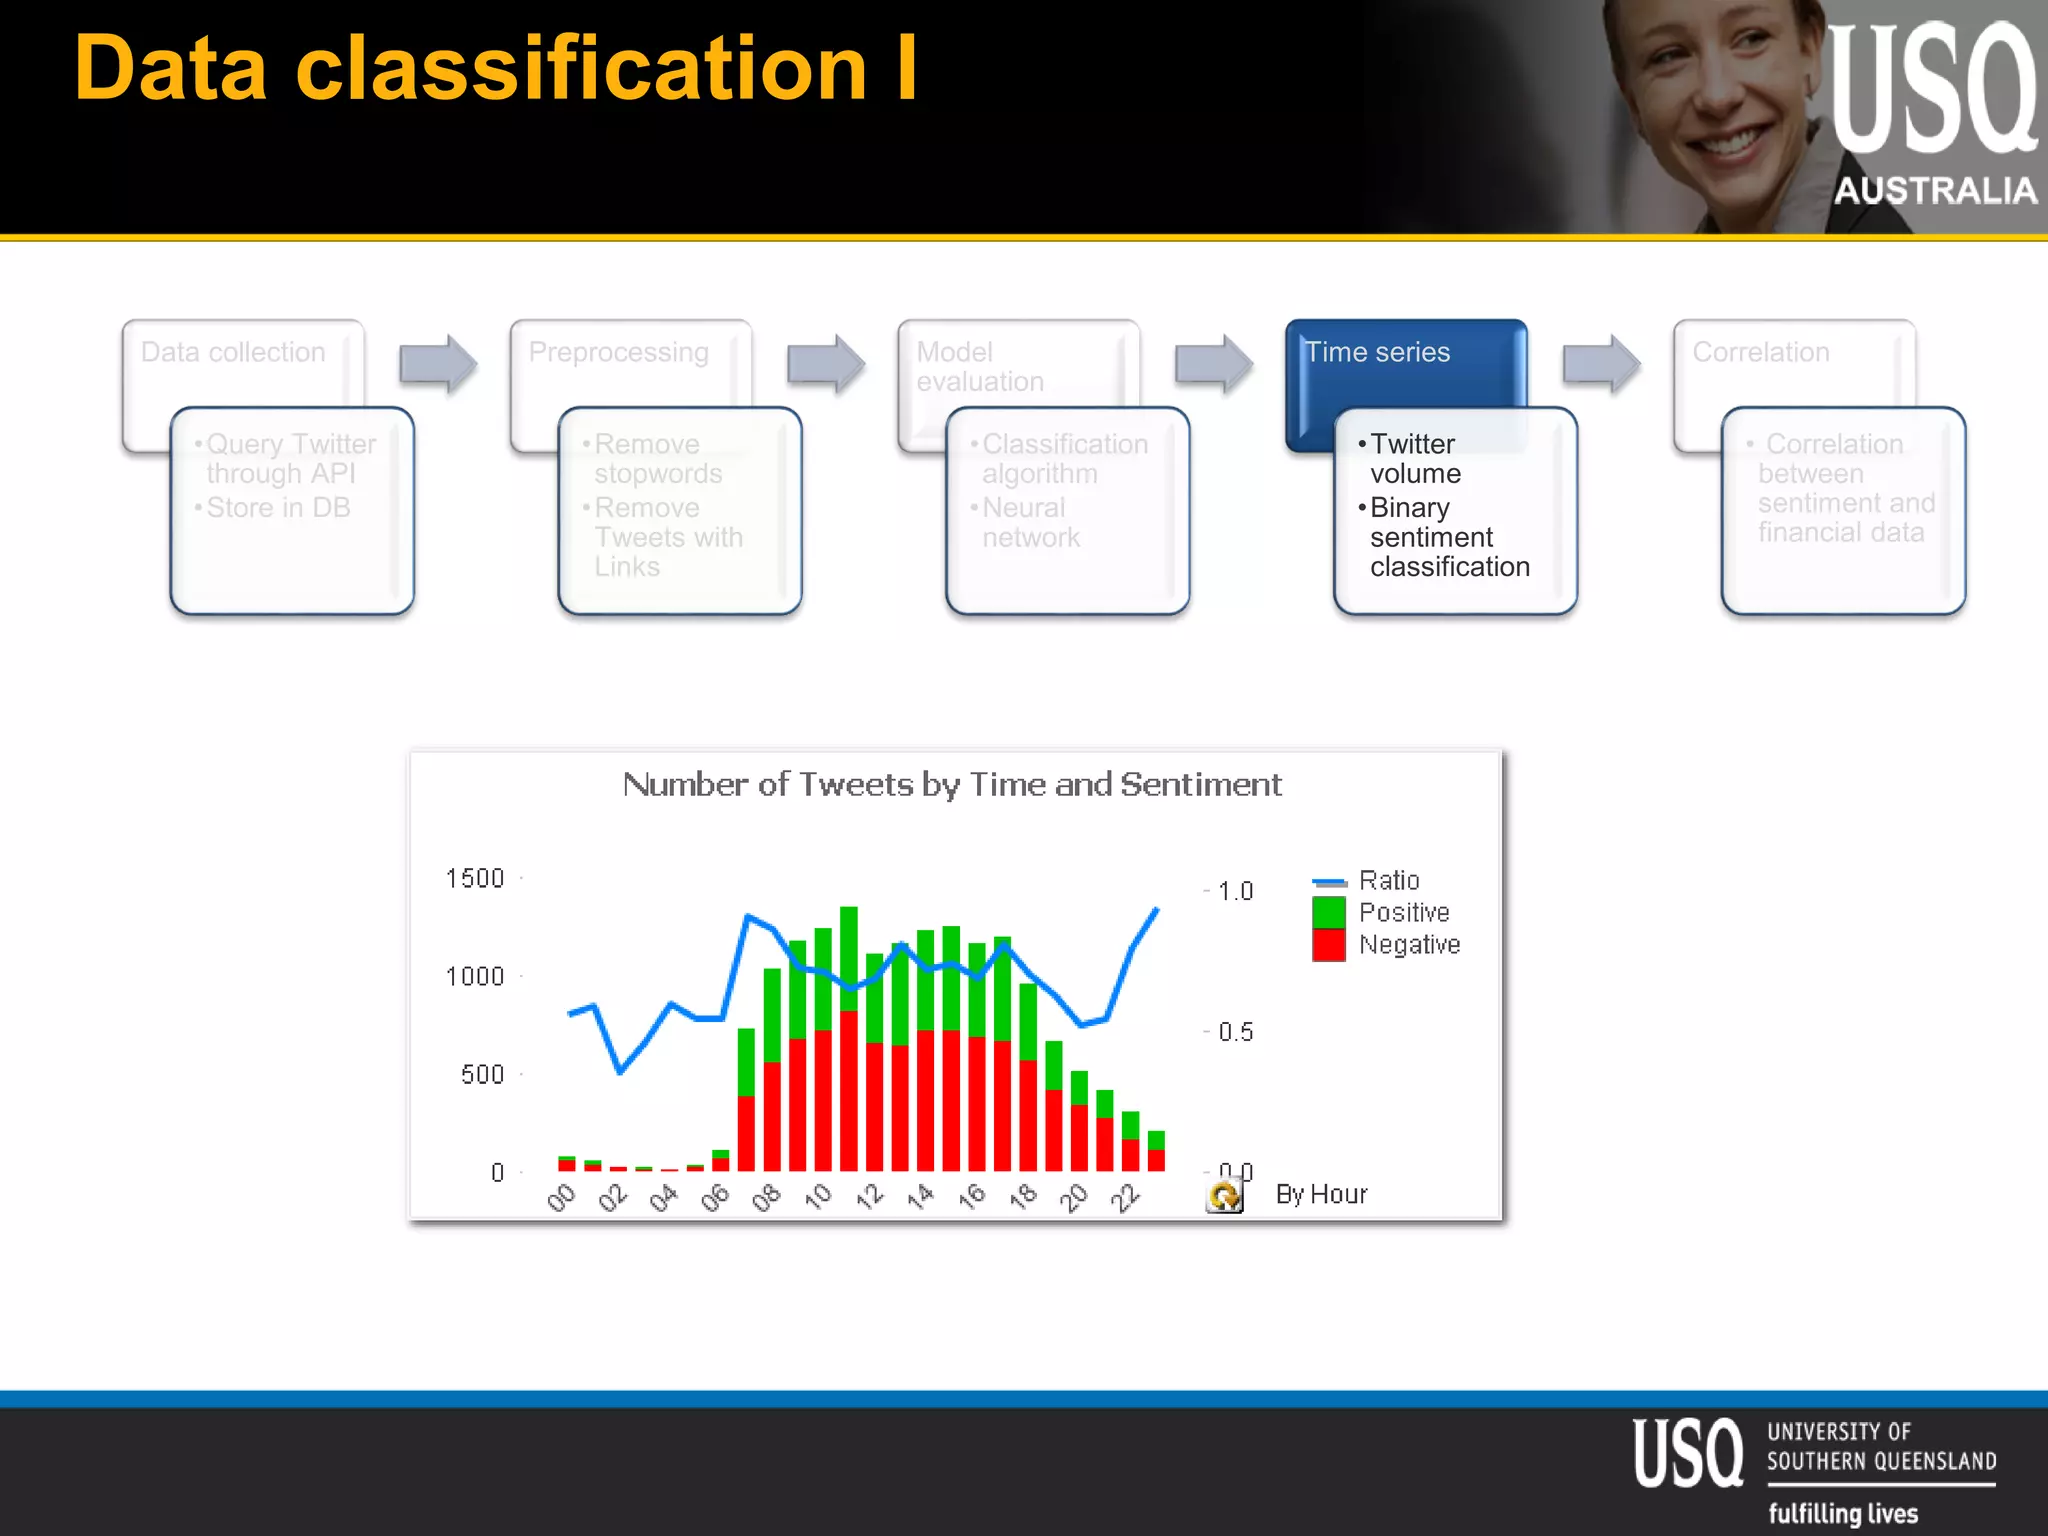
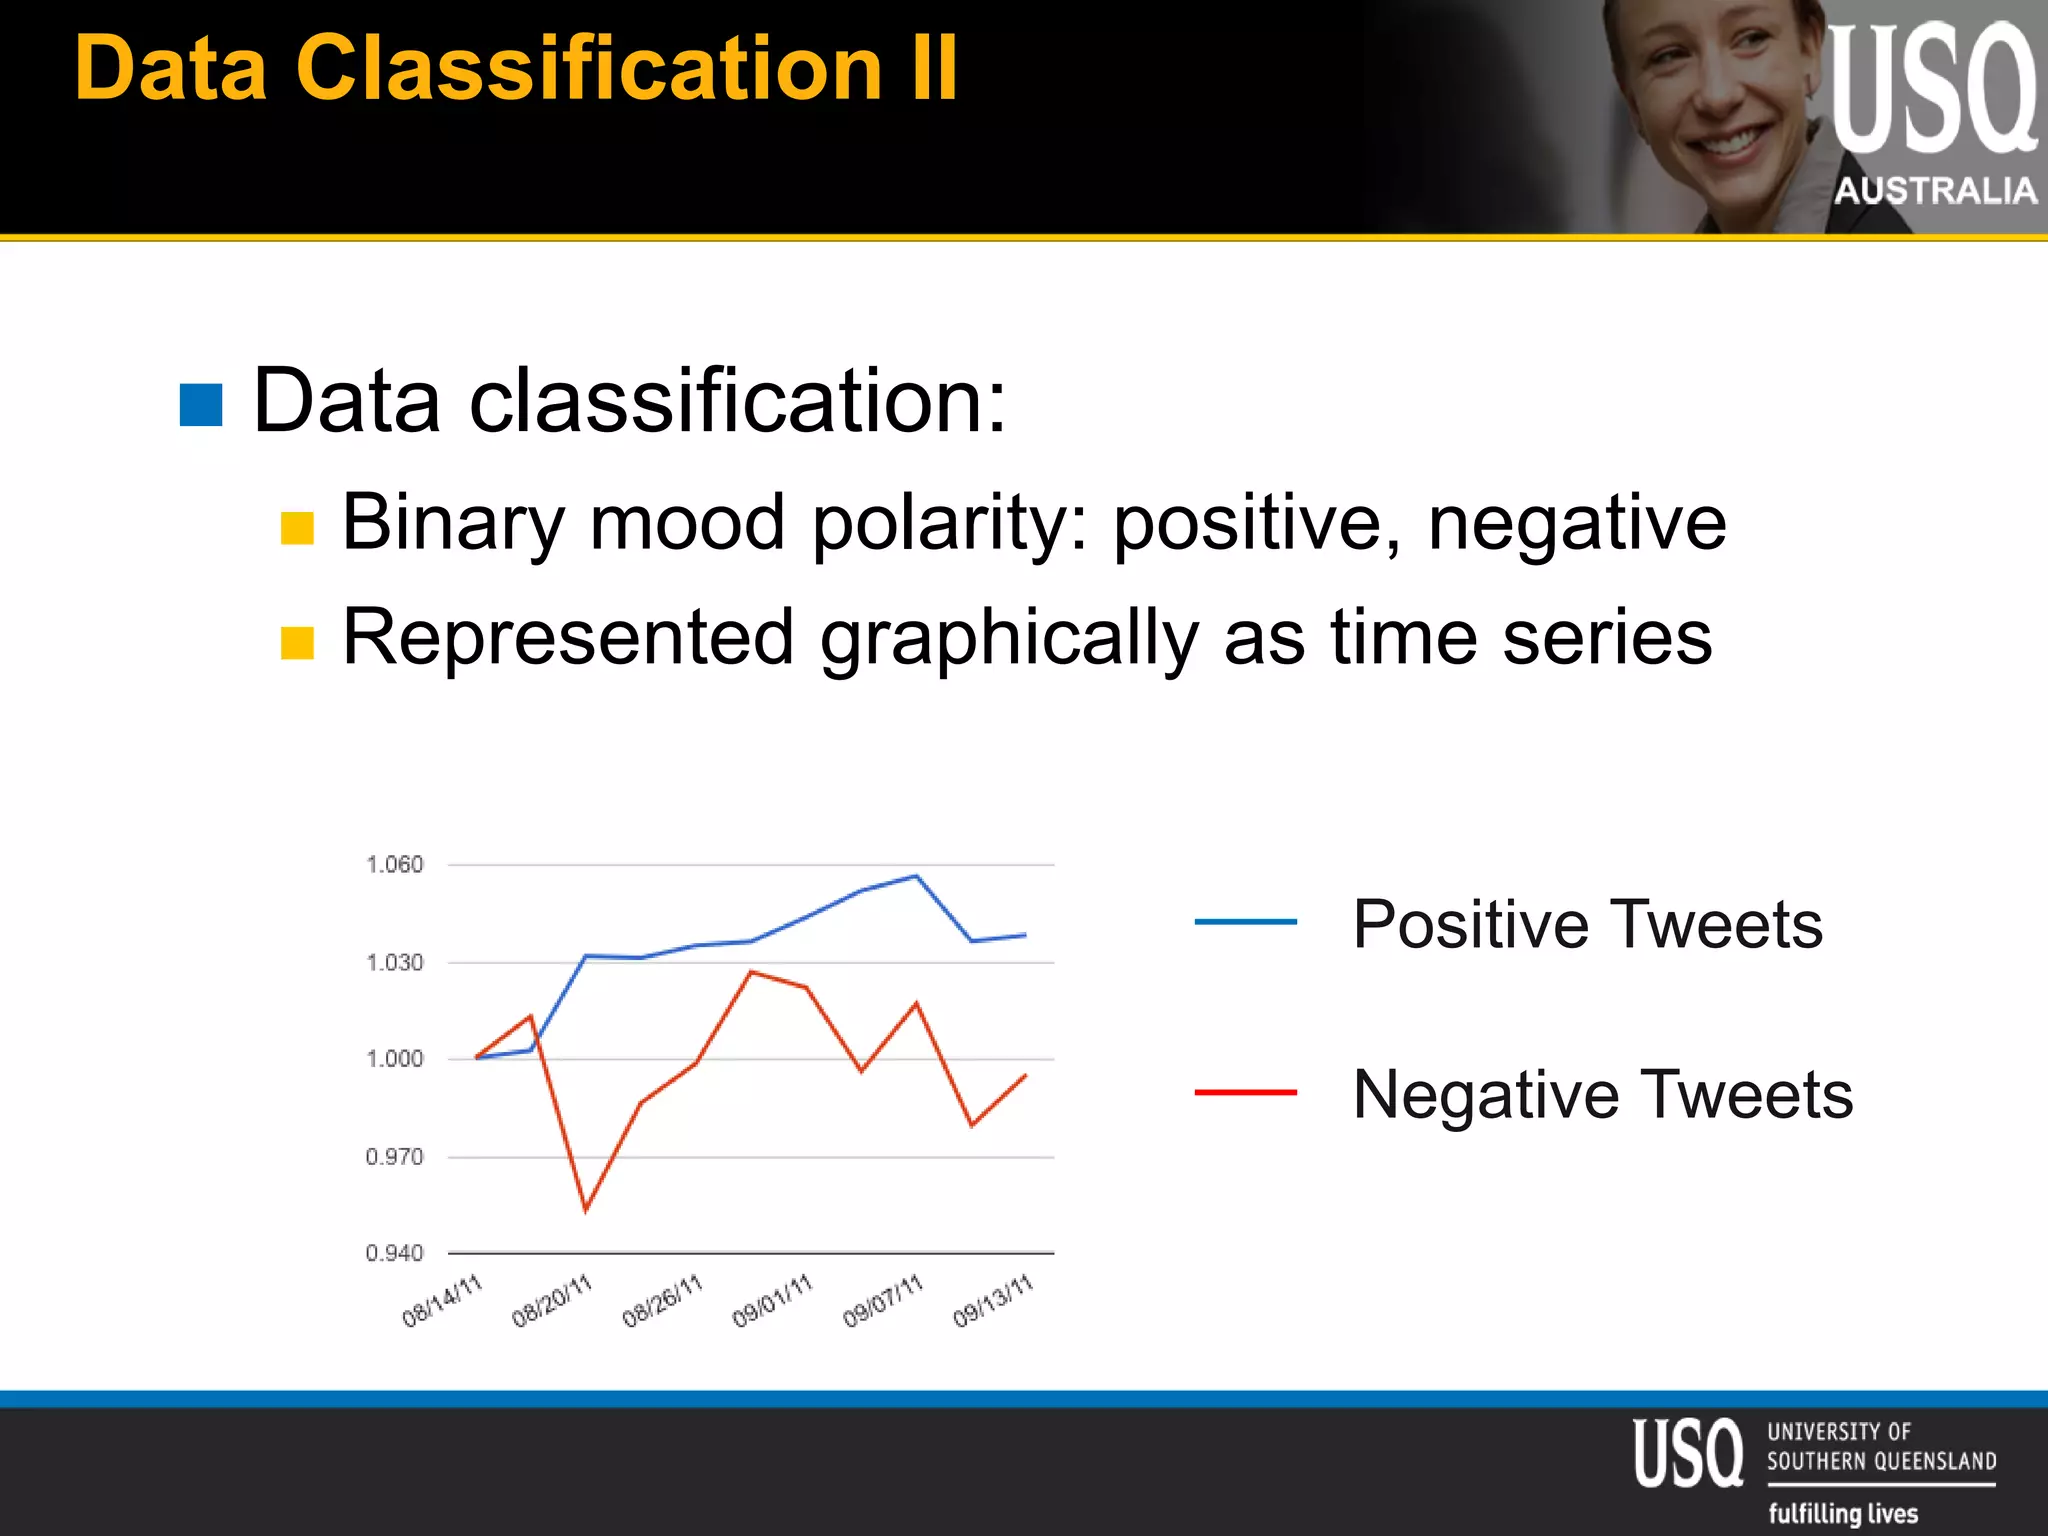
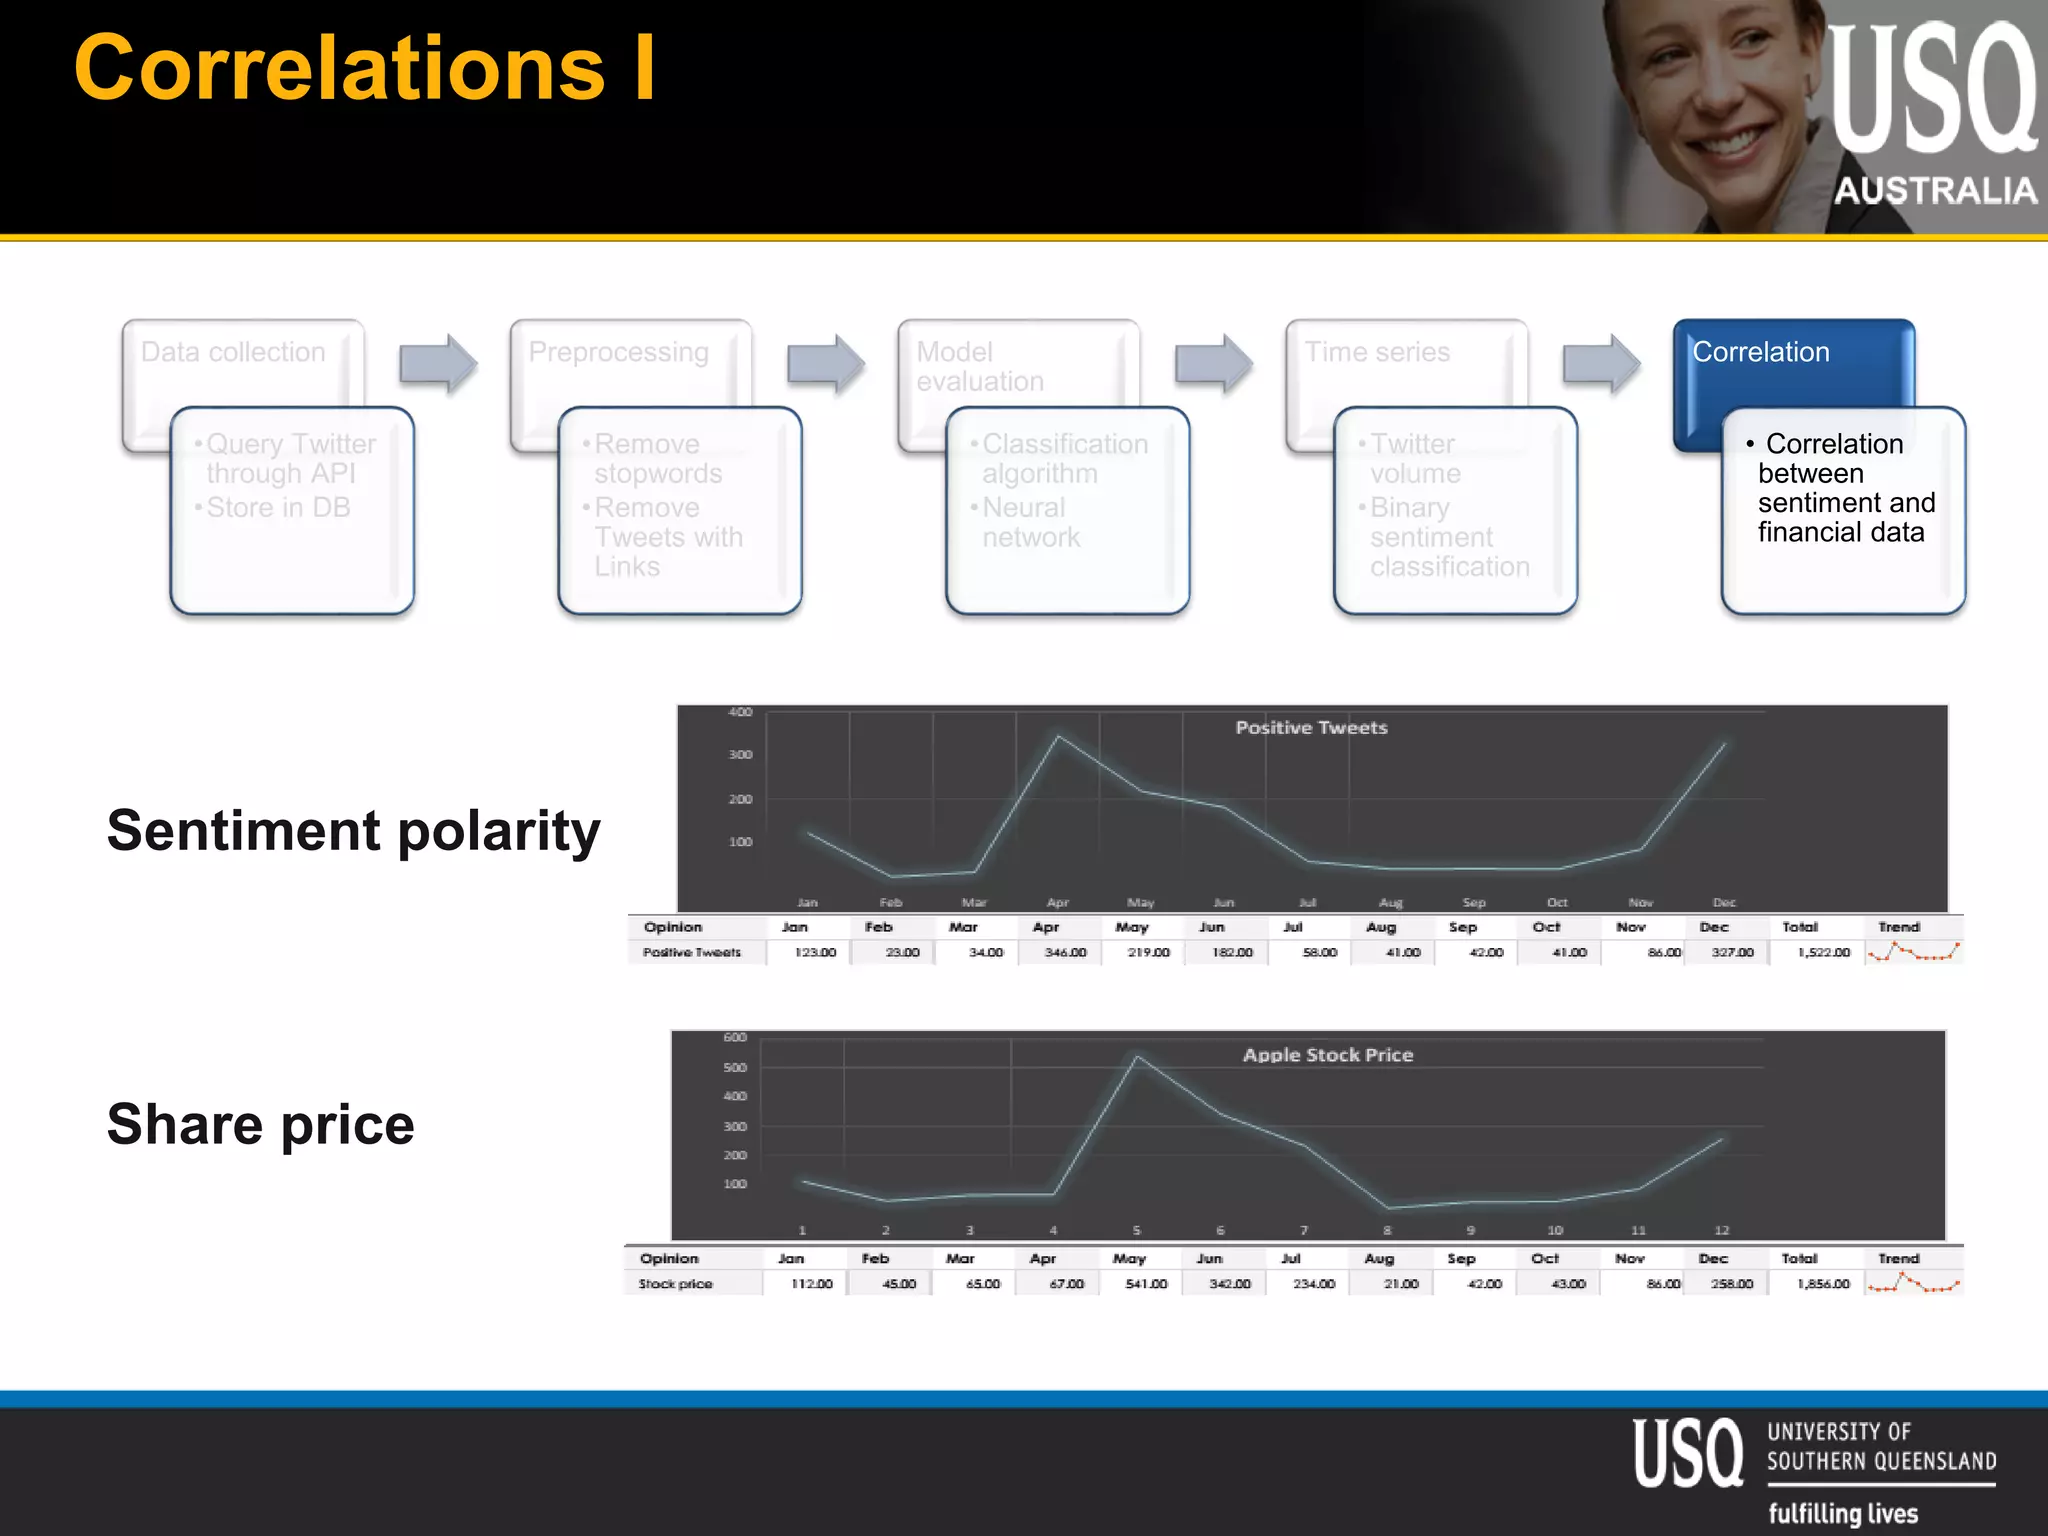

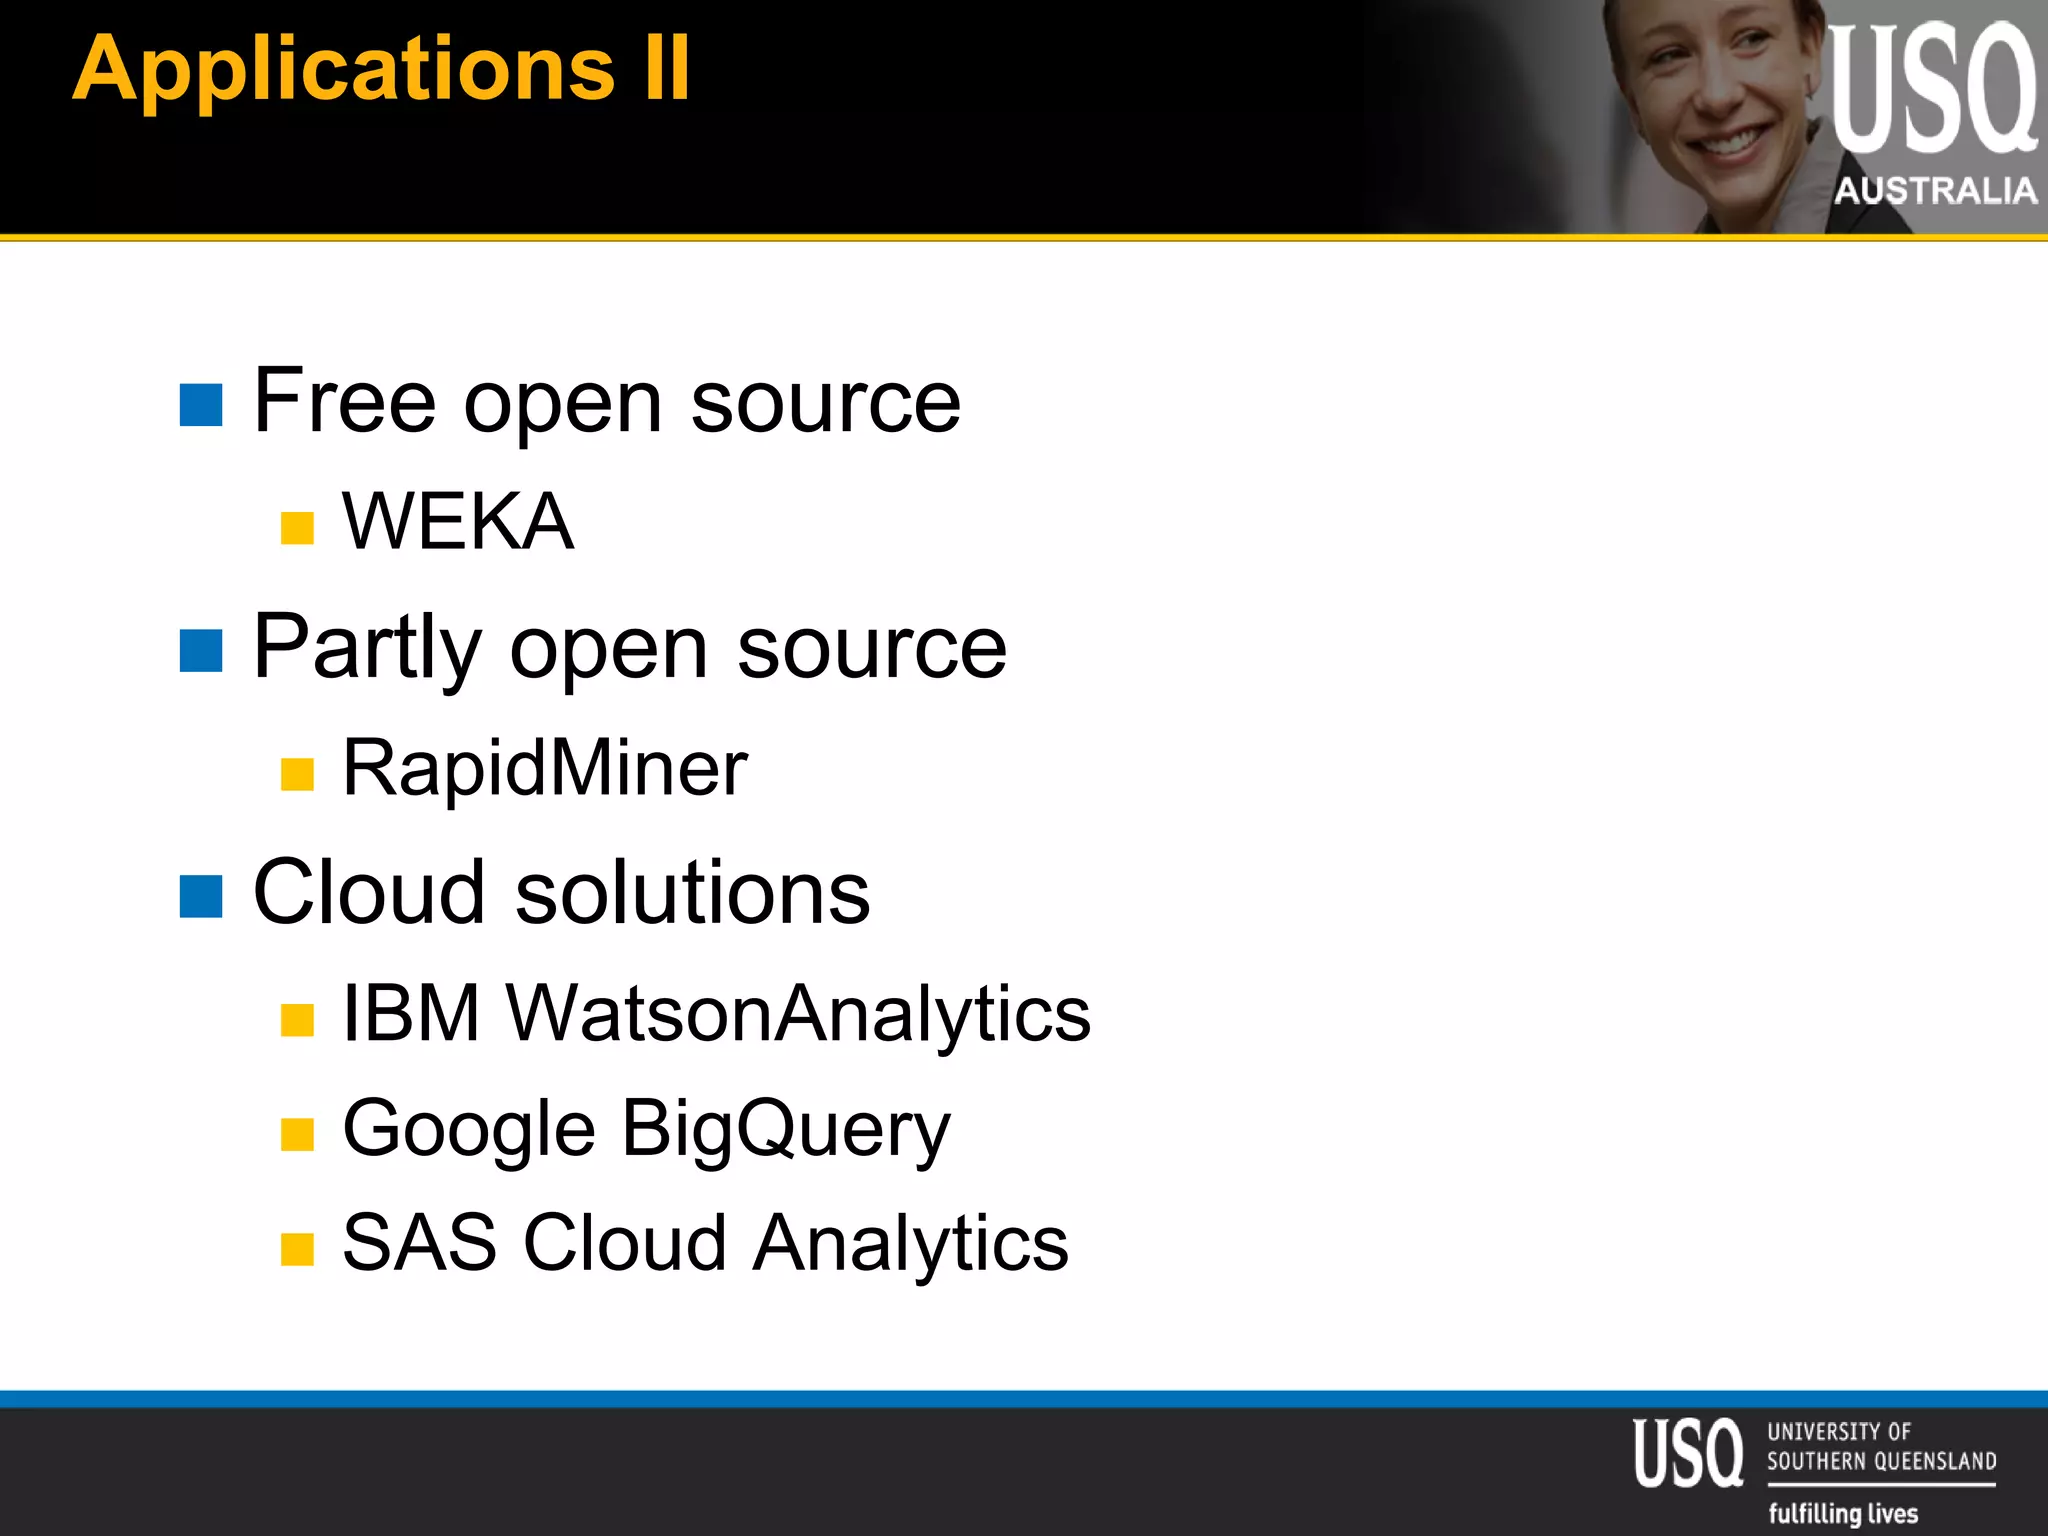
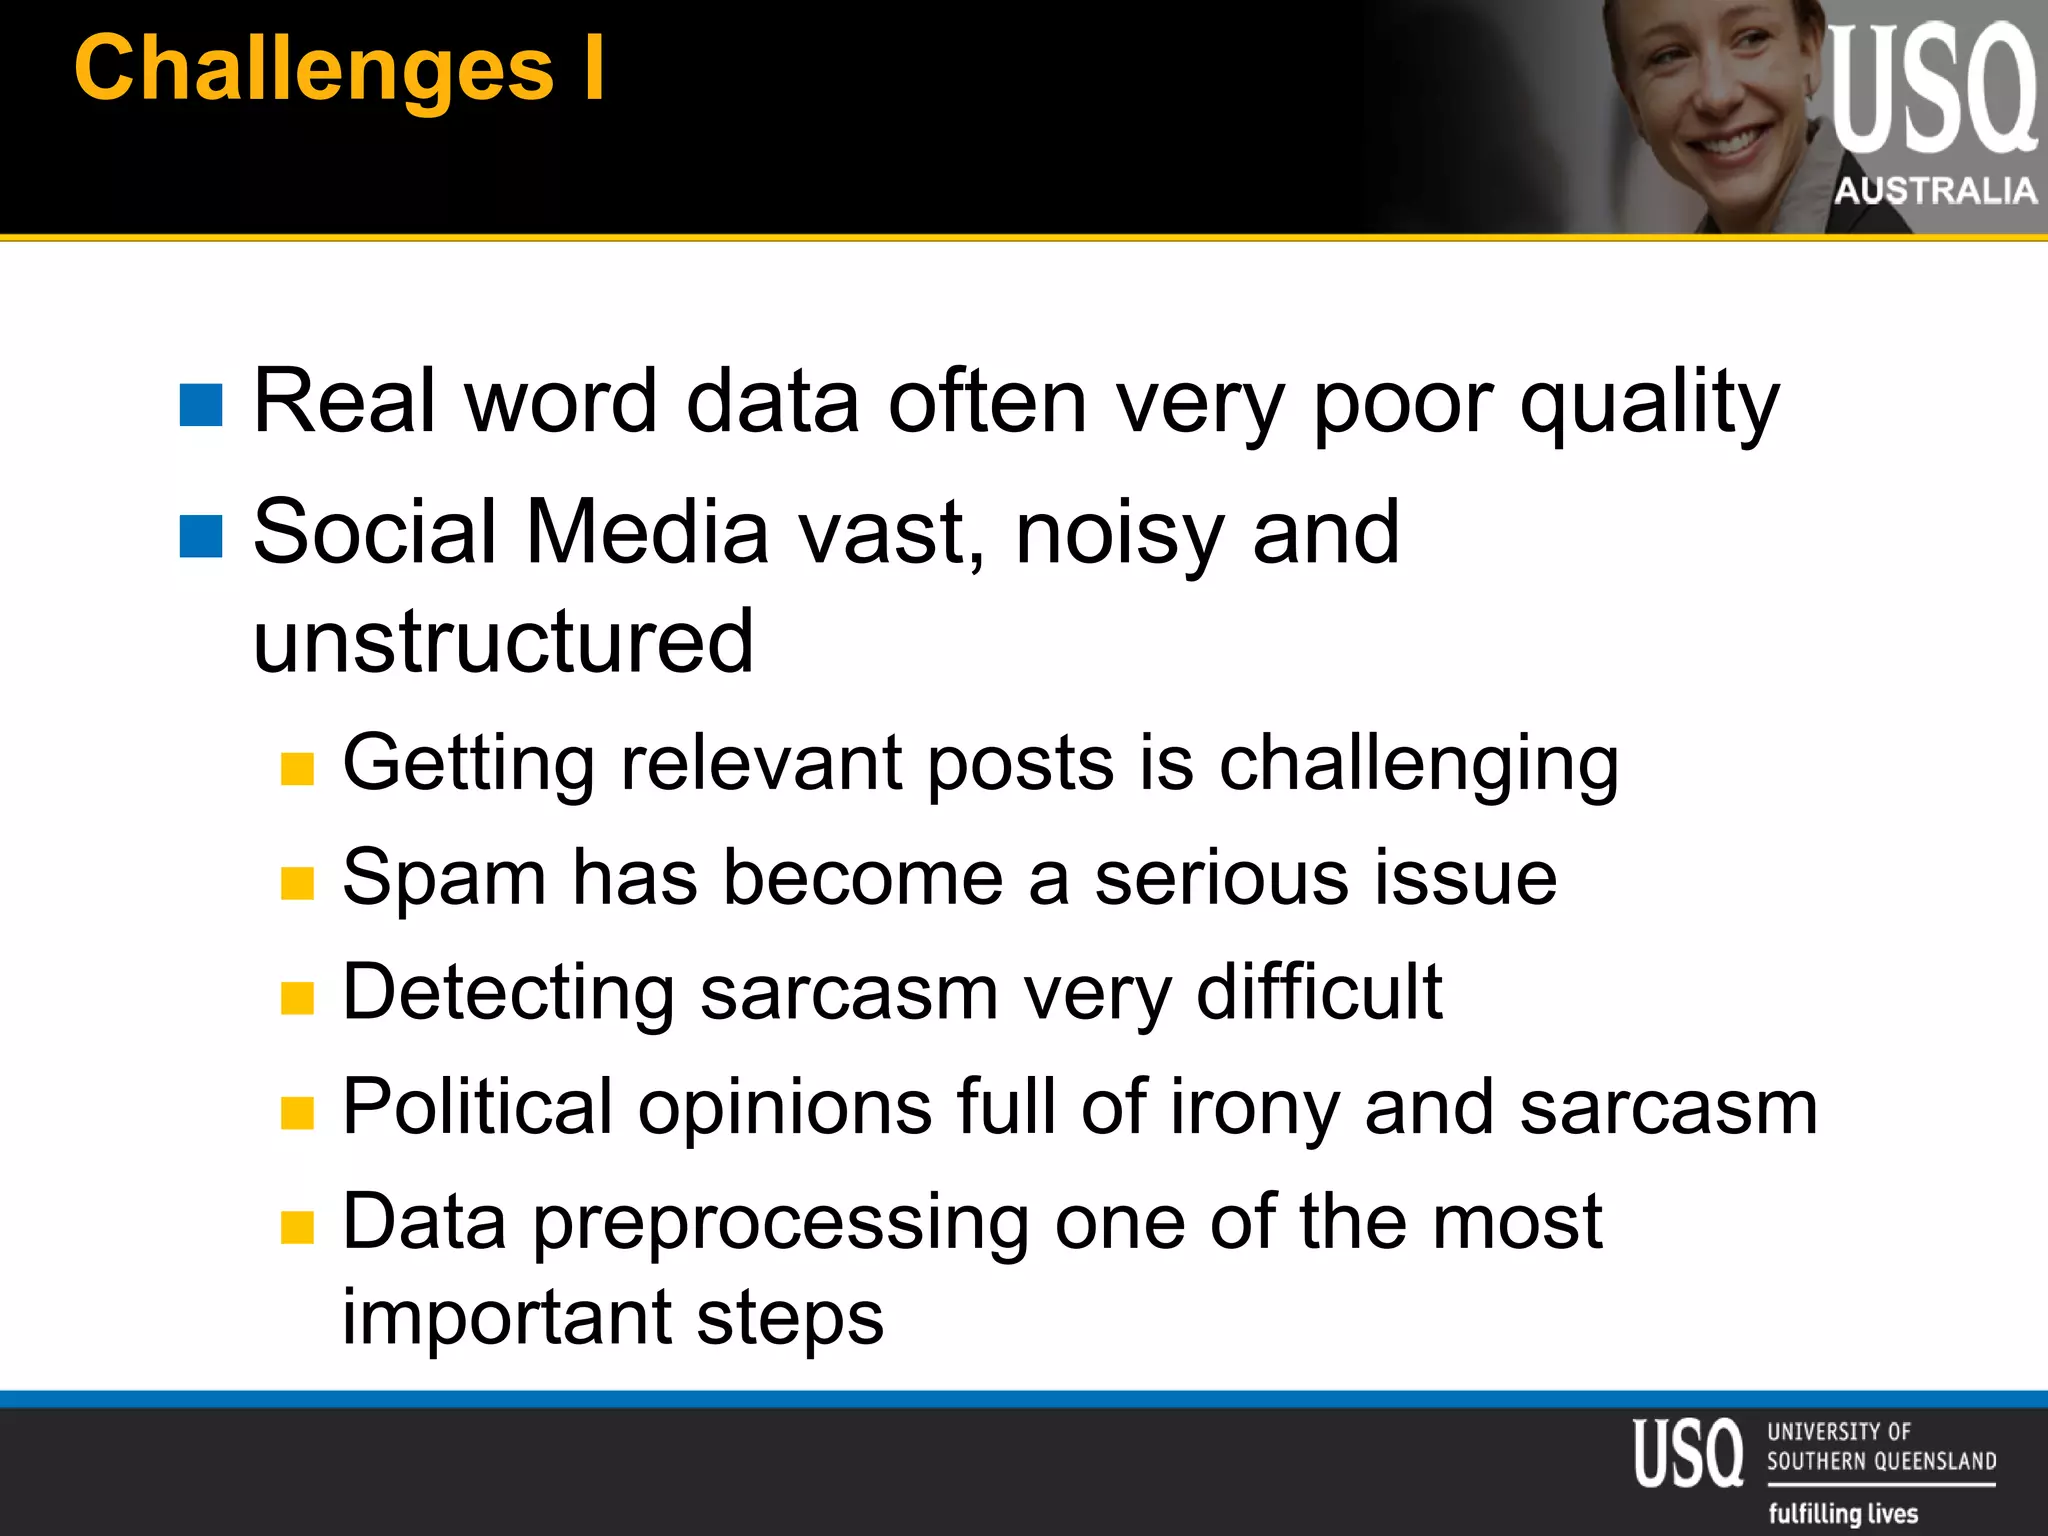
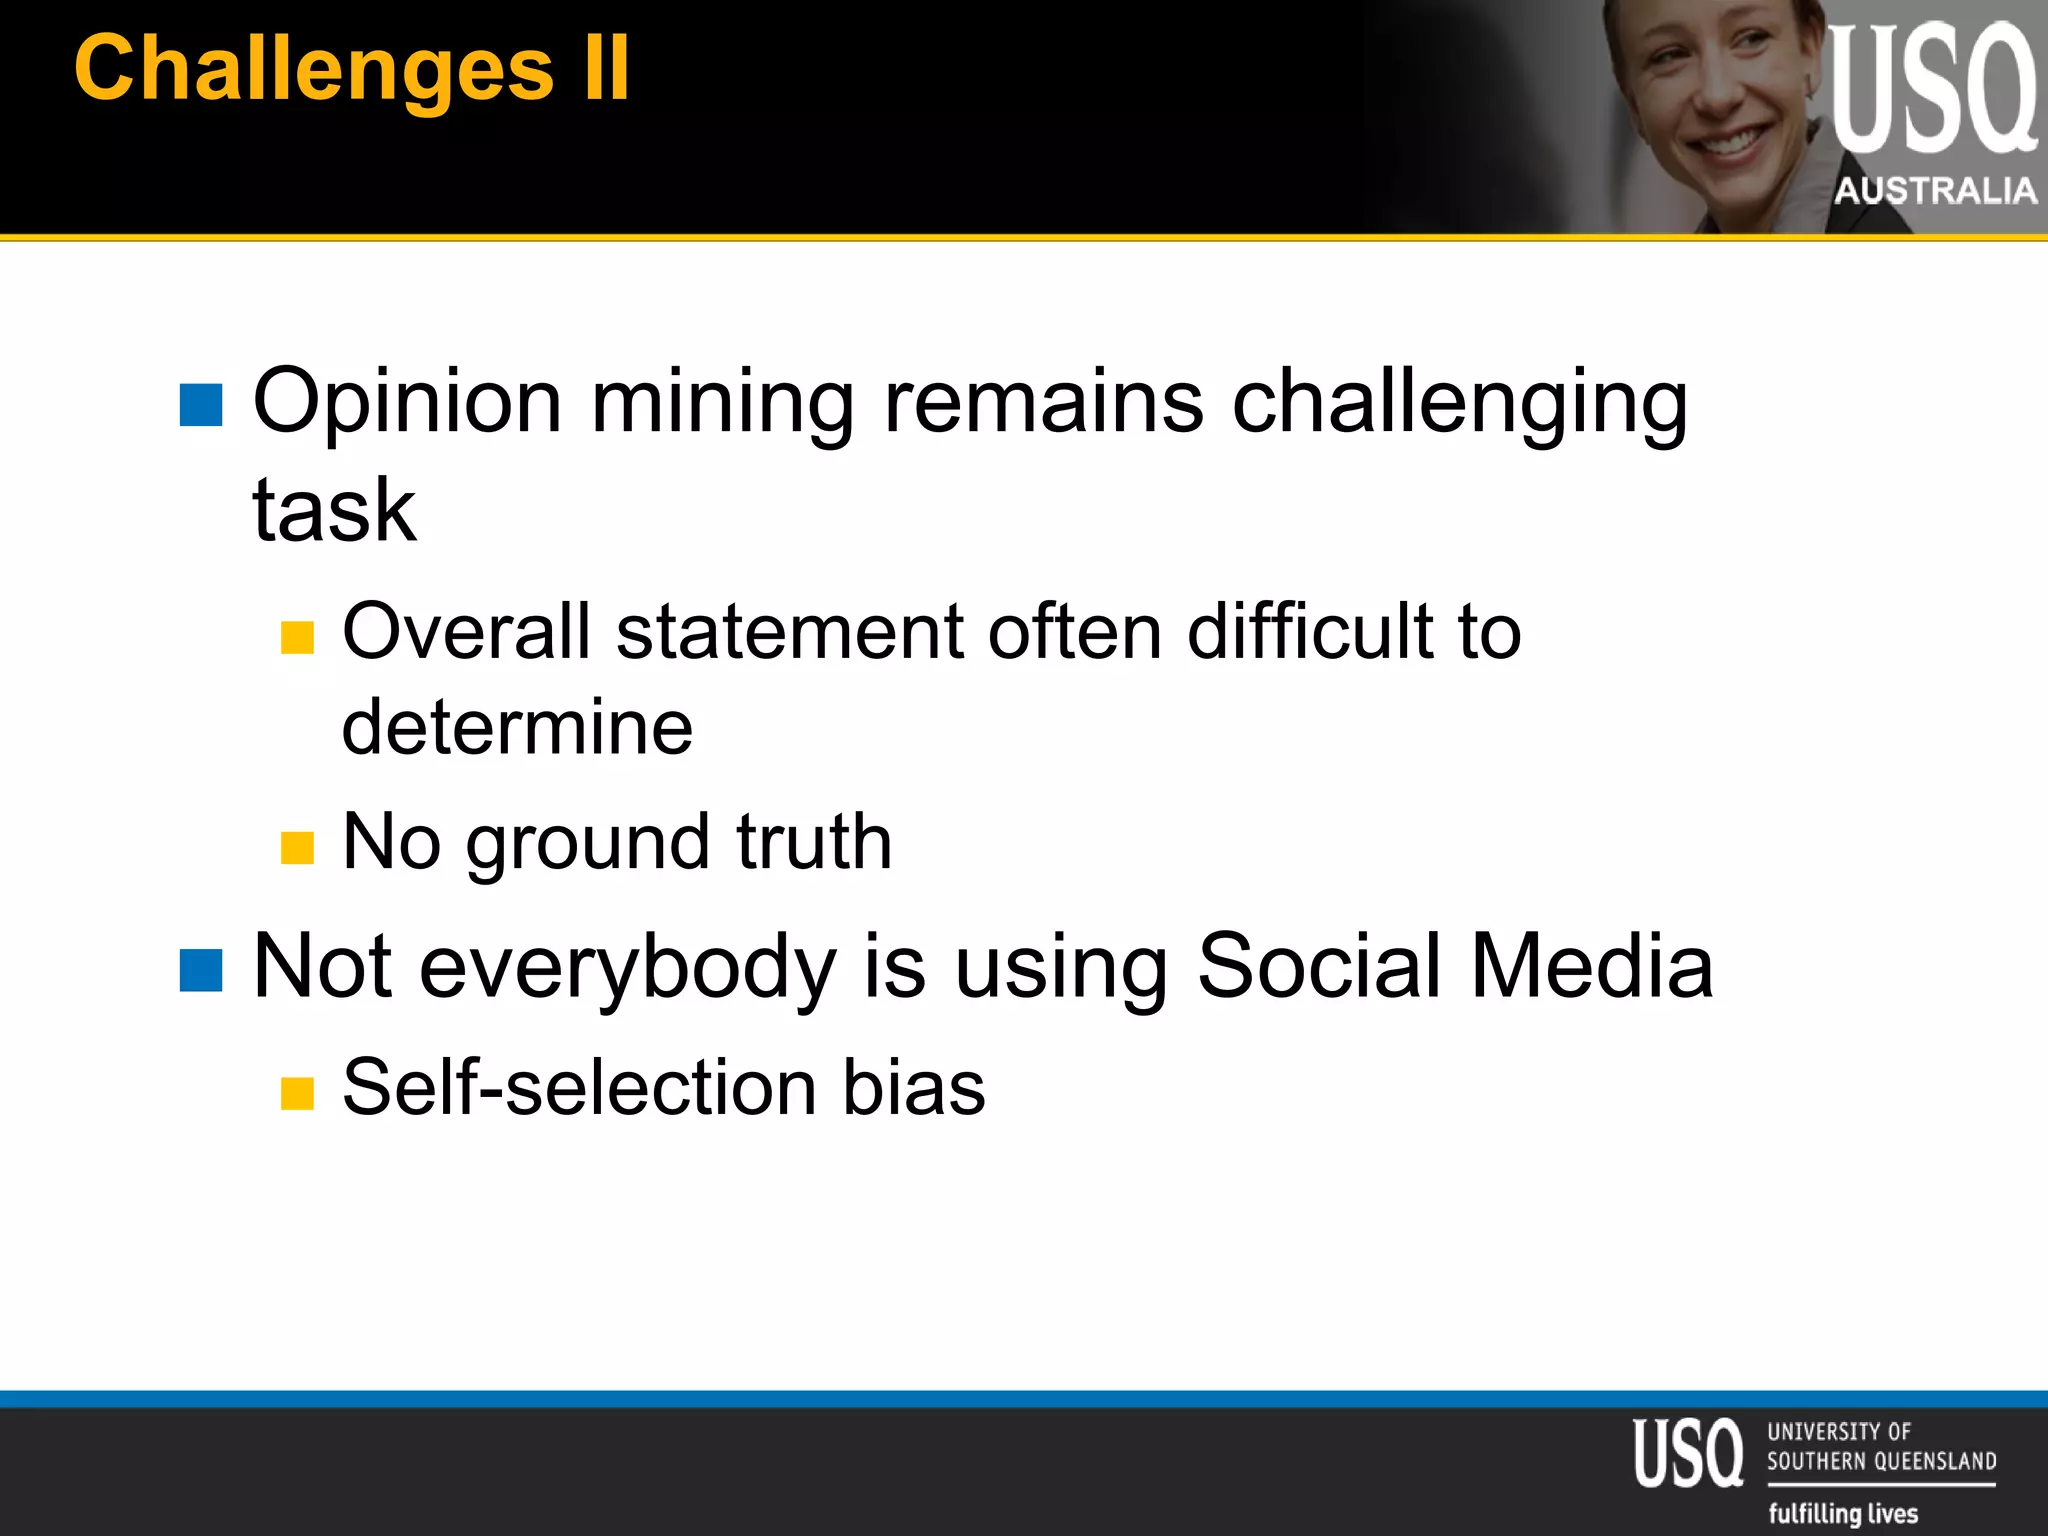
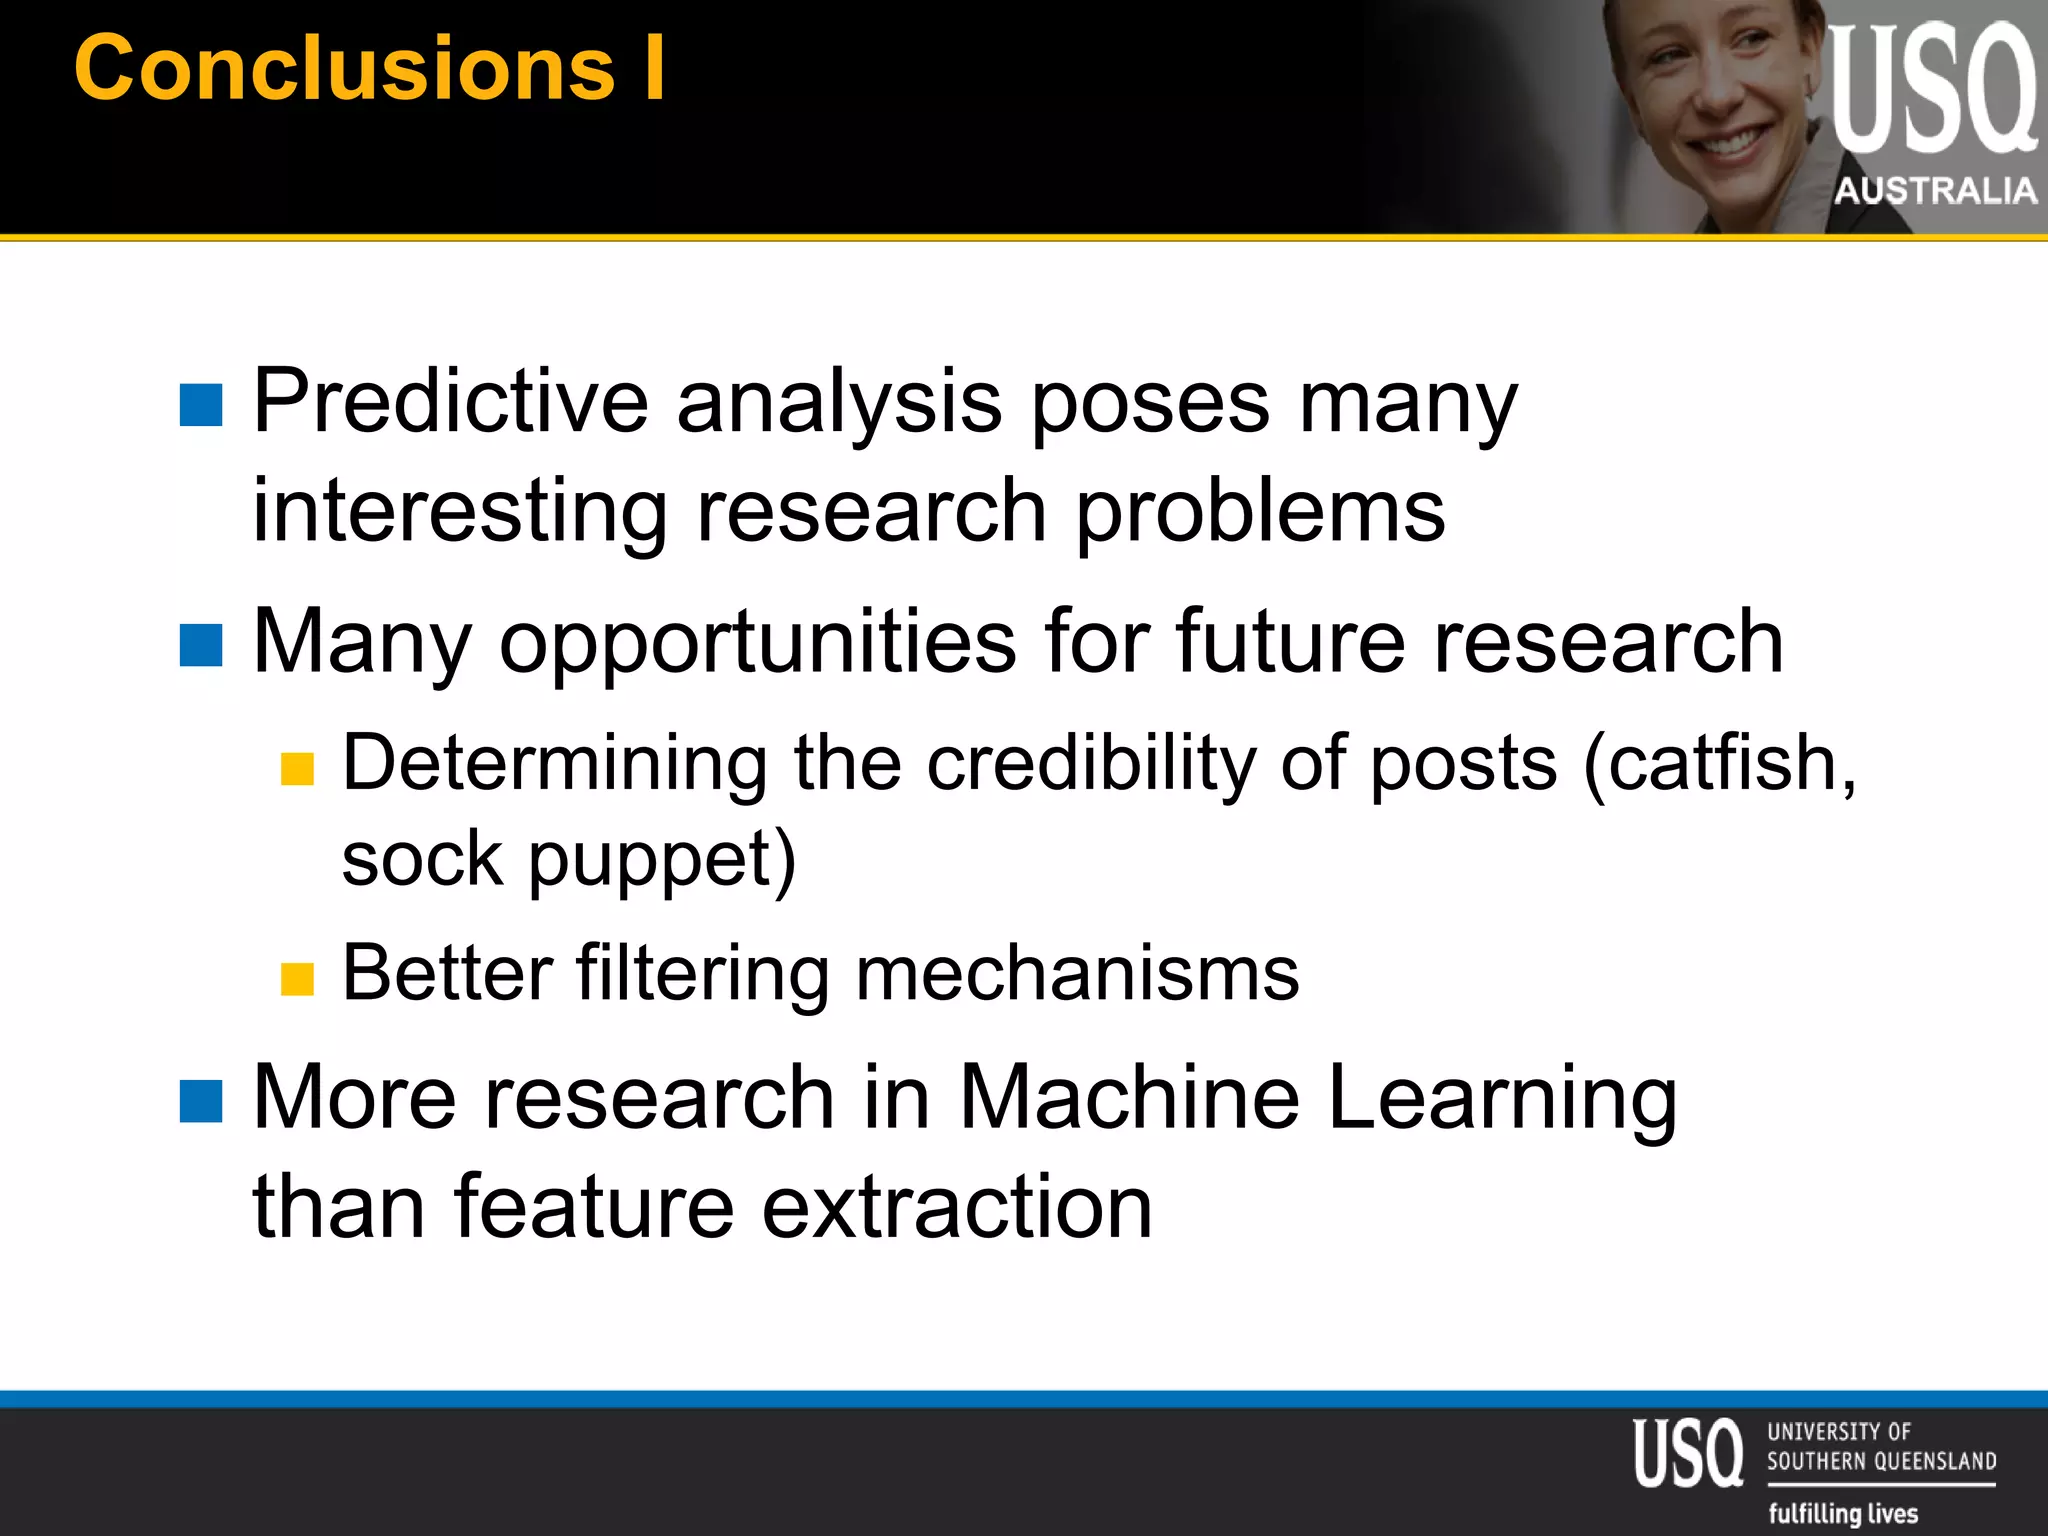

The document discusses the future of social media data analysis, particularly focusing on predictive analytics using Twitter data. It outlines the shift from publisher-generated to user-created content, highlights the challenges of data quality and analysis in social media, and emphasizes the use of machine learning techniques for prediction. Additionally, it details methodologies for data collection, preprocessing, and model evaluation, underscoring the growing significance of computational social science in extracting insights from large datasets.


![[DSC Europe 25] Jakub Stech - AI for Public Good: How Data and AI Can Transfo...](https://cdn.slidesharecdn.com/ss_thumbnails/ayuupcru6ggr9f7vbp0q-1-251215095918-7b7334a3-thumbnail.jpg?width=640&height=640&fit=bounds)
![[DSC Europe 25] Debmalya Biswas - Agentification: the art of transforming man...](https://cdn.slidesharecdn.com/ss_thumbnails/r5azlggvtqiaiiusrqdr-4-251212103249-5a12c89b-thumbnail.jpg?width=640&height=640&fit=bounds)
![[DSC Europe 25] Nikolay Burlutskiy - Best Practices for Building Enterprise M...](https://cdn.slidesharecdn.com/ss_thumbnails/uirvaiuvq8y1w8hzd9tx-7-251212103249-2619edb4-thumbnail.jpg?width=640&height=640&fit=bounds)


![[DSC Europe 25] Branko Urosevic -Rethinking Financial Talent: Integrating Cod...](https://cdn.slidesharecdn.com/ss_thumbnails/8jjrus8ttko6qj64f58f-3-251212103250-642c6374-thumbnail.jpg?width=640&height=640&fit=bounds)


![[DSC Europe 25] Djordje Hirs - Revolutionizing Telco Customer Experience with...](https://cdn.slidesharecdn.com/ss_thumbnails/zif75aur3qscnckv6tnc-djordje-hirs-cc-dsc2025-1-251219145617-679178aa-thumbnail.jpg?width=640&height=640&fit=bounds)


![[DSC Europe 25] Katherine Forrest - AI NOW: Understanding the Velocity of Cha...](https://cdn.slidesharecdn.com/ss_thumbnails/wvvbruqfrci0sfq9xwgb-4-251212104007-e5ad1987-thumbnail.jpg?width=640&height=640&fit=bounds)


