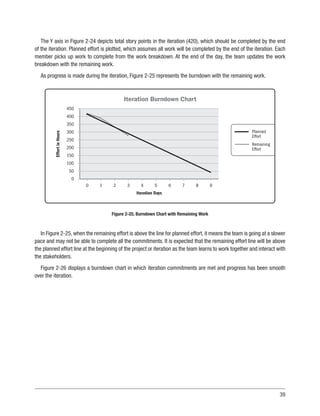
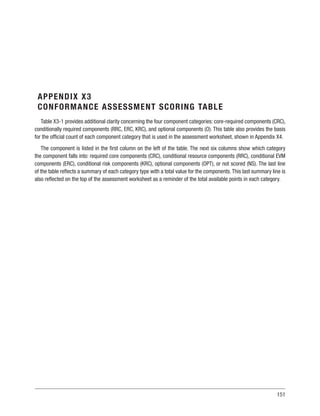
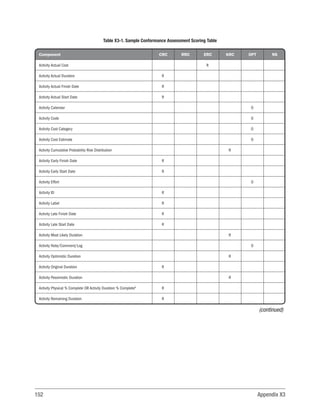
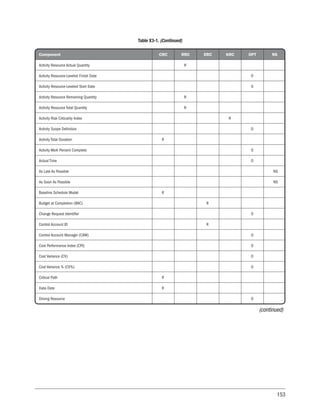
The document is the 'Practice Standard for Scheduling' published by the Project Management Institute, providing guidelines and frameworks for creating, managing, and maintaining project schedules. It includes principles and concepts for scheduling, good practices for schedule management, a catalog of scheduling components, and a conformance index for assessing schedule models. The standard aims to enhance project scheduling practices through comprehensive insights and established methodologies.


![2 Section 1
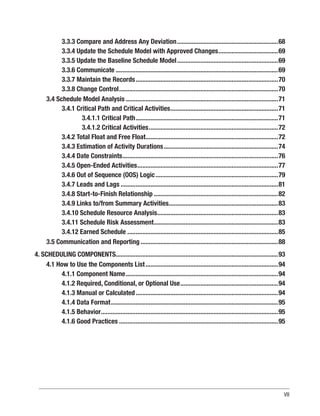
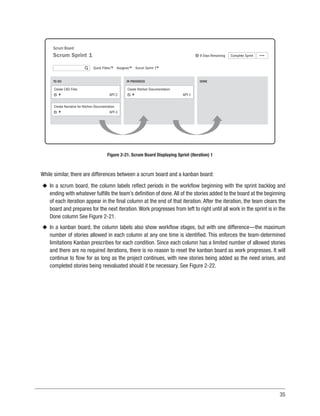
This practice standard includes adaptive approaches such as agile (see Sections 2.2.3 and 2.6). However, the
majority of the content of this practice standard, except where indicated, describes a traditional (i.e., predictive)
approach to scheduling using CPM. Additional information on agile may be found in the Agile Practice Guide [1].1
Section 1 provides an overview of the content of this practice standard and is divided as follows:
1.1 Project Scheduling
1.2 Why Scheduling?
1.3 Overview
1.4 Purpose
1.5 Applicability
1.1 PROJECT SCHEDULING
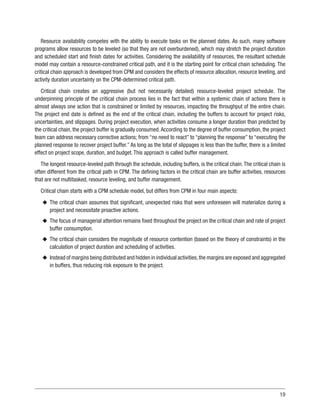
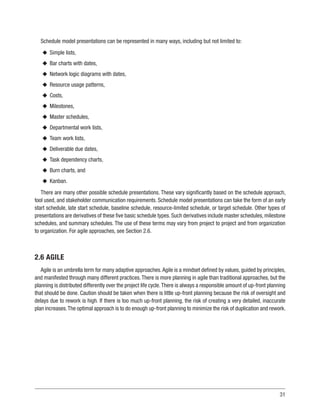
Project scheduling ensures the development of effective schedule models through the application of skills, tools,
techniques, and intuition acquired through knowledge, formal and informal training, and experience.A schedule model
rationally organizes and integrates various project components (e.g., activities, resources, and logical relationships) to
optimize the information available to the project management team and facilitate the likelihood of a successful project
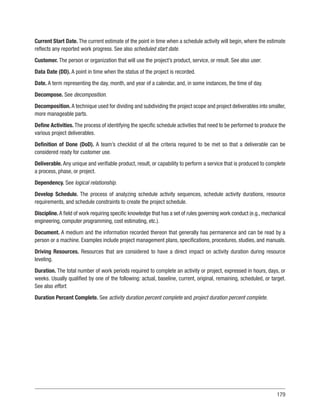
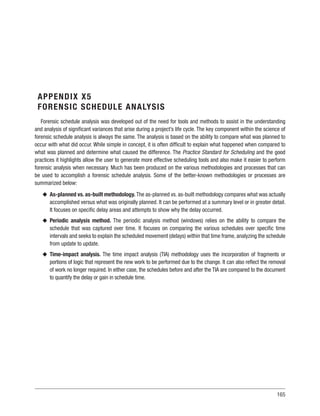
completion within the approved schedule baseline. Key schedule model terms are defined as follows:
u
u Milestone. The PMI Lexicon of Project Management Terms [2] defines a milestone as: A significant point or
event in a portfolio, program, or project. For the purposes of this standard, a milestone is a significant point or
event in a project defined with a duration of zero time periods.
u
u Activity. The Lexicon [2] defines an activity as: A distinct, scheduled portion of work performed during the
course of a project. For the purposes of this standard, an activity is a unique and distinct scheduled portion of
work with a duration greater than zero time periods, to be performed during the course of a project.
u
u Resource. A skilled human resource (specific disciplines either individually or in crews or teams), equipment,
services, supplies, commodities, materials, budgets, or funds required to accomplish the defined work.
u
u Logical relationship. A dependency between two activities or between an activity and a milestone.
1
The numbers in bracket refer to the list of references at the end of this practice standard.](https://image.slidesharecdn.com/practicestandard-scheduling-3th28201929-240925192702-904621c1/85/Practice-Standard-Scheduling-3th-282019-29-pdf-17-320.jpg)
![5
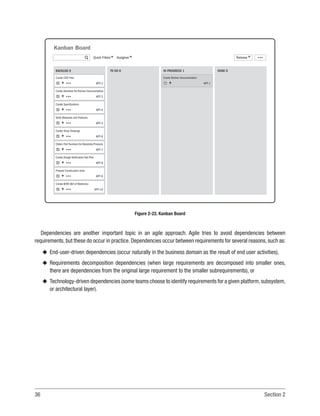
1.3 OVERVIEW
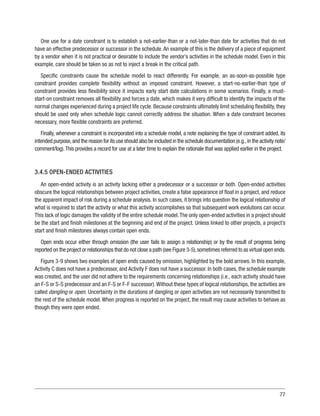
This practice standard describes schedule model components (see Section 4) and generally recognized good
practices for scheduling processes. Generally recognized means that the knowledge and practices described are
applicable to most projects most of the time. Additionally, there is consensus about the value and usefulness of
knowledge and practices. Good practice means that there is general agreement that the application of these skills,
tools, and techniques can enhance the probability of success over a wide range of projects. Good practice does not
mean the knowledge described should always be applied uniformly to all projects—it means the project team is
responsible for determining what is appropriate for any given project. The proper use of the components and their
practices results in a schedule model usable for planning, executing, monitoring, and closing, in addition to the
delivery of the project scope to stakeholders. Although additional schedule approaches and life cycles are included,
this practice standard describes a traditional (i.e., predictive) approach to scheduling using the CPM approach.
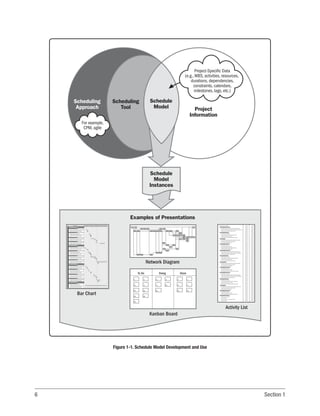
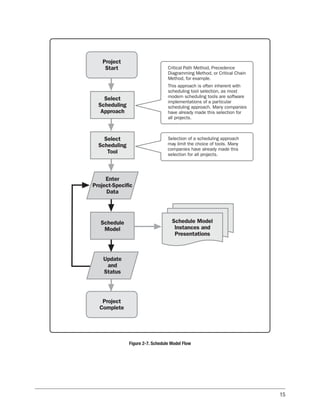
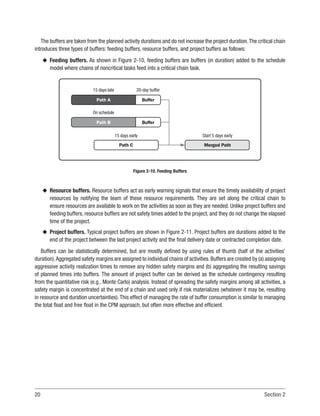
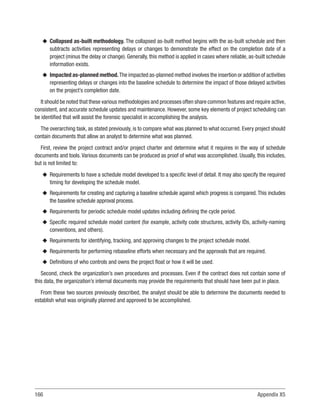
Schedule model creation begins with selecting a scheduling approach and a scheduling tool that support the
desired scheduling approach. Next, starting with the WBS, project-specific data are incorporated within the scheduling
tool to create a unique schedule model. Schedule model instances are snapshots captured from the schedule model.
Schedulers produce various presentations from these schedule model instances based on the project-specific data.
See Figure 1-1 to better understand the interrelationships of the schedule model creation concepts and terminology.
This process results in a schedule model for project execution, monitoring, and control that responds predictably to
progress and changes. The model is also used for engaging communications toward proactive optimization of future
actions. The scheduler should regularly update the schedule model to reflect progress and changes such as scope,
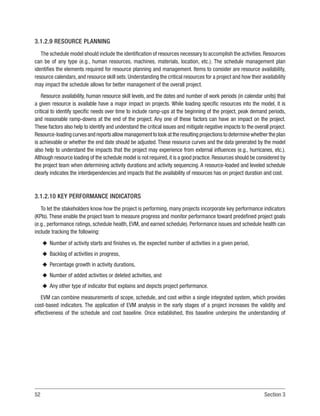
durations, milestones, allocated resources, productivity rates, means of accomplishment, variances, risk evaluations,
and scheduling logic.
This practice standard also provides an assessment that can be used to determine how well the schedule model
conforms to this practice standard. A conformance index (see Section 5 of this practice standard) is developed by
determining which components are used and how they are used within the schedule model. In order to obtain an
acceptable conformance assessment, a schedule model, at a minimum, should contain all of the required components
described in Section 4 and Appendix X3. The selection of an appropriate scheduling software tool provides access
to the required components necessary to develop the schedule model. The use of this practice standard, along with
experience, skill, and organizational maturity, provides the appropriate guidance for application of the components.
The inclusion of a component in this practice standard does not necessarily bear any relation to the issues of project
size or complexity. This practice standard assumes that all schedule models need to have the required components,
basic behaviors, and good practices. Project size and complexity only result in changes in scale and repetition of the
required components. A Guide to the Project Management Body of Knowledge (PMBOK®
Guide) [3] provides processes
to address the factors regarding project size and complexity. In addition, the definition of generally recognized also](https://image.slidesharecdn.com/practicestandard-scheduling-3th28201929-240925192702-904621c1/85/Practice-Standard-Scheduling-3th-282019-29-pdf-20-320.jpg)
![8 Section 1
It is the premise of this practice standard that: (a) the reader has a basic working knowledge of the Project
Management Process Groups and Knowledge Areas defined in the PMBOK®
Guide, (b) the project has a work
breakdown structure (WBS) that conforms to the processes defined in the Practice Standard for Work Breakdown
Structures [4], and (c) sufficient planning has been done.
As schedule development progresses, related practice standards such as the Agile Practice Guide [1], The Standard
for Earned Value Management [5], and The Standard for Risk Management in Portfolios, Programs, and Projects [6]
may be applied.
This practice standard is applicable to individual projects only—not to portfolios or programs. However, because
portfolios and programs are collections of individual projects, any individual schedule model within those structures
should make use of and be evaluated according to this practice standard.
An organization that embraces the principles and good practices outlined in this practice standard and applies
them globally across the organization ensures that all schedule models developed in support of the organization’s
strategic value proposition are done in a consistent manner throughout the organization.](https://image.slidesharecdn.com/practicestandard-scheduling-3th28201929-240925192702-904621c1/85/Practice-Standard-Scheduling-3th-282019-29-pdf-23-320.jpg)

![53
project performance during project execution. EVM can be expanded to include the concept of earned schedule, which
provides time-based indicators to complement cost-based indicators for project performance. For more information
about EVM and earned schedule, refer to Section 3.4.12 and The Standard for Earned Value Management [5].
The project communications management plan may also indicate specific areas of focus with indicators that need to
be monitored.These are usually specific project deliverables or aspects that management believes are directly related
to the ultimate success or failure of the project.
3.1.2.11 MASTER SCHEDULE MODEL
The schedule model is designed and built as a master project containing subprojects. The subprojects can be
structured according to the various teams responsible for specific subprojects of the bigger master project scope
that comprise the project. Examples of subprojects include phased execution (engineering, production, testing,
and integration), globally distributed teams, or the contracting strategy (e.g., multiple projects or multiple project
managers). These subprojects should be linked to each other in certain identified delivery/acceptance or interface
points to ensure that there is an integration between the plans. The schedule management plan defines the steps
used to create, manage, and control the master schedule, subprojects, and project interdependencies.
3.1.2.12 CHANGE CONTROL
Project change is inevitable, so it is essential to plan on how to deal with change (see Part 1, Section 4.6 of the
PMBOK®
Guide). Because projects are highly dynamic and change can occur frequently within the project, the project
team needs to plan for and manage change. Good scheduling practice ensures that, as revisions or adjustments
are made to the schedule as a result of project changes, the affected schedule activities and subsequent risks are
identified and marked as associated with a specific change in accordance with the configuration management plan.
This is especially important when the change results in additional work and may affect the project’s schedule or cost.
It is also critical when using the schedule baseline (discussed later) for benchmarking.
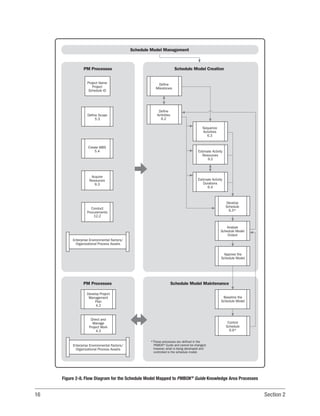
3.2 SCHEDULE MODEL CREATION
This section offers a general overview of the essential elements for developing a sound schedule model.
Good practices for each component are contained in the components list in Section 4 of this practice standard. A
review of Section 4 is strongly encouraged to understand all aspects associated with each component. It is crucial
to take into consideration all of the information, procedures, and restrictions documented in the schedule model
management section.](https://image.slidesharecdn.com/practicestandard-scheduling-3th28201929-240925192702-904621c1/85/Practice-Standard-Scheduling-3th-282019-29-pdf-68-320.jpg)
![62 Section 3
3.2.1.5 DETERMINE THE DURATION FOR EACH ACTIVITY
The duration is an estimate of the working time necessary to accomplish the work represented by the activity.
In the case of team resources, the number of resources that are expected to be available to accomplish an activity,
together with the standard or expected productivity of those resources, often determine the activity’s duration. A
change to a driving resource allocated to the activity will have an effect on the duration, but this is not a simple,
straight-line relationship. Other factors influencing the duration are the type or skill level of the resources available to
undertake the work, resource calendars, the risk associated with the work, and the intrinsic nature of the work. Some
activities (e.g., a 24-hour stress test) take a set amount of time to complete regardless of the resource allocation.
While it is feasible to estimate a duration for an activity at any time, generally accepted good practice recommends
(a) defining the activity first, (b) tying it logically into the overall schedule sequence, and (c) focusing on activity
resources and duration. At this point in time, the relationship between the activity duration and work in the schedule
is better understood; so resource flows, activity team sizes, etc. can begin to be determined.The relationship between
the activity’s duration and its cost is made explicit in the basis of estimate or assumptions for both the cost and the
schedule. This document should be kept current as schedule durations change during schedule model maintenance.
See Sections 3.3 and 3.4 for more information.
The scheduler should understand the method used by the schedule model in order to plan the activities related to
duration estimation for each schedule activity. There are two types of schedule model methods:
u
u Deterministic schedule models. Deterministic schedule models are networks of activities connected with
dependencies that describe the work to be performed, static duration, and planned date to complete the
project if everything goes according to plan.
u
u Probabilisticschedulemodels.Probabilisticschedulemodelsarenetworkswithallelementsofadeterministic
schedule model, where the activity duration of the tasks are random variables with assigned minimum and
maximum durations and an appropriate probability distribution.
For more information about estimating activity duration, refer to the Practice Standard for Project Estimating [7]. For
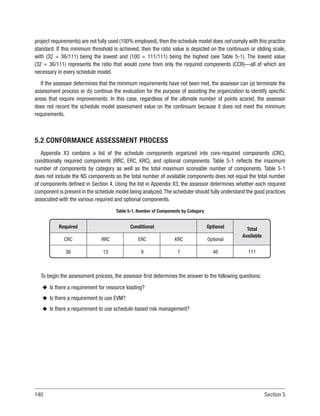
more information on the best practices for project risk analysis using probabilistic schedule models, see The Standard
for Risk Management in Portfolios, Programs, and Projects [6].
3.2.1.6 ANALYZE THE SCHEDULE OUTPUT
Once completed, the schedule model contains a set of unique activities that have varying durations and are
connected by defined logical relationships. The schedule model provides the project team with information on what
needs to be accomplished and the sequence required to accomplish the project deliverables. However, the schedule
model does not indicate when these various activities should be performed. In order to acquire that information, the](https://image.slidesharecdn.com/practicestandard-scheduling-3th28201929-240925192702-904621c1/85/Practice-Standard-Scheduling-3th-282019-29-pdf-77-320.jpg)
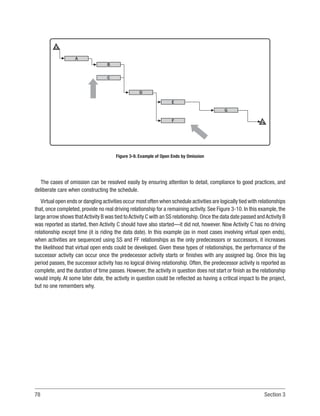
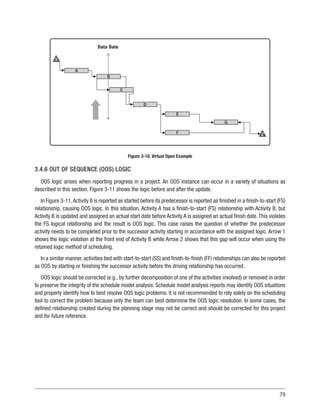
![70 Section 3
3.3.7 MAINTAIN THE RECORDS
Proper record management is part of configuration control. Detail the initial logic and major decision points of
the project and the thought process that went into creating the baselined schedule flow logic. This helps to support
actions taken and lessons learned. It is important to maintain records that explain all changes in activity durations or
logic as alterations are being made in the schedule model. Activity log notes are often used for this purpose. These
records provide valuable data if it becomes necessary to reconstruct what happened and why. Proper use of various
components (such as activity logs/notes/comments) is important for documenting the context as to why a task was
delayed or took longer than expected.This information can be used to (a) explain more completely why activities were
constrained to a certain date or (b) record any other information that explains what occurred on this activity. Compare
the baseline schedule to the last update of the schedule to document changes that have occurred over time and to
determine the accuracy of the original baseline. This information can be useful for future projects of similar scope.
Many of the good practices and elements described are also included in Section 4 within the details of each
component contained in the schedule model components list. A complete understanding of the various components
is needed in order to maximize the potential for their proper application and the development of a sound schedule.
3.3.8 CHANGE CONTROL
Controlling project changes is one of the most important aspects in keeping the project on schedule and ensuring
the schedule model remains relevant in terms of its ability to accurately forecast. For additional information and
guidance, see the Practice Standard for Project Configuration Management [8]. Project change can be driven by
either (a) internal factors such as a scope change or (b) external factors over which the team has no control. In either
situation, proper change control should be an integral part of the ongoing schedule model maintenance process.
Use components such as activity logs/notes/comments for documenting the context, identifying why a task was
delayed or took longer than expected, and documenting changes to the scheduling model logic. It is important for the
scheduling analyst to be able to understand the backward and forward traceability of the schedule model from the
baseline and determine how the accepted change maps back to any changes in the scheduling logic. Each schedule
model instance captures any changes between the previous instances of the schedule including any existing activity
logs/notes/comments when each instance is captured and archived.These logs/notes/comments provide an excellent
source of history for anyone trying to determine what occurred during the project’s performance and why.](https://image.slidesharecdn.com/practicestandard-scheduling-3th28201929-240925192702-904621c1/85/Practice-Standard-Scheduling-3th-282019-29-pdf-85-320.jpg)
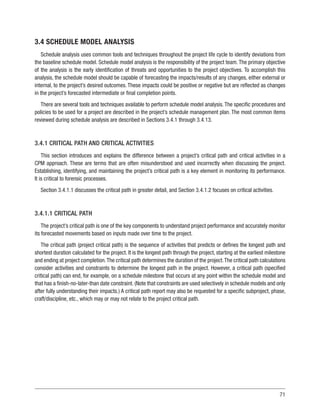
![74 Section 3
Total float and free float may also be impacted by external dependencies and other hard constraint dates listed in the
schedule model.These external dependencies should be explained in activity logs/notes/comments or linked to external
milestones whenever they are applied so that everyone can understand what changes have been made and why.
Monitoring and managing these two vital components are critical to completing the project on time and meeting
milestones as planned. Decreases to total float and free float are strong indicators of the places where recovery plans
may need to be developed.
3.4.3 ESTIMATION OF ACTIVITY DURATIONS
The data from available historical information can be used to develop the duration estimates.
When there is a great deal of uncertainty in activity duration, a commonly used estimating technique is the three-point
estimate.These three points correspond to activity durations defined as optimistic, most likely, and pessimistic durations.
Additionally,the risk register may also be used to support estimating the uncertainty in activity durations.In order to quantify
uncertainty about the overall project duration, starting from the three-point estimate of every activity, PERT (program
evaluation and review technique), which uses an approximation of beta distribution, is most commonly used. PERT activity
duration is calculated as [optimistic duration + (4 × most likely duration) + pessimistic duration]/6 in a weighted average
distribution and [optimistic duration + most likely duration + pessimistic duration]/3 in a triangular distribution.
PERT focuses on activity duration. It allows for random activity duration and weights the activity-estimated duration
on the range of duration estimates provided by stakeholders.
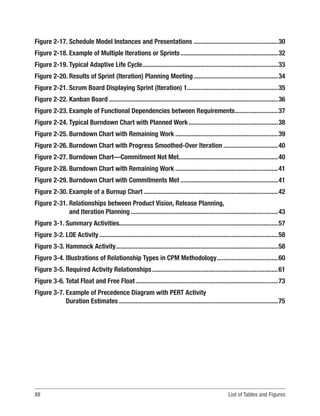
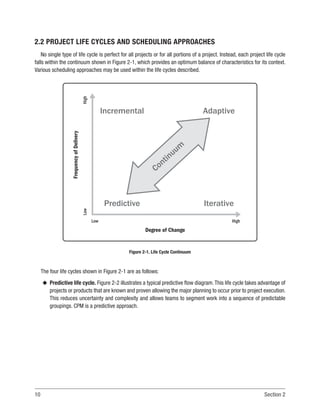
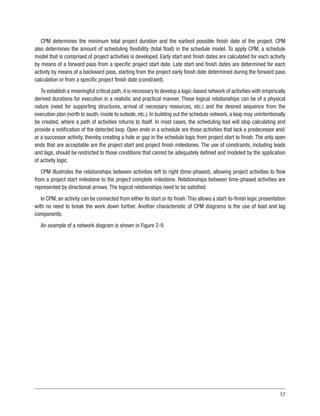
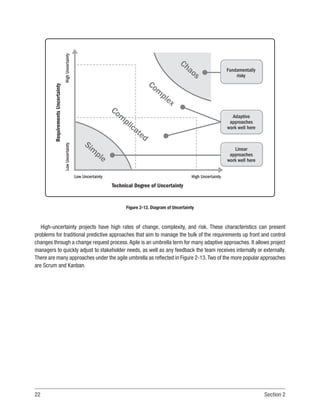
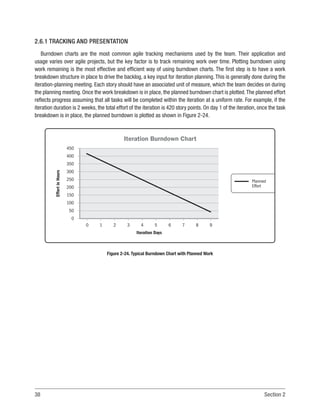
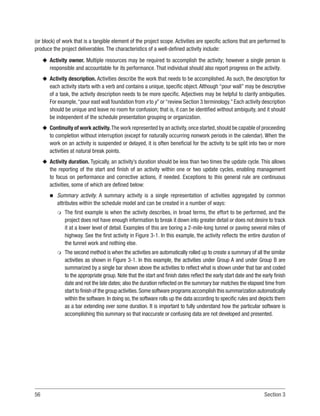
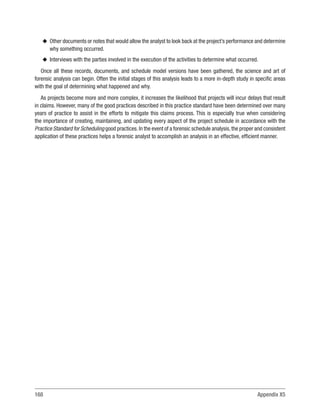
In Figure 3-7,starting with a precedence diagram,PERT permits activity duration estimates to be determined,allowing
for the uncertainty contained in the duration estimating process.Three duration estimates are required for each activity:
u
u Optimistic duration. The minimum activity duration under the most favorable conditions.
u
u Most likely duration. The activity duration that will occur most often.
u
u Pessimistic duration. The activity duration under the least favorable conditions.
The durations determined by the referenced equation are used as activity-estimated durations. Generally, durations
are established at a specific statistical level of significance (for example, 95% confidence level). The weighting in
the equation is a manual approximation of the statistical distribution. With more sophisticated calculations (e.g.,
using computers), an implementation of statistical or multiple simulations of PERT is possible, which approaches the
methods and results of Monte Carlo analysis (see Section 3.4.11).
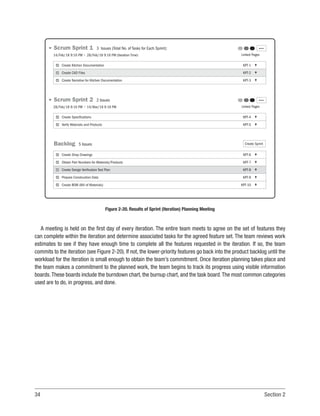
The degree to which the distribution is skewed is suggested by the shape of the curve representing the three
estimated durations (such as beta, uniform, or triangular). The distribution relating the three duration estimates (or
cost estimates) should be selected to best fit the supporting data for similar activities.](https://image.slidesharecdn.com/practicestandard-scheduling-3th28201929-240925192702-904621c1/85/Practice-Standard-Scheduling-3th-282019-29-pdf-89-320.jpg)
![75
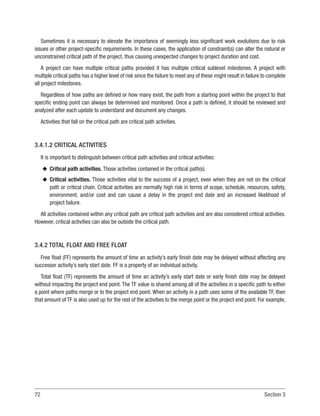
The standard deviation of an activity is reflected in Figure 3-8:
u
u Degree of variation from the average (mean),
u
u Indicates the standard error in the estimate and provides an idea of its accuracy, and
u
u The larger the standard deviation (spread between the optimistic and pessimistic estimates), the larger the
risk in the estimate:
n
n ± 1 standard deviation = 68.26%,
n
n ± 2 standard deviations = 95.46%,
n
n ± 3 standard deviations = 99.73%, and
n
n ± 6 standard deviations = 99.999998%.
Additional information on estimating techniques is provided in the Practice Standard for Project Estimating [7].
Probability
of
Occurrence
Lower
Higher
Possible Durations
Shorter Longer
Most Likely
PERT Weighted Average =
Optimistic + 4 x Most Likely + Pessimistic
6
Optimistic
Beta Distribution
Pessimistic
Figure 3-7. Example of Precedence Diagram with PERT Activity Duration Estimates](https://image.slidesharecdn.com/practicestandard-scheduling-3th28201929-240925192702-904621c1/85/Practice-Standard-Scheduling-3th-282019-29-pdf-90-320.jpg)
![83
3.4.9 LINKS TO/FROM SUMMARY ACTIVITIES
Generally, it is not recommended to use links on summary activities because the logic can be difficult to follow. In
addition, it is difficult to identify the specific tasks that are driving the critical path. Using links on summary activities
may produce logic errors and create circular logic within the schedule model. It is a good practice to avoid the use of
links on summary activities.
3.4.10 SCHEDULE RESOURCE ANALYSIS
A sound schedule model contains activities/work elements that are established with careful consideration to
the resources that will be required to accomplish the effort. These resources can include various types of human
resources (e.g., programmers, writers, laborers, welders, iron workers, masons, carpenters, etc.). Resources can also
include critical equipment needs (e.g., cranes, printers, trucks, etc.).
Once resources are identified, productivity values, scarcity/availability of those types of resources, and interfaces
with other types of resources can become a factor in activity durations. Activity durations have an integral bearing on
the project duration as well as the cost.
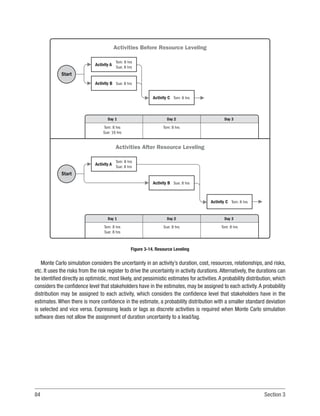
Existing software often allows the project to be adjusted based on the availability of one or more defined resources.
This is called resource leveling. This leveling effort addresses the number of resources that may be available during
any period of time.The durations and timing of the schedule activities may be adjusted based on predefined resource
thresholds (see Figure 3-14). Note that in this example, the activities have been moved due to limited resource
availability, and the end date of the string of activities is now later. Generally, this results in longer project durations
or a decision to make more resources available. Some software products accomplish this leveling function within the
assigned parameters, but do not save the outcome. The scheduler and project staff should review the result of the
leveling effort and make specific changes to the project model logic to save the desired outcome.
3.4.11 SCHEDULE RISK ASSESSMENT
Schedule risk analysis is used to establish and validate schedule contingencies, identify priority risks and
risk-driven events, and continuously monitor changes on project-related risks. PERT does not recognize that parallel
float paths can contribute to risk especially at merge points (also known as merge bias or path convergence). It is too
complex to perform a deep analysis of this bias without doing a simulation such as Monte Carlo, which determines
the magnitude of the bias. The larger and more complex a project is, the greater the cumulative impact of risk on
the project. The circumstances dictating the frequency, rigor, and use of schedule risk identification and analysis are
documented in the project management plan or other contractual documents. For more information on risk concepts
see the PMBOK®
Guide and The Standard for Risk Management in Portfolios, Programs, and Projects [6].](https://image.slidesharecdn.com/practicestandard-scheduling-3th28201929-240925192702-904621c1/85/Practice-Standard-Scheduling-3th-282019-29-pdf-98-320.jpg)

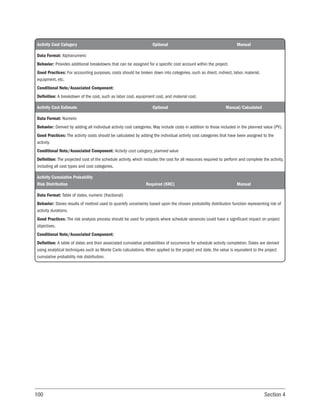
![98 Section 4
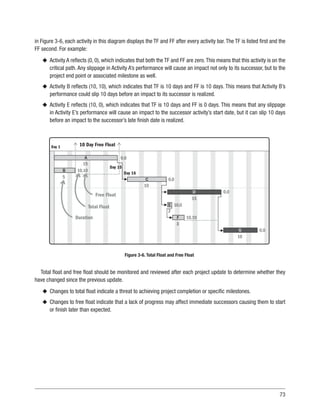
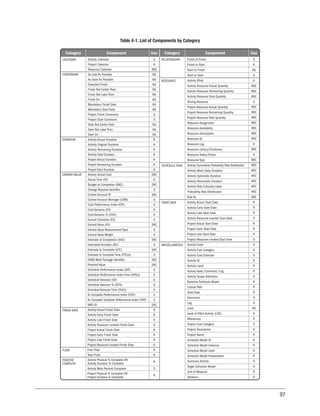
4.3 DETAILED COMPONENTS LIST
This section identifies individual components and the eight types of information defined for each component. It is
organized alphabetically.
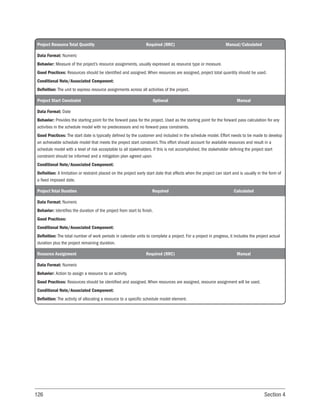
Activity Actual Cost (AC) Required (ERC) Calculated/Manual
Data Format: Numeric
Behavior: Measurement of cost.
Good Practices: Includes actual cost when using earned value methodology in the schedule.
Conditional Note/Associated Component: See The Standard for Earned Value Management [5]. This term is also known as actual
cost of work performed (ACWP). This standard recognizes that AC may only be available at summarized levels of activities and not for
each discrete activity in the schedule model.
Definition: The total cost of the work completed during a given time period. This value may be calculated at any schedule model outline
level and between various data dates. When the calculation is performed using the project start date and the most current data date,
the values are called cumulative. Actual cost may also include monetary costs of materials and other fixed costs.
Activity Actual Duration Required Calculated/Manual
Data Format: Numeric
Behavior: Defines the length of time that has elapsed since the activity began. The unit of measure may be elapsed time or work time.
Good Practices:
Conditional Note/Associated Component:
Definition: The total number of work periods in calendar units between the schedule activity actual start date and either the data date of the
schedule model (if the schedule activity is in progress) or the activity actual finish date (if the schedule activity is complete).
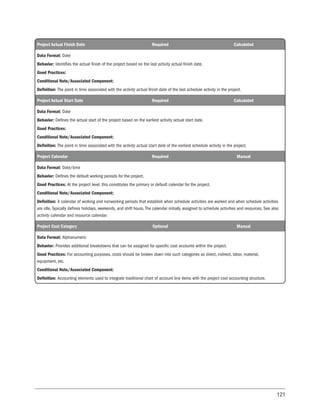
Activity Actual Finish Date Required Manual
Data Format: Date
Behavior: Defines the date that the activity was completed.
Good Practices: All activities with finishes prior to the data date should have actual finish dates assigned. Actual dates replace CPM early
and late dates. Specifies that the activity is 100% complete.
Conditional Note/Associated Component: Activity duration percent complete/activity physical percent complete
Definition: The point in time at which a scheduled activity completed.](https://image.slidesharecdn.com/practicestandard-scheduling-3th28201929-240925192702-904621c1/85/Practice-Standard-Scheduling-3th-282019-29-pdf-113-320.jpg)
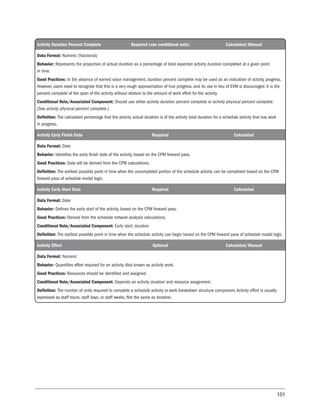
![104 Section 4
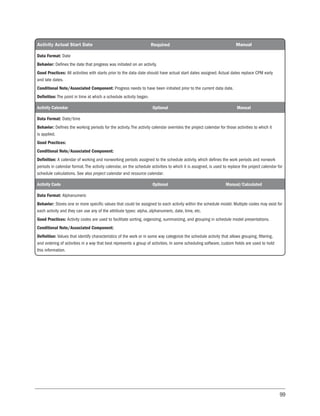
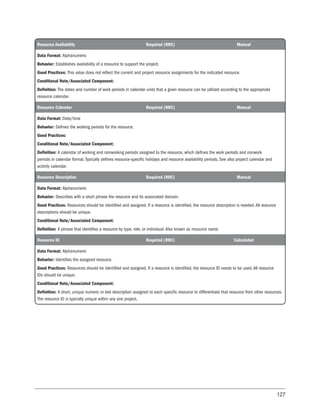
Activity Original Duration Required Manual
Data Format: Numeric
Behavior: Defines the length of time allocated to complete the schedule activity prior to reporting any progress on the activity. The
implementation of activity original duration is scheduling tool dependent.
Good Practices: A record should be maintained of how the duration was determined for future reference and revisions. Generally, durations
should not exceed two or three reporting cycles.
Conditional Note/Associated Component:
Definition: The activity duration originally assigned to a schedule activity; this duration is typically not updated as progress is reported on
the activity. Used for comparison with activity actual duration and activity remaining duration when reporting schedule progress, the activity
original duration is normally developed with a reliance on historical data, specialists, resource availability, financial considerations, and
volume of work to be performed.
Activity Pessimistic Duration Required (KRC) Calculated/Manual
Data Format: Numeric
Behavior: Identifies the length of time allocated to complete the schedule activity assuming the worst possible conditions. Risks are only
calculated on remaining durations.
Good Practices: Pessimistic durations should be used for schedule risk calculations.
Conditional Note/Associated Component: Activity optimistic duration, activity most likely duration, activity original duration (if performing
risk analysis)
Definition: The total number of work periods in calendar units assigned to perform the schedule activity, considering all of the variables that
could affect performance; it is determined to be the longest possible activity duration.
Activity Physical Percent Complete Required (see conditional note) Manual
Data Format: Numeric (fractional)
Behavior: Represents the proportion of actual physical work completed as a percentage of total expected physical work at a given point
in time.
Good Practices: For any started activity, the physical percent complete needs to be updated. The project scheduler should make a decision
at the beginning of the project as to which method will be used for the duration of the project. There may be different methods to measure
completeness. These include the earned value-based earning rules (see The Standard for Earned Value Management [5]) such as
50/50 rule, actual quantities, percent complete, nonlinear by milestone, etc., as well as estimates by the people working the activity. Of
these methods, EV-based percentage assessment is considered to be the best as it tends to be less subjective.
Conditional Note/Associated Component: Should use either activity duration percent complete or activity physical percent complete.
Requires use of earned value technique.
Definition: An estimate, expressed as a percent, of the amount of work that has been completed on a schedule activity, measured in terms
of either physical work progress or via the earning rules of earned value management.](https://image.slidesharecdn.com/practicestandard-scheduling-3th28201929-240925192702-904621c1/85/Practice-Standard-Scheduling-3th-282019-29-pdf-119-320.jpg)
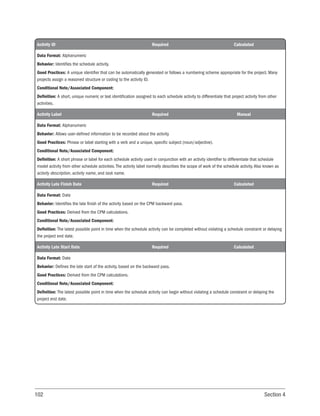
![109
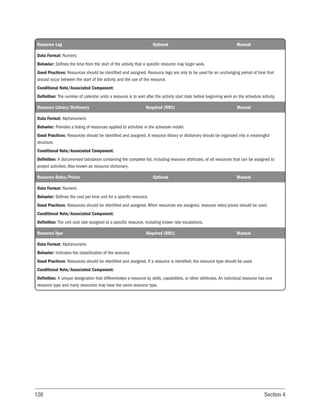
Budget at Completion (BAC) Required (ERC) Calculated
Data Format: Numeric
Behavior: Defines the project-authorized budget.
Good Practices: Include resources and associated costs in the schedule model to define the time-phased budget.
Conditional Note/Associated Component: A management-approved BAC may be called an approved baseline.
Definition: The sum total of resource costs listed in the schedule model that is approved by management. BAC may be calculated by activity
and then summed to various levels.
Change Request Identifier Optional Manual
Data Format: Alphanumeric
Behavior: Identifies configuration-controlled authorized changes to the schedule model.
Good Practices: As part of schedule configuration management, use the change request identifier to mark schedule model changes
approved by configuration management processes. This item is normally addressed in a custom field.
Conditional Note/Associated Component: See the Practice Standard for Project Configuration Management [8].Activity note/comment/log.
Definition: The change request identifier is the primary key value for items in the program change log as related to the schedule model.
Control Account ID Required (ERC) Manual
Data Format: Alphanumeric
Behavior: Identifies work associated with a stated cost collection account.
Good Practices: Include the control account identifier when using earned value methodology in the schedule.
Conditional Note/Associated Component: See The Standard for Earned Value Management [5].
Definition: An alphanumeric cost-accounting identifier typically assigned at the intersection of the work breakdown structure and
organizational breakdown structure at the level where costs will be collected. Control accounts contain work packages.](https://image.slidesharecdn.com/practicestandard-scheduling-3th28201929-240925192702-904621c1/85/Practice-Standard-Scheduling-3th-282019-29-pdf-124-320.jpg)
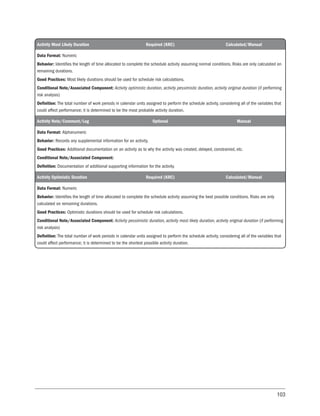
![110 Section 4
Control Account Manager (CAM) Optional Manual
Data Format: Alphanumeric
Behavior: Identifies the single person accountable for cost performance of a single control account.
Good Practices: Include the CAM identifier when using earned value methodology in the schedule. Sometimes a reference number is used
for a CAM without naming an individual.
Conditional Note/Associated Component: See The Standard for Earned Value Management [5].
Definition: An alphanumeric designation of the single person accountable for the costs and achievement of the scope of work identified by
the control account; this may be the name of an individual or a unique reference identifying the individual.
Cost Performance Index (CPI) Optional Calculated
Data Format: Numeric
Behavior: Defines cost performance relative to accomplishments and a time-phased budget.
Good Practices: Include CPI when using earned value methodology in the schedule.
Conditional Note/Associated Component: See The Standard for Earned Value Management [5].
Definition: EV/AC, calculated as time-phased values and used to measure the cost efficiency in a project. These values may be calculated
at any schedule model outline level and between various data dates. When the calculation is performed using the project start date and the
most current data date, the values are called cumulative.
Cost Variance (CV) Optional Calculated
Data Format: Numeric
Behavior: Represents the time-phased deviation of achieved performance from actual costs.
Good Practices: Include cost variance when using earned value methodology in the schedule.
Conditional Note/Associated Component: See The Standard for Earned Value Management [5].
Definition: EV − AC, calculated as time-phased values and used to measure cost performance in a project. These values may be calculated
at any schedule model outline level and between various data dates. When the calculation is performed using the project start date and the
most current data date, the values are called cumulative.](https://image.slidesharecdn.com/practicestandard-scheduling-3th28201929-240925192702-904621c1/85/Practice-Standard-Scheduling-3th-282019-29-pdf-125-320.jpg)
![111
Cost Variance Percent (CV%) Optional Calculated
Data Format: Numeric
Behavior: Represents the time-phased deviation of scheduled performance from actual achieved performance expressed as a percentage.
Good Practices: Include cost variance percent when using earned value methodology in the schedule.
Conditional Note/Associated Component: See The Standard for Earned Value Management [5].
Definition: 100 × (EV − AC) / (EV), calculated as time-phased values. These values may be calculated at any schedule model outline level
and between various data dates. When the calculation is performed using the project start date and the most current data date, the values
are called cumulative. When EV = 0, CPI = 0, regardless of AC.
Critical Path Required Calculated
Data Format: Alphanumeric (list of activities)
Behavior: Identifies the activities on the critical path.
Good Practices: To establish a meaningful critical path, it is necessary to develop logical and well-defined activity relationships with
empirically derived durations for executing all the project activities in a practical manner. Therefore, there should not be any open ends other
than the project start and project finish. Constraints need to be restricted to only those that represent external or internal events that cannot
be effectively addressed with activity logic.
Conditional Note/Associated Component: Relationships defined for all activities.
Definition: Generally, but not always, the sequence of schedule activities determining the duration of the project. Generally, it is the longest
path through the project. However, a critical path can end, as an example, on a schedule milestone that is in the middle of the schedule
model and that has a finish-not-later-than imposed date schedule constraint. See also project critical path, specified critical path, and
critical path method.
Data Date Required Manual
Data Format: Date
Behavior: Records the date through which the project status and progress is determined and reported.
Good Practices: The data date should be advanced at the time of reporting status, at regular intervals.
Conditional Note/Associated Component:
Definition: A point in time when the status of the project is recorded. Any data to the left of the data date (earlier) is considered historical
information. Any data to the right of the data date (later) is the forecast of remaining work. The data date is also the point at which
scheduling and performance measurement analysis is conducted. Also known as as-of-date.](https://image.slidesharecdn.com/practicestandard-scheduling-3th28201929-240925192702-904621c1/85/Practice-Standard-Scheduling-3th-282019-29-pdf-126-320.jpg)
![112 Section 4
Driving Resources Optional Manual
Data Format: Flag (determined by algorithm [Boolean])
Behavior: Identifies a resource as driving to control the duration of activities. Resources are only one of the elements that may affect an
activity duration.
Good Practices: Driving resources should be considered within the schedule.
Conditional Note/Associated Component:
Definition: Resources that are considered to have a direct impact on activity duration during resource leveling.
Earned Schedule (ES) Optional Calculated
Data Format: Numeric
Behavior: Measures accomplishment.
Good Practices: Include earned schedule when using earned schedule methodology in the schedule model.
Conditional Note/Associated Component:
Definition: Identify the time at which the amount of earned value (EV) accrued should have been earned. When the calculation is performed
using the project start date and the most current data date, the values are called cumulative.
Earned Value (EV) Required (ERC) Calculated
Data Format: Numeric
Behavior: Measures accomplishment.
Good Practices: Include earned value when using earned value methodology in the schedule model.
Conditional Note/Associated Component: See The Standard for Earned Value Management [5]. This term is also known as budgeted cost
of work performed (BCWP).
Definition: The time-phased value of the accomplished effort, independent of the cost needed to achieve the accomplishment; the cost that
would be budgeted for the amount of completed work prior to its execution. When completed, EV = BAC. These values may be calculated at
any schedule model outline level and between various data dates. When the calculation is performed using the project start date and the
most current data date, the values are called cumulative.](https://image.slidesharecdn.com/practicestandard-scheduling-3th28201929-240925192702-904621c1/85/Practice-Standard-Scheduling-3th-282019-29-pdf-127-320.jpg)
![113
Earned Value Measurement Type Optional Manual
Data Format: Alphanumeric
Behavior: Identifies for each activity or WBS level, one of the recognized measurement types for collecting earned value as defined in the
project’s earned value management systems (EVMS). May include, for example, 0-100, 50-50, weighted milestone, etc.
Good Practices: For cost/schedule integration, include the earned value measurement type when using earned value methodology in the
schedule. The method stated in the schedule matches the earned value method stated in the work package.
Conditional Note/Associated Component: See The Standard for Earned Value Management [5].
Definition: The alphanumeric designation of a specific measurement type for collecting earned value in the schedule as defined in
the EVMS.
Earned Value Weight Optional Manual
Data Format: Numeric
Behavior: Assigns a percentage of earned value (EV) for a work package to be allocated to specific activities.
Good Practices: When EV is allocated on a percentage basis, use the EV weight in the schedule where appropriate.
Conditional Note/Associated Component: See The Standard for Earned Value Management [5].
Definition: The percentage of EV allocated to a specific group of activities.
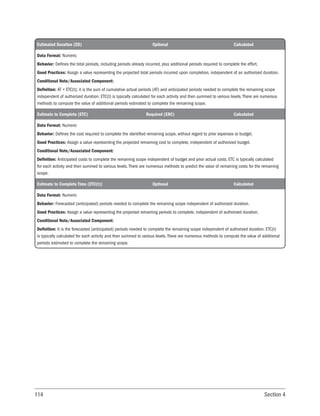
Estimate at Completion (EAC) Required (ERC) Calculated
Data Format: Numeric
Behavior: Defines the total cost, including actual costs already incurred, plus additional costs required to complete the effort.
Good Practices: Assign a value representing the projected total costs incurred upon completion, independent of an authorized budget.
Conditional Note/Associated Component:
Definition: AC + ETC, cumulative actual incurred costs (AC) plus anticipated costs to complete the remaining scope independent of budget.
EAC is typically calculated for each activity and then summed to various levels. There are numerous methods to compute the value of
additional costs estimated to complete the remaining scope.](https://image.slidesharecdn.com/practicestandard-scheduling-3th28201929-240925192702-904621c1/85/Practice-Standard-Scheduling-3th-282019-29-pdf-128-320.jpg)
![115
EVMS Work Package Identifier Required (ERC) Manual
Data Format: Alphanumeric
Behavior: Identifies the EVMS work package in the schedules.
Good Practices: For cost/schedule integration, include the work package identifier when using earned value methodology in the schedule.
A work package may contain multiple WBS elements. The work package identifier for an activity will contain a single value that maps it to a
single work package.
Conditional Note/Associated Component: See The Standard for Earned Value Management [5] and the Practice Standard for Work
Breakdown Structures [4].
Definition: The work package identifier is an alphanumeric designation of a specific work package in the EVMS.
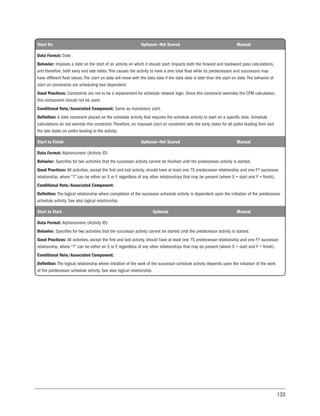
Expected Finish Optional–Not scored Manual
Data Format: Date
Behavior: Imposes a finish date on an activity that determines the remaining duration of the activity after it has been reported as started
with an actual start. The behavior of expected finish constraints are scheduling tool dependent.
Good Practices: Constraints are not to be a replacement for schedule network logic. The expected finish constraint should be used sparingly.
Conditional Note/Associated Component:
Definition: A date constraint placed on both the activity CPM early and late finish dates of an in-progress schedule activity that affects when
the schedule activity can be scheduled for completion and is usually in the form of a fixed imposed date. This constraint requires the activity
remaining duration to be set equal to the difference between the activity expected finish date and the data date to force the schedule
activity to be scheduled to finish upon the imposed date.
Finish Not Earlier Than Optional—Not scored Manual
Data Format: Date
Behavior: Imposes a date on the finish of an activity prior to which the activity cannot finish. The behavior of finish not earlier than is
scheduling tool dependent.
Good Practices: Constraints are not to be a replacement for schedule network logic.The finish not earlier than constraint should be used sparingly.
Conditional Note/Associated Component:
Definition: A date constraint placed on the schedule activity that affects when a schedule activity can be scheduled and is usually in the
form of a fixed imposed date.A finish not earlier than constraint prevents the activity from being scheduled to finish earlier than the imposed
date. Not earlier than constraints impact only the CPM forward pass calculation; therefore, only the CPM early dates of a schedule activity.](https://image.slidesharecdn.com/practicestandard-scheduling-3th28201929-240925192702-904621c1/85/Practice-Standard-Scheduling-3th-282019-29-pdf-130-320.jpg)
![119
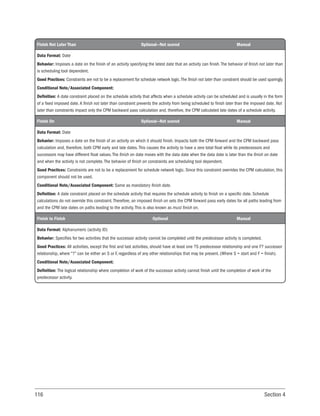
Mandatory Finish Date Optional—Not scored Manual
Data Format: Date
Behavior: Imposes a date on the finish of an activity on which it is required to finish. Impacts both the CPM forward and the backward
pass date calculations and therefore, both early and late dates. This causes the activity to have a zero total float while its predecessors and
successors may have different float values. The behavior of mandatory finish date constraints is scheduling tool dependent.
Good Practices: Constraints are not to be a replacement for schedule network logic. Since this constraint overrides the CPM calculation,
this component should not be used.
Conditional Note/Associated Component: Same as finish on.
Definition: A date constraint placed on the schedule activity that requires the schedule activity to finish on a specific date. Schedule
calculations do not override this constraint. Therefore, an imposed mandatory finish drives the CPM early dates for all paths leading from
and the late dates on paths leading to the activity. Also known as must finish on.
Mandatory Start Date Optional—Not scored Manual
Data Format: Date
Behavior: Imposes a date on the start of an activity on which it is required to start. Impacts both the CPM forward and the backward
pass date calculations and, therefore, both early and late dates. This causes the activity to have a zero total float while its predecessors
and successors may have different float values. The behavior of mandatory start date constraints is scheduling tool dependent.
Good Practices: Constraints are not to be a replacement for schedule network logic. Since this constraint overrides the CPM calculation,
this component should not be used.
Conditional Note/Associated Component: Same as start on.
Definition: A date constraint placed on the schedule activity that requires the schedule activity to start on a specific date. Schedule
calculations do not override this constraint. Therefore, an imposed mandatory start drives the CPM early dates for all paths leading from
and the late dates on paths leading to the activity. Also known as must start on.
Milestone Required Calculated
Data Format: Flag (determined by algorithm [Boolean])
Behavior: Represents an activity that identifies a significant event.
Good Practices: The milestone has no resources assigned and no duration.At a minimum, a project start and finish milestone needs to be
present in the schedule. Milestone indicator should have a unique shape such as a diamond.
Conditional Note/Associated Component:
Definition: A significant point or event in the project. See also schedule milestone.](https://image.slidesharecdn.com/practicestandard-scheduling-3th28201929-240925192702-904621c1/85/Practice-Standard-Scheduling-3th-282019-29-pdf-134-320.jpg)
![120 Section 4
Planned Value (PV) Required (ERC) Calculated
Data Format: Numeric
Behavior: The time-phased measurement of anticipated expenditures.
Good Practices: Include planned value when using earned value methodology in the schedule model.
Conditional Note/Associated Component: See The Standard for Earned Value Management [5]. This term is also known as budgeted cost
of work scheduled (BCWS). PV is sometimes known as baseline plan.
Definition: The time-phased value of the management-approved intended and necessary expenditures to achieve the defined scope. When
the scope is completed, PV = BAC. These values may be calculated at any schedule model outline level and between various data dates.
When the calculation is performed using the project start date and the most current data date, the values are called cumulative.
Probability Risk Distribution Required (KRC) Calculated
Data Format: Numeric
Behavior: Represents a key input for quantitative risk analysis of activity durations. Common probability risk distributions include:
normal—or bell curve, log normal, uniform, triangular, Beta, and discrete (user-defined).
Good Practices: May be found in The Standard for Risk Management in Portfolios, Programs, and Projects [6]. Probability risk distribution
should be assigned to each activity in the schedule model. Data, usually judgmentally determined, is collected from project participants
and other experts during risk interviews or workshops.
Conditional Note/Associated Component:
Definition: Defines the probability that particular attributes or ranges of attributes will be, or have been, observed.
Project Actual Duration Required Calculated
Data Format: Numeric
Behavior: Identifies the length of time that has elapsed since the project plan began.
Good Practices:
Conditional Note/Associated Component:
Definition: The total number of work periods in calendar units between the project actual start date of the project and either the data date
of the schedule model instance when the project is in progress or the project actual finish date when the project is complete.](https://image.slidesharecdn.com/practicestandard-scheduling-3th28201929-240925192702-904621c1/85/Practice-Standard-Scheduling-3th-282019-29-pdf-135-320.jpg)
![124 Section 4
Project Name Required Manual
Data Format: Alphanumeric
Behavior: Describes, in a short form, the project.
Good Practices:
Conditional Note/Associated Component:
Definition: A short phrase or label for each project, used in conjunction with the project identifier to differentiate a particular project from
other projects in a program. Also known as project title.
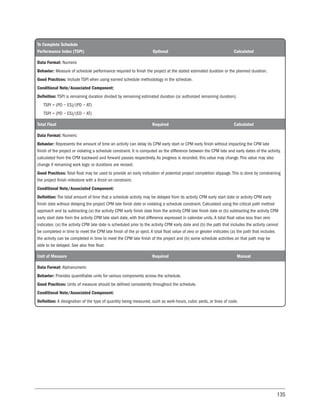
Project Physical Percent Complete
Required (see Project Duration
Percent Complete) Calculated
Data Format: Numeric (fractional)
Behavior: Represents the progress of the project as a percentage of total physical work to be done. At the project level, this value is typically
calculated, using earned value management techniques. As progress is recorded, the earned value at the activity level is calculated.
Good Practices: Performed in accordance with The Standard for Earned Value Management [5]. Project physical percent complete is
determined by dividing the summarized earned value units by the project budget in the same units.
Conditional Note/Associated Component: Requires use of earned value technique. Should use either project duration percent complete
or project physical percent complete.
Definition: A calculation, expressed as a percent, of the amount of work that has been completed on the project, measured in terms of
physical work progress.
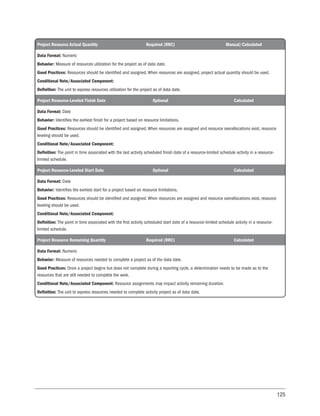
Project Remaining Duration Required Calculated
Data Format: Numeric
Behavior: Identifies the length of time required to complete the project from the data date.
Good Practices: Once a project begins but does not complete during a reporting cycle, a determination is made as to the duration that
remains to complete the work.
Conditional Note/Associated Component:
Definition: The total number of work periods in calendar units, either equal to the original duration for a project that has not started or
between the data date of the schedule model and the project early finish date of a project that has at least one activity actual start date.
This represents the time needed to complete a project where the work is in progress.](https://image.slidesharecdn.com/practicestandard-scheduling-3th28201929-240925192702-904621c1/85/Practice-Standard-Scheduling-3th-282019-29-pdf-139-320.jpg)
![129
Risk ID Required (KRC) Manual/Calculated
Data Format: Alphanumeric
Behavior: Distinguishes risks on the project’s risk register.
Good Practices: May be found in The Standard for Risk Management in Portfolios, Programs, and Projects [6]. Risk IDs are mapped to
activities in the schedule model where appropriate.
Conditional Note/Associated Component:
Definition: A short, unique numeric or text identification assigned to each risk on the project’s risk register.
Schedule Model ID Required Manual
Data Format: Alphanumeric
Behavior: Identifies the scheduled project.
Good Practices: Should be a unique identifier that can be automatically generated or follow a numbering scheme appropriate for the
organization. It is helpful to assign a reasoned structure or coding to the schedule model ID.
Conditional Note/Associated Component:
Definition: A short, unique numeric or text identification assigned to each schedule model to differentiate that schedule model from others.
Also known as project identifier.
Schedule Model Instance Required Calculated
Data Format: Alphanumeric
Behavior: Indicates which version of the model the schedule represents.
Good Practices: The version number should be incremented in a consistent manner as successive changes are made, resulting in different
versions of the schedule.
Conditional Note/Associated Component:
Definition: A designation of the instance of a schedule model. Examples include: as-of date, revision number, and agreed versioning codes,
among others. Also known as schedule model version.](https://image.slidesharecdn.com/practicestandard-scheduling-3th28201929-240925192702-904621c1/85/Practice-Standard-Scheduling-3th-282019-29-pdf-144-320.jpg)
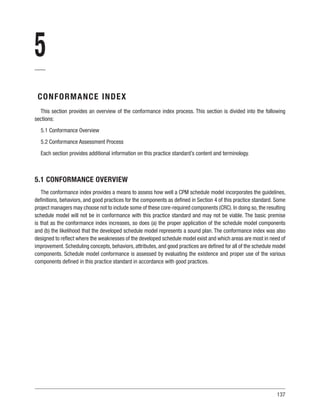
![131
Schedule Performance Index (SPI) Optional Calculated
Data Format: Numeric
Behavior: Defines schedule performance comparing accomplished work to scheduled work.
Good Practices: Include SPI when using earned value methodology in the schedule.
Conditional Note/Associated Component: See The Standard for Earned Value Management [5].
Definition: EV/PV, calculated as time-phased values and used to measure a progress relative to the schedule. These values may be
calculated at any schedule model outline level and between various data dates. When the calculation is performed using the project start
date and the most current data date, the values are called cumulative.
Schedule Performance Index Time (SPI(t) Optional Calculated
Data Format: Numeric
Behavior: Defines schedule performance comparing accomplished work to actual time executed.
Good Practices: Include SPI(t) when using earned schedule methodology in the schedule.
Conditional Note/Associated Component:
Definition: It is the ratio of earned schedule and actual time and used to measure a progress relative to the schedule. These values may be
calculated at any schedule model outline level and between various data dates. When the calculation is performed using the project start
date and the most current data date, the values are called cumulative.
Schedule Variance (SV) Optional Calculated
Data Format: Numeric
Behavior: Deviation of scheduled performance from actual achieved performance.
Good Practices: Include schedule variance when using earned value methodology in the schedule.
Conditional Note/Associated Component: See The Standard for Earned Value Management [5].
Definition: (EV−PV)/PV, calculated as time-phased values and used to measure a progress relative to the schedule. These values may be
calculated at any schedule model outline level and between various data dates. When the calculation is performed using the project start
date and the most current data date, the values are called cumulative.](https://image.slidesharecdn.com/practicestandard-scheduling-3th28201929-240925192702-904621c1/85/Practice-Standard-Scheduling-3th-282019-29-pdf-146-320.jpg)
![132 Section 4
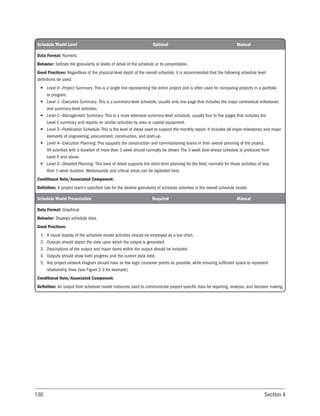
Schedule Variance Percent (SV%) Optional Calculated
Data Format: Numeric
Behavior: Measures deviation of scheduled performance from actual achieved performance.
Good Practices: Include schedule variance percent when using earned value methodology in the schedule.
Conditional Note/Associated Component: See The Standard for Earned Value Management [5].
Definition: 100 × (EV−PV)/(PV), calculated as time-phased values. These values may be calculated at any schedule model outline level
and between various data dates. When the calculation is performed using the project start date and the most current data date, the values
are called cumulative.
Schedule Variance Time (SV(t) Optional Calculated
Data Format: Numeric
Behavior: Measures deviation of scheduled performance from actual time executed.
Good Practices: Include schedule variance SV(t) when using earned schedule methodology in the schedule.
Conditional Note/Associated Component:
Definition: It is the difference between earned schedule (ES) and actual time (AT), and used to measure a progress relative to the schedule.
These values may be calculated at any schedule model outline level and between various data dates. When the calculation is performed
using the project start date and the most current data date, the values are called cumulative.
Start Not Earlier Than Optional—Not Scored Manual
Data Format: Date
Behavior: Imposes a date on the start of an activity prior to which the activity cannot start. Not earlier than constraints impact only the
forward pass calculation, and therefore, the early dates of an activity.
Good Practices: Constraints are not to be a replacement for schedule network logic.The start not earlier than constraint should be used sparingly.
Conditional Note/Associated Component:
Definition: A date constraint placed on the schedule activity that affects when a schedule activity can be scheduled and is usually in the form of a
fixed imposed date.A start not earlier than constraint prevents the schedule activity from being scheduled to start earlier than the imposed date.
Start Not Later Than Optional—Not Scored Manual
Data Format: Date
Behavior: Imposes a date on the start of an activity specifying the latest date that an activity can start.
Good Practices: Constraints are not to be a replacement for schedule network logic.The start not later than constraint should be used sparingly.
Conditional Note/Associated Component:
Definition: A date constraint placed on the schedule activity that affects when a schedule activity can be scheduled and is usually in the form of
a fixed imposed date.A start not later than constraint prevents the schedule activity from being scheduled to start later than the imposed date.](https://image.slidesharecdn.com/practicestandard-scheduling-3th28201929-240925192702-904621c1/85/Practice-Standard-Scheduling-3th-282019-29-pdf-147-320.jpg)
![134 Section 4
Summary Activity Optional Calculated
Data Format: Alphanumeric
Behavior: Inherits information from subordinate activities. May be expressed as a roll-up activity.
Good Practices: Used for vertical traceability and roll-up.
Conditional Note/Associated Component:
Definition: A group of related schedule activities aggregated at some summary level, and displayed/reported as a single activity at that
summary level. See also subnetwork, subproject.
Target Schedule Model Optional Calculated
Data Format: Various
Behavior: Captures the scheduling components for a target schedule model.
Good Practices:
Conditional Note/Associated Component:
Definition: A target schedule model is an instance of the scheduling components used for comparison to other schedule models. A target
schedule model may be selected from any available schedule model instance, for example, last update period.
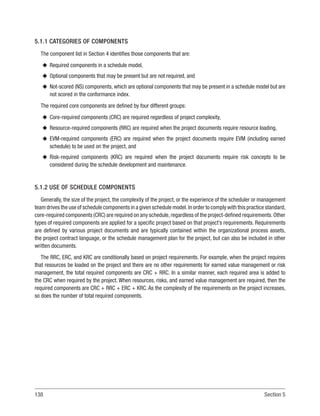
To Complete Performance Index (TCPI) Optional Calculated
Data Format: Numeric
Behavior: Measure of cost performance required to finish the project at the stated EAC or the stated BAC.
Good Practices: Include TCPI when using earned value methodology in the schedule.
Conditional Note/Associated Component: See The Standard for Earned Value Management [5].
Definition: TCPI is remaining effort divided by remaining budget (or authorized remaining funds).
TCPIBAC
= (BAC − EVCUM
)/(BAC − ACCUM
)
TCPIEAC
= (EAC − EVCUM
)/(EAC − ACCUM
)](https://image.slidesharecdn.com/practicestandard-scheduling-3th28201929-240925192702-904621c1/85/Practice-Standard-Scheduling-3th-282019-29-pdf-149-320.jpg)
![136 Section 4
Variance Optional Calculated
Data Format: Numeric
Behavior: Quantifies departure from a date reference point (such as start date, finish date, cost, baseline dates and cost, and duration).
Good Practices: The variance should be reviewed for trends at regular intervals to give early indications of deviation and to determine
whether corrective action is required.
Conditional Note/Associated Component:
Definition: The difference between two selected attributes expressed in appropriate units such as work days or currency.
WBS ID Required Manual/Calculated
Data Format: Alphanumeric
Behavior: Maps the activity or task to the work breakdown structure of the project. Aligns the activity to its parent element within the WBS.
Good Practices: May be found in the Practice Standard for Work Breakdown Structures [4].
Conditional Note/Associated Component:
Definition: A short, unique numeric or text identification assigned to each work breakdown structure (WBS) element to differentiate a
particular WBS from any other WBS element in a program.](https://image.slidesharecdn.com/practicestandard-scheduling-3th28201929-240925192702-904621c1/85/Practice-Standard-Scheduling-3th-282019-29-pdf-151-320.jpg)


![169
REFERENCES
[1] Project Management Institute. 2017. Agile Practice Guide. Newtown Square, PA: Author.
[2] Project Management Institute. 2017. PMI Lexicon of Project Management Terms. Newtown Square, PA: Author.
[3] Project Management Institute.2017.A Guide to the Project Management Body of Knowledge (PMBOK®
Guide) –
Sixth Edition. Newtown Square, PA: Author.
[4] Project Management Institute. 2019. Practice Standard for Work Breakdown Structures (WBS) – Third Edition.
Newtown Square, PA: Author.
[5] Project Management Institute. 2019. The Standard for Earned Value Management – Second Edition. Newtown
Square, PA: Author.
[6] Project Management Institute. 2019. The Standard for Risk Management in Portfolios, Programs, and Projects.
Newtown Square, PA: Author.
[7] Project Management Institute. 2019. Practice Standard for Project Estimating – Second Edition. Newtown
Square, PA: Author.
[8] Project Management Institute. 2007. Practice Standard for Project Configuration Management. Newtown
Square, PA: Author.](https://image.slidesharecdn.com/practicestandard-scheduling-3th28201929-240925192702-904621c1/85/Practice-Standard-Scheduling-3th-282019-29-pdf-184-320.jpg)