This document discusses the challenges that pharmaceutical companies face in implementing portfolio project resource management (PPRM) capabilities. Some key points:
- PPRM aims to optimize a company's R&D portfolio value given limited resources by making consistent go/no-go and resource allocation decisions based on project risks, costs, and commercial potential.
- However, implementing comprehensive PPRM capabilities is difficult due to concerns that it may hamper scientific creativity, require significant effort to standardize processes, and change how decisions are made.
- For PPRM to succeed, companies must standardize business practices, create explicit procedures, and exercise managerial discipline while also addressing longstanding issues and ambiguities in order
David Vermette Writing Sample: Research Overviewdgvermette
The Fast Track members-only site contains articles, presentations, research reports, and interviews about the management of R&D/New Product Development across industries. Members were drawn from major players in the Aerospace/Defense, Automotive, Pharmaceuticals, Computer Software, and other fields. As editor of this site, I was responsible for the content, as well as authoring landing pages, architecting categories, and writing headings, abstracts, and guiding text. The site featured a theme each month fronted by a “Framework & Overview” – a research piece framing the topic as an introduction to the most recent updates. These overviews were then resold as stand alone research articles.
Pharmaceutical Portfolio & Product Life Cycle Managementsbryant89
As product pipelines become thinner, and pressure to get the most out of dwindling resources increases, pharmaceutical portfolio and product lifecycle management becomes an imperative part of a company’s approach to maximizing ROI. Not only must managers carefully strategize in relation to the product’s strengths against competitors and also in such a way to compliment the overall company portfolio, but they must also balance the crucial factors of regulatory change in patent protection, risk mitigation, effective R&D resource allocation in order to achieve an integrated approach to effective portfolio and PLCM.
Now in its 6th year, SMi Groups Pharmaceutical Portfolio & Product Life-Cycle Management is a well established meeting ground for such managers and directors who are faced with the task of managing the pipeline in a way that acknowledges the above mentioned factors and more. In the close up environment that our conferences provide, you can expect to discuss with some of the leading professionals in the field the best way to approach this difficult task. In a showcase of effective approaches from many of the largest pharmaceutical companies, you can be sure to learn much of value to yourself, and to your organization.
This study is designed to help brand and marketing leaders identify winning lifecycle management (LCM) strategies they can use to extend the commercial life of bio-pharmaceutical products. The study examines ROI and future viability of 20 different LCM strategies. In addition, the research provides insights into which strategies will survive as they are faced with a changing pharmaceutical environment.
International Pharmaceutical Industry: Feasibility Is Not (Anymore) A Plain S...KCR
Investigational Sites
The sole term ‘feasibility’ has multiple definitions in a clinical environment, leading to certain bias with all stakeholders involved, including pharma companies (sponsors) and all types of contract research organizations (CROs). The most common perception is related to a never-ending argument between pharma outsourcing departments and CRO commercial groups, with sponsors expecting CROs to run a (non-defined) feasibility study prior to proposal submission and CROs undertaking a series of schematic actions to create an impression of fulfilled expectation.
Inventory Optimization - A New Approach to Operational Inventory PlanningSAP Solution Extensions
In today’s ultracompetitive business environment, companies can ill afford supply chain inefficiencies. But if planners are using outdated inventory management models, it can be challenging to run a tight ship.
To boost efficiency, run leaner, and drive down supply costs, many organizations are exploring inventory optimization. This technique improves inventory targets to address the realities of today’s complex, ever-evolving global supply chains.
This paper examines how the stochastic multistage, multi-inventory model supports inventory optimization. It also looks at how the SAP® Enterprise Inventory Optimization application by SmartOps uses the model to help supply planners execute more effectively. The software enables a collaborative approach that extends beyond organizational boundaries while helping planners predict demand patterns more accurately. And an option that provides analytics for the application delivers executive-level insights and reporting using a focused dashboard.
As pharmaceutical and biopharmaceutical companies increase their levels of external development and manufacturing, the need for unbiased information to support strategic business decisions continues to grow. In this report, ISR provides pharmaceutical companies and contract manufacturers a comprehensive analysis of current outsourcing trends and practices, in addition to a quantitative analysis of CMO service quality across a series of 26 performance attributes specific to drug product manufacturing projects. In this Consumer Reports-style analysis, ISR presents data on 423 service encounters from 217 respondents who have been involved in outsourced fill finish projects in the past 18 months.
Why LED Lights Are Great For Indoor And Outdoor Use?David Stoffel
There’s nothing quite like LEDs when you want perfection at low running cost. Here’s your way to save energy, and money as you take the greener option for better homes and better electricity.To know more, visit:http://electronics.wesrch.com/
Project Server in the Oil and Gas Industry - Enabling Technologies Best Pract...EPC Group
EPC Group's - Project Server in the Oil and Gas Industry - Enabling Technologies Best Practices - Covering EPC Group's Project Server Implementation Strategies
Using the Analytic Hierarchy Process (AHP) to Select and Prioritize Project...Ricardo Viana Vargas
The objective of this paper is to present, discuss and apply the principles and techniques of the Analytic Hierarchy Process (AHP) in the prioritization and selection of projects in a portfolio. AHP is one of the main mathematical models currently available to support the decision theory.
One in six projects is a ‘black swan’, or a project that if it goes badly it could threaten corporate financial stability. Now more than ever, companies must critically examine their project portfolio management processes for optimizing success. This strategy brief discusses how WGroup has helped numerous clients design, build, and manage the discipline of project portoflio management. Also shares the common pitfalls WGroup has seen in their experience.
Demand Forecasting, undeniably, is the single most
important component of any organizations Supply Chain. It
determines the estimated demand for the future and sets the level
of preparedness that is required on the supply side to match the
demand. It goes without saying that if an organization doesnt get
its forecasting accurate to a reasonable level, the whole supply
chain gets affected. Understandably, Over/Under forecasting has
deteriorating impact on any organizations Supply Chain and
thereby on P and L. Having ascertained the importance of De-
mand Forecasting, it is only fair to discuss about the forecasting
techniques which are used to predict the future values of demand.
The input that goes in and the modeling engine which it goes
through are equally important in generating the correct forecasts
and determining the Forecast Accuracy. Here, we present a very
unique model that not only pre-processes the input data, but
also ensembles the output of two parallel advanced forecasting
engines which uses state-of-the-art Machine Learning algorithms
and Time-Series algorithms to generate future forecasts. Our
technique uses data-driven statistical techniques to clean the data
of any potential errors or outliers and impute missing values if
any. Once the forecast is generated, it is post processed with
Seasonality and Trend corrections, if required.Since the final
forecast is the result of statistically pre-validated ensemble of
multiple models, the forecasts are stable and accuracy variation
is very minimal across periods and forecast horizons. Hence it
is better at estimating the future demand than the conventional
techniques.
Quant Labs, the research division of Quant Foundry has developed an operational risk model that supports the COO to pin point areas of process weaknesses. The model continuously learns the business operating model and enables the COO to target investment under different strategic scenarios.
The quest to define IT’s relationship with the business has gained new momentum over the last few years, primarily due to a more difficult economic climate driving the need for transparency in spending decisions. The momentum is manifested in a fundamental awareness, developed since the technology hype of the late 90’s, that IT organizations must be integrated more closely with the businesses they support. Management teams in many organizations are focused on defining a better Business-Technology partnership, which is shining the spotlight on a new discipline -- Project Portfolio Management (PPM).
Customerlogo hereProject Name Project CharterCompanyOllieShoresna
Customer
logo here
Project Name: Project Charter
Company
logo here
Project Name:
Value Driven Project and Portfolio Management in the Pharmaceutical Industry
Project Charter
Project:
Value Driven Project and Portfolio Management in the Pharmaceutical Industry
Title:
Project Charter
Document number:
Version
0.1
Document status:
Final
Author:
Chellyn Jones
Responsible:
Date created:
14/08/2021
Protection class:
"For internal use only"
Document history
Version
Date
Author
Comment/Change
0.1
10/08/2021
Draft
14/08/2021
Final
Page
1Background/Project purpose or justification4
2Goals5
2.1Goals
2.2Scheduling goals/milestones
3Project product description6
4Delivery units7
4.1Delivery units/services
5Project success criteria8
6High-level risks9
7Key stakeholders10
8Assumptions, restrictions and external dependencies11
9Responsibility of the customer12
9.1Tasks
9.2Resources and staffing
10Project category13
11Project budget (overview)14
12Project startup15
13Project end16
13.1Signatures for release
Annex17
A.Glossary and abbreviations17
B.References, accompanying documents
1.
Background/Project Purpose or Justification
Pharmaceuticals' perspective has shifted as a result of the rising healthcare expenses that are currently affecting everyone, and pharmaceuticals are focusing on the generation of value in research and development. Value-driven portfolio management is a term that has long been associated with the financial sector but has recently gained popularity in the pharmaceutical industry. The notion of value-driven portfolio management focuses on connecting a company's strategic goals and objectives with resource allocation. A corporation can raise the value of pharmaceuticals while also lowering healthcare expenses by focusing on studying the risks and effects.
The project's purpose is to create a value-driven project for the pharmaceutical company by following a set of decision-making stages. The steps will include developing a targeted product profile, defining a timeframe, developing a budget that is consistent with the goal product profile, and ultimately developing a stage gate decision-making system.
2. Goals
This section addresses the goals of the project which indicate what the project intends to achieve and the milestones related to the goals established.
a. Goals
Goal
Description
Efficiency
Efficiency in the drug development process will mean that pharmaceuticals develop drugs through maximum utilization of the resources and ensuring that the waste products from the process are as minimal as possible.
Strategic alignment
The goal is to come up with projects that are aligned with financial and strategic goals of pharmaceuticals.
b. Scheduling Goals/Milestones
Schedule
Description
Phase 1
· Defining the scope and the budgets for the projects
· Developing the goals of the project.
· Evaluation of the potential risks
Phase 2
· Coming up with the key performance indicators
· Tracking per ...
Embracing Change - The Impact of Generative AI on Strategic Portfolio ManagementOnePlan Solutions
The rapid emergence of Generative AI (GenAI) presents a transformative challenge and opportunity for strategic portfolio leaders. This webinar delves into how GenAI is reshaping the landscape of strategic planning and execution. As GenAI technology infiltrates the workplace, it introduces substantial knowledge and skills gaps that can hinder the efficiency of strategic portfolio management (SPM) if not promptly addressed.
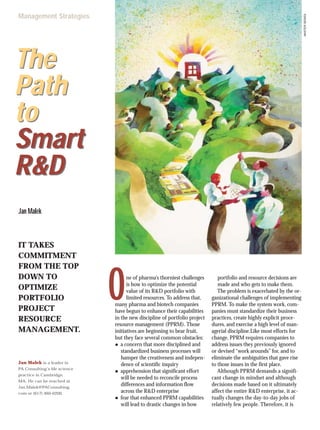
1. ne of pharma’s thorniest challenges
is how to optimize the potential
value of its R&D portfolio with
limited resources. To address that,
many pharma and biotech companies
have begun to enhance their capabilities
in the new discipline of portfolio project
resource management (PPRM). Those
initiatives are beginning to bear fruit,
but they face several common obstacles:
● a concern that more disciplined and
standardized business processes will
hamper the creativeness and indepen-
dence of scientific inquiry
● apprehension that significant effort
will be needed to reconcile process
differences and information flow
across the R&D enterprise
● fear that enhanced PPRM capabilities
will lead to drastic changes in how
portfolio and resource decisions are
made and who gets to make them.
The problem is exacerbated by the or-
ganizational challenges of implementing
PPRM. To make the system work, com-
panies must standardize their business
practices, create highly explicit proce-
dures, and exercise a high level of man-
agerial discipline.Like most efforts for
change, PPRM requires companies to
address issues they previously ignored
or devised “work arounds” for, and to
eliminate the ambiguities that gave rise
to those issues in the first place.
Although PPRM demands a signifi-
cant change in mindset and although
decisions made based on it ultimately
affect the entire R&D enterprise, it ac-
tually changes the day-to-day jobs of
relatively few people. Therefore, it is
The
Path
to
Smart
R&D
The
Path
to
Smart
R&D
Jan Malek
Jan Malek is a leader in
PA Consulting’s life science
practice in Cambridge,
MA. He can be reached at
Jan.Malek@PAConsulting.
com or (617) 460-0200.
O MASTERSERIES
Management Strategies
IT TAKES
COMMITMENT
FROM THE TOP
DOWN TO
OPTIMIZE
PORTFOLIO
PROJECT
RESOURCE
MANAGEMENT.
2. possible for companies to implement
robust PPRM capabilities without neg-
atively affecting the science or disrupt-
ing the organization.
This article explores some of the
major issues that pharma and biotech
companies may encounter in imple-
menting PPRM and suggests how
management can make it succeed.
Maximizing Value
Most pharma R&D organizations oper-
ate within the confines of a fixed annual
budget—largely determined by the num-
ber of people they employ—but they lack
the ability to forecast the quantity of re-
sources required to develop compounds
in an optimal manner. Unwilling to regu-
larly prune their portfolios, other than
through natural attrition, they often
wind up fragmenting their resources
across a large number of projects.
Moreover, in the absence of company-
wide decisions to set priorities, depart-
ment and functional heads make de facto
portfolio prioritization decisions by allo-
cating staff to projects. That approach
has two significant drawbacks: it allows
inconsistent resource allocation decisions
and diminishes senior management’s
stewardship of the R&D portfolio.
PPRM enables companies to maxi-
mize the value of their pipeline portfo-
lios within budgetary and resource con-
straints. But to do that, they must make
consistent go/no-go, resource allocation,
and project-timeline decisions based on
the best available information about the
risks, costs, and commercial potential of
the compounds in the pipeline.
All that is not easy. Companies must
have a core set of capabilities, including
● up-to-date, standardized plans for all
active projects
● estimates of the human and key
non-human resources required to
complete each project
● availability of human and key non-
human resources
● priority rankings of all active projects,
from highest to lowest
● “probability of success” estimates at
key decision points and for each pro-
ject as a whole.
Standardized project plans. These are
the backbone of pipeline management.
They establish interdependencies be-
tween R&D activities and functions and
provide the basis for estimating resource
requirements. To create them, the com-
pany must agree on standard project
templates that include major activities,
milestones, decision points, and interde-
pendencies for the full project lifecycle,
from early discovery to product launch.
When developing templates, R&D
managers must decide on the level of
detail to include in these plans to meet
the needs of the various constituencies.
They also need to decide whether to use
single- or multi-level plans, keeping in
mind that, once developed, the plans
must be updated regularly to reflect the
latest project status and the team’s latest
thinking. Developing project templates
and maintaining project plans require
significant effort and extensive collabo-
ration between the different functions.
Ability to estimate the resources needed
to complete all projects. Companies can
use standardized algorithms to estimate
resource demand by resource type
based on the project assumptions and
deliverables—such as the development
of a trials protocol or completion of a
study report—defined in the project
plans. The departments that will do the
work need to be intimately involved in
developing these resource algorithms.
They also need to review, and when
necessary adjust, the resource estimates
that the algorithms generate for each
project to correct for subtle variations
between projects that the formulas may
not take into account.
Thus, both the PPRM process and the
The Path to Smart R&D
Graphic
I
F
= Phase III
= Phase II
Circle size =
Relative
Market
Attractiveness
100
50
0
Safety Profile
Development Portfolio Profile
Compound Ratings and Decisions
Scale 1 (low) – 100 (high)
A
B
C
J
H
E
D
EfficacyProfile
Compound
Rationale
Safety
Manufacture
Market
Probabilistic
Resource
Requirement
Average
Score
(Equally
weighted)
Strategy
0 50 100
A 85 85 70 80 80 35 Highest priority,
accelerate
B 80 55 75 50 65 40 Continue
investment
C 55 60 40 60 54 60 On hold – Find
a partner
D 70 30 40 50 48 55 Continue
investment
E 35 75 50 30 44 50 Discontinue
F 50 40 55 60 51 45 Continue
investment
G 40 45 40 40 41 50 Continue
investment
H 30 50 20 30 32 40 Discontinue
I 35 45 15 35 32 65 Discontinue
J 30 30 30 50 35 50 Discontinue
G
GO/NO-GO DECISIONS
A compound rating approach that uses standard scales highlights the relative
merits of each compound and enables managers to consistently prioritize and
allocate resources.
Source: Jan Malek
In theory,
implementing
a comprehensive
set of PPRM
capabilities is
straightforward.
In reality, it is
anything but.
3. system should allow for manual over-
ride of the algorithmic resource esti-
mates but retain both sets of data for
comparative purposes. The resource es-
timation formulas, which initially will
be based on judgment more than em-
pirical data, should be refined, over
time, based on analyses of actual re-
source consumption. As that happens,
the magnitude of the manual resource
adjustments should decline.
Ability to rank projects in order of priority.
To prioritize projects, companies must
consider complex scientific and com-
mercial variables, including scientific
rationale, compound characteristics,
manufacturing complexity, R&D com-
plexity, and sales potential. To be able to
rank projects in different therapeutic
categories (TCs) and in different stages
of development in a consistent manner,
pharma companies need standard evalu-
ation criteria, rating scales, and processes
to regularly evaluate programs at all
milestones and decision points. (See
“Go/No-GoDecisions”.) Questions that
companies should ask in the course of
those assessments include:
● How well do we understand what
happens at the drug target site and
why does it result in a specific med-
ical condition?
● How strongly is the target correlated
with the disease?
● Have similar compounds made it
into human trials?
● Have they obtained marketing
approval?
● How many people suffer from the
disease?
● How many people could this drug
help?
● Will this product be better than exist-
ing or emerging therapies and, if so,
how and by how much?
● How complex is the manufacturing
process?
● Are the raw materials readily available
at reasonable prices?
The answers to those and similar
questions will provide consistent data
that enable managers to evaluate and
prioritize all projects.
To evaluate an R&D program requires
a high degree of judgment; as a result,
program assessment cannot be mecha-
nistic. Rather, it must be the result of a
dialogue among project teams, func-
tional leaders, and senior R&D man-
agers. Yet, the use of a consistent rating
methodology, data collection process,
and analysis across all programs will
greatly improve the quality of the dis-
cussion and the ensuing decisions.
R&D organizations have tradition-
ally found it difficult to take resources
away from low-priority projects that
hold some scientific promise. In fact, it
is not uncommon for them to allocate
some resources for every feasible pro-
ject rather than to concentrate re-
sources on the highest priority ones,
thus dooming all projects to move at a
suboptimal pace. To improve the man-
agement of the R&D pipeline, man-
agers need to make difficult decisions
that will maximize the value of their
portfolios. That will also enable them
to define how risky the portfolio is and
ensure that it is aligned with the com-
pany’s financial strategy. (See “How
Risky is Your Portfolio?”)
By aggregating the resource estimates
for all projects, adjusted according to
their probability of success, companies
can quantify total expected resource
demand by time frame and resource
type. Comparing needed resources
with the company’s actual resources
will reveal the “static” demand–supply
balance and identify current and ex-
pected resource bottlenecks. (See
The Path to Smart R&D
Graphic
1,600
1,200
800
400
0
Medium risk High risk
Low risk Medium risk
Discovery Portfolio Profile
Compounds A–G
Proven/Precedented Speculative/Unprecedented
Mechanism of Action
Distribution of Expected Portfolio Revenues
Compounds A–G
Novel
Chemical
entity
Proven
A
C
B
D
E
F
G
US$(millions)
2006 2007 2008 2009 2010
90th percentile
Mean
50th percentile
10th
percentile
HOW RISKY IS YOUR PORTFOLIO?
To balance their portfolios, R&D organizations need to regularly assess their risk profile
and estimate the portfolio’s revenue potential. There are several ways to do that, but it
is important that they make resource allocation decisions that are consistent with their
business strategies. The “Discovery Portfolio Profile” shows how companies can map
their portfolios based on how much they know about the targets and compounds.
The upper right quadrant, where novel compounds flirt with unprecedented targets,
shows where breakthrough therapies are born. Given the greater risk of failure, the
potential rewards must be correspondingly higher to make those efforts worthwhile.
The bottom left quadrant is where lower-risk/lower-reward line extensions reside. A
well balanced R&D portfolio, like a well balanced stock portfolio, will have compounds
in each quadrant. The question that will determine how many resources the company
will allocate to each quadrant is “How much risk are we willing and able to tolerate?”
The portfolio shown here reflects the “bet the farm” strategy of a company that was
pursuing novel approaches to find high-market-potential drugs for previously uncured
diseases. The graph on the right represents the portfolio’s annual revenues under dif-
ferent scenarios and their respective probabilities of occurring. That is reflected in the
revenue projections, which were generated using Monte Carlo simulation and which
show how low—10 percent—the probability of achieving annual revenue in excess of
$1 billion is. To align its financial and R&D strategies, the company determined that it
needed to find backers to fund the portfolio and absorb some of the risk.
Source: Jan Malek
4. The Path to Smart R&D
“Where are the Bottlenecks?”) Based on
that insight, the portfolio group will be
able—manually or with optimization
software—to sequence project activities
so as to minimize bottlenecks and opti-
mize aggregate pipeline output. (See
“The Great Data Roundup.”)
Although maximizing pipeline out-
put is a good thing, it is not the same as
maximizing the portfolio’s expected
value. Doing that requires sophisticated
portfolio simulation capabilities based
on well defined relationships between
the level of project resources and time
to market, as well as between the timing
of product launch—relative to compet-
ing products—and lifecycle product
revenues, in addition to knowledge of
the resource constraints across the com-
pany’s entire R&D value chain.
Integration. It is critical that PPRM
be tightly integrated with stage-gates—
predetermined hurdles that projects
must meet before being allowed to con-
tinue—that pharma companies use to
control projects. Stage-gate keepers
need the PPRM information and ana-
lytical capabilities to make informed
decisions. They need to clearly under-
stand the resource supply–demand im-
plications of their decisions and have
ready access to project attributes and
project priority rankings.
Some R&D organizations that imple-
mented PPRM have concluded that
they needed to redesign their stage-
gate processes to align them with the
PPRM-based management approach.
Companies that have failed to symbiot-
ically link stage-gate reviews, resource
management, and portfolio manage-
ment have frustrated project teams and
executives alike by duplicating the in-
formation collection, review, and deci-
sion making processes.
Some sophisticated companies have
combined those processes by using
“workflow” software for stage-gate sub-
missions and a single database to sup-
port the stage-gate process, resource
management, portfolio management,
and other related capabilities. Stage-
gate governance bodies are an impor-
tant component of PPRM-based R&D
management and need to be included
in the design and implementation ac-
tivities from the outset.
Setting the Course
To bridge the gap between their current
and desired PPRM capabilities, pharma
companies need to carefully define
their multi-year, multi-stage deploy-
ment plans. Those plans will be based
Probability
of success
(POS)
Program
Prioritization
Criteria
Internal
Resource
Supply
(Human and
non-human)
R&D Budget
(includes
outsourcing)
Resource/timeline
Trade-off Factors
• Internal
Portfolio Profile
• Risk–reward profile
• Probabilistic
revenue projections
• Probabilistic
portfolio valuation
(NPV, option)
Output Optimization
• Resource allocation
• Project timelimes
Portfolio Optimization
• Portfolio composition
• Resource allocation/
project timelines
Commercial Factors
• Market potential
• Competitive
dynamics
Programs/Projects
Project Attributes
Project Plans
Project Resource
Estimates
Graphic
THE GREAT DATA ROUNDUP
To optimize portfolio value and pipeline output, companies must collect a consistent
set of data across all compounds.
Source: Jan Malek
Graphic
120
100
80
60
40
20
0
Capacity Utilization
By function and project — 9/03–3/04Project Plans
%ofavailablecapacity
M
onitoring
DataM
anagem
ent
M
edicalAffairs
BiostatsRegulatory
Project J
Project H
Project I
Project G
Project F
Project E
Project D
Project C
Project B
Project A
WHERE ARE THE BOTTLENECKS?
By understanding the resource supply–demand relationship in advance, managers
can maximize output by reducing demand, increasing supply, or both.
Source:: Jan Malek
5. The Path to Smart R&D
on each company’s specific needs, capa-
bilities, and ability to absorb change.
First, the company must decide on the
scope of the effort, taking into consid-
eration the company’s purpose in using
PPRM, its organizational reach, and the
specific needs of the different functions.
Users. Next, the company needs to
clarify who will use the PPRM system.
Is it employing PPRM to give senior
management a strategic view of re-
sources and the portfolio, to make it
part of the project teams’ everyday
management activities, or both? Those
alternatives imply vastly different
PPRM capabilities as well as a need for
different levels of effort and complex-
ity. They also raise different organiza-
tional issues.
Organizations. There are important
differences in the business process
characteristics of the main areas of
R&D: discovery, pre-clinical, pharma-
cology, full development, and pilot
plant. Those differences manifest
themselves in the number and size
of projects, scheduling predictability,
complexity defined as the number
of interdependencies and diversity of
skills required, and project duration,
to name a few.
Such differences in business charac-
teristics naturally lead to differences in
PPRM requirements. For instance, dis-
covery may primarily need to monitor
and manage resources that are chroni-
cally overburdened, such as high-
throughput screening and computa-
tional chemistry. Pre-clinical functions
may derive the greatest benefits from
the ability to assign specific resources,
such as labs and animals, to specific
studies. Development may need the
ability to identify functional areas in
which resource constraints are most
likely to occur.
As companies plan their PPRM
strategy, they need to take those differ-
ences into account, while ensuring that
a core set of capabilities is available
across the entire R&D enterprise. At
the same time, R&D organizations
must take care not to create unneces-
sary complexity by extending PPRM
capabilities to units and functions that
don’t need them. For example, it may
be essential for the toxicology group to
assign specific resources to individual
studies, but using that capability to
manage a small medical writing group
could create unnecessary complexity.
Width and depth. To ensure that they
deploy PPRM systematically, pharma
companies should plan along two di-
mensions: specific capabilities and the
sophistication level of each. It is also
important to realize that not all com-
panies require the full suite of PPRM
capabilities, nor do they need to reach
the advanced stage of those they
choose to implement. The choice will
depend on the portfolio’s size and
complexity as well as on the level of
resources that the company is willing
to dedicate to the PPRM effort.
In doing so, they need to take into
account the inherent interdependency
between different PPRM capabilities.
For instance, parametric resource esti-
mation presupposes the existence of
standardized project plans, and static
resource supply and demand balancing
requires probability-adjusted resource
estimates and resource supply infor-
mation. Thus, even sophisticated com-
panies must carefully map out internal
dependencies and build capabilities
sequentially. Integration with other
systems that contain important data
is another piece of the puzzle that
companies must incorporate into their
implementation plans.
Toward Transformation
In theory, implementing a comprehen-
sive set of PPRM capabilities is quite
straightforward. In reality it is anything
but. The challenge lies in enrolling the
entire R&D organization in the effort
and in making many detailed decisions
in a timely and consistent manner.
Every company operates in a state of
equilibrium based on a combination of
explicit and implicit agreements about
a gamut of issues, including
● who has access to what information
Program Office
Resource Estimation
Project Planning/
Management
Portfolio Management
• Develop and maintain
project planning templates
• Develop and maintain
project plans
• Track, address, and flag
project issues
• Develop and maintain
resource estimation
algorithms
• Develop resource
estimates for all projects
• Maintain resource
availability information
• Simulate/optimize portfolio
• Perform risk–reward
analysis
• Provide decision support
• Develop prioritization
criteria
Shared
Database
Project
planning/
management
tools
Resource
estimation tools
Portfolio
management,
decision-support
tools
Graphic
UNDER ONE UMBRELLA
Effective management of R&D portfolios requires an integrated organization to
collect and analyze a comprehensive and consistent set of compound information.
Source: Jan Melek