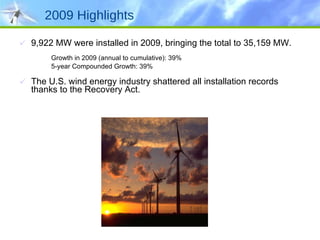
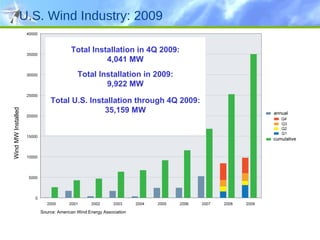
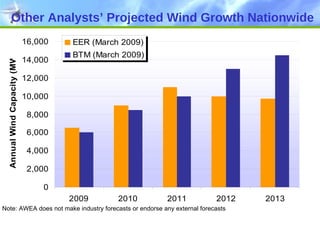
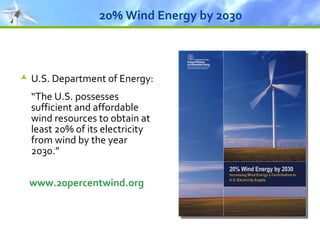
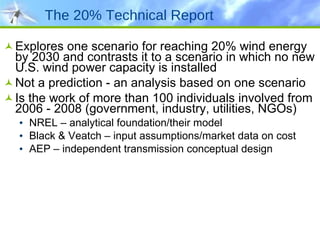
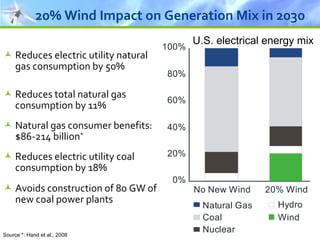
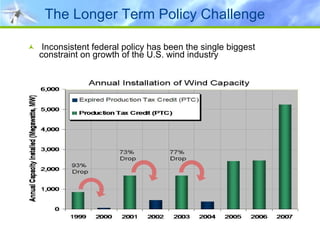
The Wind Industry: Past, Present, Future  Randall Swisher Power Test   Conference February 15, 2010
The Past: A Brief History of the Wind Industry
Growing a New Industry A complex mix of technology, policy and business/economics must all work together
In the Beginning:  A Vision
The context:  1973 was the first Arab oil embargo “ It would not be foolish at all to state that this country could be totally energized by solar energy and other renewable processes by the year 2000.”  - William Heronemus, 1973, before a U.S. Senate subcommittee Heronemus founded the UMass alternative energy engineering program, was a pioneer of the wind farm concept and offshore wind power His vision:  300,000 wind turbines on the Great Plains providing 10-15% of the nation’s electricity In the Beginning:  A Vision
Late 70’s Policy Provided a Foundation Federal Wind R&D Program Public Utility Regulatory Policies Act of 1978 (PURPA) Requires utilities to buy electricity from renewable and cogeneration facilities Energy Tax Act of 1978 Creates 15% Energy Investment Tax Credit (EITC) Added to existing 10% ITC Limited Partnership Structure -> Wind Farms California policy Tax incentives Strong regulatory support Standard offer contracts
In the 1980s, the U.S. led the World in Wind Technology The first successful windfarms were established in 1981 in California Many U.S. turbine manufacturers were established in the early 80s By 1989, the U.S. was home to 85% of the world’s installed wind capacity – almost all in California – and a leading manufacturer: US Windpower (founded in 1976)
But Turning Vision to Reality was Tough Harnessing the wind was tougher than it looks First California Wind Farms – 1981 Poor performance - very low capacity factors But provided a successful laboratory – some turbines worked, some didn’t Building strong companies was a challenge – Engineering Business acumen Access to capital Knowledge of the utility industry
We Turned our Backs on the Opportunity The DOE Wind R&D budget was cut 90% through the 1980s The wind investment tax credit was abruptly ended in 1986 Most U.S. turbine manufacturers went out of business In 1989, the domestic wind market was lifeless . . . And seven years later US Windpower was bankrupt
Europe Took the Lead in the 1990s Strong market incentives in Denmark, Germany and Spain led to a thriving turbine manufacturing industry Germany was the largest single market until 2008 This European leadership made possible wind’s current competitiveness
Today, the Global Industry has Three Key Markets Europe – 76,000 MW (end of 2009) Most manufacturers based in Europe North America – 38,500 MW The U.S. is now the largest single market, and all major global companies want to participate Asia – 39,000 MW Chinese market growing most quickly, and establishing a strong manufacturing base
The U.S. Wind Industry in 2010
U.S. is World Leader in Wind Power With over 35,OOO MW, the U.S. is now the #1 wind energy producer in the world
2009 Highlights 9,922 MW were installed in 2009, bringing the total to 35,159 MW. Growth in 2009 (annual to cumulative): 39% 5-year Compounded Growth: 39% The U.S. wind energy industry shattered all installation records thanks to the Recovery Act.
U.S. Wind Industry: 2009 Wind MW Installed Total Installation in 4Q 2009: 4,041 MW Total Installation in 2009: 9,922 MW Total U.S. Installation through 4Q 2009: 35,159 MW Source: American Wind Energy Association
Top Ten States in 2009 Source: American Wind Energy Association
State by State Installations (MW) Source: American Wind Energy Association
Market Players: Turbine Manufacturers Turbines Installed in 2009:  Acciona WP  Clipper  DeWind  Fuhrlander  Gamesa  GE Energy  Mitsubishi  Nordex  REpower  Siemens  Suzlon  Vestas
Manufacturers’ Share of Installed Capacity Share of 2008 2008 Installations by WTG Mfgr
U.S. Wind Manufacturing  Source: AWEA, updated through 4Q 2009 Major facilities online prior to 2008 All new online in 2008 - 2009 Announced facilities
300,000 MW of Proposed Wind in Interconnection Queues
Wind Power in Queues (MW) Iowa 14,569 Minnesota 20,011 New Mexico 14,136 North  Dakota 11,493 Penn. 3,391 South  Dakota 30,112 Oklahoma 14,677 Illinois 16,284 Ohio 3,683 Kansas 13,191 Wisconsin 908 Michigan 2,518 WV 1,045 New York 8,000 VT 155 Total 311,155 MW MA 492 Montana 2327 NJ 1416 Under 1000 MW  1,000 MW-8,000 MW Over 8,000 MW Missouri 2,050 Indiana 8,426 Maine 1,398 NH 396 RI 347 DE 450 MD 810 VA 820 Arkansas 210 Texas 63,504 Arizona 7,268 California 18,629 Colorado 16,602 Idaho 446 Nebraska 3,726 Nevada 3,913 Oregon 9,361 Utah 1,052 Washington 5,831 Wyoming 7,870
Note: AWEA does not make industry forecasts or endorse any external forecasts Other Analysts’ Projected Wind Growth Nationwide
Wind’s Long-term Potential
20% Wind Energy by 2030 U.S. Department of Energy:  “ The U.S. possesses sufficient and affordable wind resources to obtain at least 20% of its electricity from wind by the year 2030.” www.20percentwind.org
The 20% Technical Report Explores one scenario for reaching 20% wind energy by 2030 and contrasts it to a scenario in which no new U.S. wind power capacity is installed Not a prediction - an analysis based on one scenario Is the work of more than 100 individuals involved from 2006 - 2008 (government, industry, utilities, NGOs) NREL – analytical foundation/their model Black & Veatch – input assumptions/market data on cost AEP – independent transmission conceptual design
The 20% Wind Energy Scenario U.S. electricity consumption grows 39% from 2005 to 2030 – to 5.8 billion MWh (Source: EIA) 20% wind electricity requires about 300 GW (300,000 MW) of wind generation No technology breakthroughs required:  20% wind can be achieved with existing wind technology Technology will continue to improve: Productivity of wind turbines increases about 15% by 2030 This is an  extremely  conservative assumption
20% Wind Energy by 2030 Installed Capacity at year end 2009 is greater than 35 GW;  3 years ahead of schedule 305 GW
20% Wind:  Electricity Sector Costs Both scenarios cost over $2 trillion in new investment in net present value terms by 2030 Incremental economic costs reflect: Capital costs of wind projects relative to other projects Incremental transmission investment 20% Wind Scenario requires only 2% more  investment ($43 billion in net present value)
Savings from Reduced Natural Gas Price Pressure   The benefits from reduced pressure on natural gas prices across all gas users would be $150 billion (NPV), by itself exceeding the incremental cost of investing in the 20% Wind Scenario. *NPV  Source: Hand et al., 2008 Billions of Dollars* 0 20 40 60 80 100 120 140 160 Incremental C ost  Natural Gas  Savings
20% Wind Impact on Generation Mix in 2030 Reduces electric utility natural gas consumption by 50% Reduces total natural gas consumption by 11% Natural gas consumer benefits: $86-214 billion * Reduces electric utility coal consumption by 18%  Avoids construction of 80 GW of new coal power plants U.S. electrical energy mix Source *: Hand et al., 2008
Challenges to Achieving Wind’s Potential
Key Barriers to Achieving 20% Wind Need for long-term stable federal policy Need for transmission infrastructure Need to reshape the electric system to manage that percentage of a variable resource
The Longer Term Policy Challenge Inconsistent federal policy has been the single biggest constraint on growth of the U.S. wind industry
Need a stable long-term federal policy Long-term federal production tax credit (PTC) Federal renewable energy standard (RES) Climate policy that puts a price on carbon Long-term Policy Options
A Federal RPS Means Stable Policy AWEA Developed RPS Concept in mid-90s We needed a new policy vehicle PURPA was not effective RPS compatible with wind’s growing cost-competitiveness, more competitive electric industry States embraced the RPS concept 28 states have adopted A Federal RPS will likely be a central component of this summer’s energy legislation
Barrier 3:  Transmission Infrastructure The lack of transmission infrastructure is the single greatest long-term strategic constraint facing the wind industry. There is a growing recognition of this barrier by policymakers National Clean Energy Summit
20% Wind:  Transmission Challenges Enhancement of electrical transmission system required in all electricity-growth scenarios Transmission is needed to: Relieve congestion in existing system Improve system reliability for all customers Increase access to lower-cost energy Access new and remote generation resources  Wind requires more transmission than some other options as best winds are often in remote locations Over 300,000 MW of wind lined up in interconnection queues Growing action to build transmission But only 33,000 MW of transmission capacity planned to come on line in next five years
Getting our Huge Wind Resource to Market The solution is clear, but will take time to achieve:  Green Power Superhighways: National electricity transmission “superhighways” to add reliability to our electricity supply and bring vast amounts of wind and other renewable energy to market.  Key Issues: Regional Planning – interconnection-wide Siting Cost Allocation – regional Coordinated regional grid operations Model: FERC gas pipeline authority
Transmission  States leading the way on proactive transmission planning: Texas (CREZ) $4.9 billion in transmission investments to major wind resource areas $2.4 billion ANNUALLY in reduced fuel costs (ERCOT estimate) Provides a model for other states and the nation
AEP’s Conceptual Transmission Plan to  Accommodate 400 GW of Wind Energy
Managing Wind’s Variability
Wind is an energy resource, not a capacity resource  Wind Power output is “variable” not “intermittent” There is a cost to managing wind’s variability That cost depends upon system characteristics, but is generally low Wind Integration
Lessons Learned about Wind Integration Wind forecasting can significantly reduce integration costs by reducing uncertainty Wind resources spread over larger areas are less variable Diverse wind has very little variability on the minute-to-minute time scale Wind is easier to integrate on more flexible power systems  Market/system operation reforms, such as control area consolidation, can significantly reduce wind integration costs, as can coordinated regional operations A robust transmission grid can significantly reduce integration costs Integrating wind is a cost issue, not a reliability issue
The fact that wind is not dispatchable does not mean that it makes economic sense to add storage to back up specific wind units Storage should be viewed as a system resource and should be evaluated on that basis.  Generally there will be more cost-effective ways to add needed system flexibility than by adding storage technologies. No Study or Report shows that new storage is needed to achieve 20% energy production from wind energy Wind Power & Energy Storage
Xcel Study Regarding Wind Integration Costs In the Xcel analysis, wind integration costs are:  $3.51 per MWh in the 10% wind penetration scenario  $4.77 per MWh in the 15% scenario  $5.13 per MWh in the 20% wind scenario
Summary and Conclusion
The Way Forward The wind market has been one of the fastest growing segments of the economy over the past five years – an average annual growth rate of 32% This growth was achieved despite lack of stable, consistent federal policy support. The wind industry, similar to every other sector of the economy, has been hurt by the financial crisis.  The wind industry is a capital-intensive industry  The PTC is a key component of financing projects, and tax equity has been dramatically reduced by the crisis. Federal and state policy makers view wind and other renewables as key to our energy future and a foundation for job creation.  A number of important policies were included in the economic stimulus bill.  More pro-wind policies will be coming in the new energy bill. The industry is well situated strategically.  Given growing concern about climate change, fossil fuel price volatility, national energy security, and the need to grow domestic jobs and economic development, the wind industry should see double digit growth for decades to come. If you want to be a part of this growing market, join AWEA and come to WINDPOWER 2010 (Dallas, May 23-26).
Further Information American Wind Energy Association www.AWEA.org [email_address] 1501 M Street NW, Suite 1000 Washington, DC 20005

Power Test Conference

  • 1.
    The Wind Industry:Past, Present, Future Randall Swisher Power Test Conference February 15, 2010
  • 2.
    The Past: ABrief History of the Wind Industry
  • 3.
    Growing a NewIndustry A complex mix of technology, policy and business/economics must all work together
  • 4.
  • 5.
    The context: 1973 was the first Arab oil embargo “ It would not be foolish at all to state that this country could be totally energized by solar energy and other renewable processes by the year 2000.” - William Heronemus, 1973, before a U.S. Senate subcommittee Heronemus founded the UMass alternative energy engineering program, was a pioneer of the wind farm concept and offshore wind power His vision: 300,000 wind turbines on the Great Plains providing 10-15% of the nation’s electricity In the Beginning: A Vision
  • 6.
    Late 70’s PolicyProvided a Foundation Federal Wind R&D Program Public Utility Regulatory Policies Act of 1978 (PURPA) Requires utilities to buy electricity from renewable and cogeneration facilities Energy Tax Act of 1978 Creates 15% Energy Investment Tax Credit (EITC) Added to existing 10% ITC Limited Partnership Structure -> Wind Farms California policy Tax incentives Strong regulatory support Standard offer contracts
  • 7.
    In the 1980s,the U.S. led the World in Wind Technology The first successful windfarms were established in 1981 in California Many U.S. turbine manufacturers were established in the early 80s By 1989, the U.S. was home to 85% of the world’s installed wind capacity – almost all in California – and a leading manufacturer: US Windpower (founded in 1976)
  • 8.
    But Turning Visionto Reality was Tough Harnessing the wind was tougher than it looks First California Wind Farms – 1981 Poor performance - very low capacity factors But provided a successful laboratory – some turbines worked, some didn’t Building strong companies was a challenge – Engineering Business acumen Access to capital Knowledge of the utility industry
  • 9.
    We Turned ourBacks on the Opportunity The DOE Wind R&D budget was cut 90% through the 1980s The wind investment tax credit was abruptly ended in 1986 Most U.S. turbine manufacturers went out of business In 1989, the domestic wind market was lifeless . . . And seven years later US Windpower was bankrupt
  • 10.
    Europe Took theLead in the 1990s Strong market incentives in Denmark, Germany and Spain led to a thriving turbine manufacturing industry Germany was the largest single market until 2008 This European leadership made possible wind’s current competitiveness
  • 11.
    Today, the GlobalIndustry has Three Key Markets Europe – 76,000 MW (end of 2009) Most manufacturers based in Europe North America – 38,500 MW The U.S. is now the largest single market, and all major global companies want to participate Asia – 39,000 MW Chinese market growing most quickly, and establishing a strong manufacturing base
  • 12.
    The U.S. WindIndustry in 2010
  • 13.
    U.S. is WorldLeader in Wind Power With over 35,OOO MW, the U.S. is now the #1 wind energy producer in the world
  • 14.
    2009 Highlights 9,922MW were installed in 2009, bringing the total to 35,159 MW. Growth in 2009 (annual to cumulative): 39% 5-year Compounded Growth: 39% The U.S. wind energy industry shattered all installation records thanks to the Recovery Act.
  • 15.
    U.S. Wind Industry:2009 Wind MW Installed Total Installation in 4Q 2009: 4,041 MW Total Installation in 2009: 9,922 MW Total U.S. Installation through 4Q 2009: 35,159 MW Source: American Wind Energy Association
  • 16.
    Top Ten Statesin 2009 Source: American Wind Energy Association
  • 17.
    State by StateInstallations (MW) Source: American Wind Energy Association
  • 18.
    Market Players: TurbineManufacturers Turbines Installed in 2009: Acciona WP Clipper DeWind Fuhrlander Gamesa GE Energy Mitsubishi Nordex REpower Siemens Suzlon Vestas
  • 19.
    Manufacturers’ Share ofInstalled Capacity Share of 2008 2008 Installations by WTG Mfgr
  • 20.
    U.S. Wind Manufacturing Source: AWEA, updated through 4Q 2009 Major facilities online prior to 2008 All new online in 2008 - 2009 Announced facilities
  • 21.
    300,000 MW ofProposed Wind in Interconnection Queues
  • 22.
    Wind Power inQueues (MW) Iowa 14,569 Minnesota 20,011 New Mexico 14,136 North Dakota 11,493 Penn. 3,391 South Dakota 30,112 Oklahoma 14,677 Illinois 16,284 Ohio 3,683 Kansas 13,191 Wisconsin 908 Michigan 2,518 WV 1,045 New York 8,000 VT 155 Total 311,155 MW MA 492 Montana 2327 NJ 1416 Under 1000 MW 1,000 MW-8,000 MW Over 8,000 MW Missouri 2,050 Indiana 8,426 Maine 1,398 NH 396 RI 347 DE 450 MD 810 VA 820 Arkansas 210 Texas 63,504 Arizona 7,268 California 18,629 Colorado 16,602 Idaho 446 Nebraska 3,726 Nevada 3,913 Oregon 9,361 Utah 1,052 Washington 5,831 Wyoming 7,870
  • 23.
    Note: AWEA doesnot make industry forecasts or endorse any external forecasts Other Analysts’ Projected Wind Growth Nationwide
  • 24.
  • 25.
    20% Wind Energyby 2030 U.S. Department of Energy: “ The U.S. possesses sufficient and affordable wind resources to obtain at least 20% of its electricity from wind by the year 2030.” www.20percentwind.org
  • 26.
    The 20% TechnicalReport Explores one scenario for reaching 20% wind energy by 2030 and contrasts it to a scenario in which no new U.S. wind power capacity is installed Not a prediction - an analysis based on one scenario Is the work of more than 100 individuals involved from 2006 - 2008 (government, industry, utilities, NGOs) NREL – analytical foundation/their model Black & Veatch – input assumptions/market data on cost AEP – independent transmission conceptual design
  • 27.
    The 20% WindEnergy Scenario U.S. electricity consumption grows 39% from 2005 to 2030 – to 5.8 billion MWh (Source: EIA) 20% wind electricity requires about 300 GW (300,000 MW) of wind generation No technology breakthroughs required: 20% wind can be achieved with existing wind technology Technology will continue to improve: Productivity of wind turbines increases about 15% by 2030 This is an extremely conservative assumption
  • 28.
    20% Wind Energyby 2030 Installed Capacity at year end 2009 is greater than 35 GW; 3 years ahead of schedule 305 GW
  • 29.
    20% Wind: Electricity Sector Costs Both scenarios cost over $2 trillion in new investment in net present value terms by 2030 Incremental economic costs reflect: Capital costs of wind projects relative to other projects Incremental transmission investment 20% Wind Scenario requires only 2% more investment ($43 billion in net present value)
  • 30.
    Savings from ReducedNatural Gas Price Pressure The benefits from reduced pressure on natural gas prices across all gas users would be $150 billion (NPV), by itself exceeding the incremental cost of investing in the 20% Wind Scenario. *NPV Source: Hand et al., 2008 Billions of Dollars* 0 20 40 60 80 100 120 140 160 Incremental C ost Natural Gas Savings
  • 31.
    20% Wind Impacton Generation Mix in 2030 Reduces electric utility natural gas consumption by 50% Reduces total natural gas consumption by 11% Natural gas consumer benefits: $86-214 billion * Reduces electric utility coal consumption by 18% Avoids construction of 80 GW of new coal power plants U.S. electrical energy mix Source *: Hand et al., 2008
  • 32.
    Challenges to AchievingWind’s Potential
  • 33.
    Key Barriers toAchieving 20% Wind Need for long-term stable federal policy Need for transmission infrastructure Need to reshape the electric system to manage that percentage of a variable resource
  • 34.
    The Longer TermPolicy Challenge Inconsistent federal policy has been the single biggest constraint on growth of the U.S. wind industry
  • 35.
    Need a stablelong-term federal policy Long-term federal production tax credit (PTC) Federal renewable energy standard (RES) Climate policy that puts a price on carbon Long-term Policy Options
  • 36.
    A Federal RPSMeans Stable Policy AWEA Developed RPS Concept in mid-90s We needed a new policy vehicle PURPA was not effective RPS compatible with wind’s growing cost-competitiveness, more competitive electric industry States embraced the RPS concept 28 states have adopted A Federal RPS will likely be a central component of this summer’s energy legislation
  • 37.
    Barrier 3: Transmission Infrastructure The lack of transmission infrastructure is the single greatest long-term strategic constraint facing the wind industry. There is a growing recognition of this barrier by policymakers National Clean Energy Summit
  • 38.
    20% Wind: Transmission Challenges Enhancement of electrical transmission system required in all electricity-growth scenarios Transmission is needed to: Relieve congestion in existing system Improve system reliability for all customers Increase access to lower-cost energy Access new and remote generation resources Wind requires more transmission than some other options as best winds are often in remote locations Over 300,000 MW of wind lined up in interconnection queues Growing action to build transmission But only 33,000 MW of transmission capacity planned to come on line in next five years
  • 39.
    Getting our HugeWind Resource to Market The solution is clear, but will take time to achieve: Green Power Superhighways: National electricity transmission “superhighways” to add reliability to our electricity supply and bring vast amounts of wind and other renewable energy to market. Key Issues: Regional Planning – interconnection-wide Siting Cost Allocation – regional Coordinated regional grid operations Model: FERC gas pipeline authority
  • 40.
    Transmission Statesleading the way on proactive transmission planning: Texas (CREZ) $4.9 billion in transmission investments to major wind resource areas $2.4 billion ANNUALLY in reduced fuel costs (ERCOT estimate) Provides a model for other states and the nation
  • 41.
    AEP’s Conceptual TransmissionPlan to Accommodate 400 GW of Wind Energy
  • 42.
  • 43.
    Wind is anenergy resource, not a capacity resource Wind Power output is “variable” not “intermittent” There is a cost to managing wind’s variability That cost depends upon system characteristics, but is generally low Wind Integration
  • 44.
    Lessons Learned aboutWind Integration Wind forecasting can significantly reduce integration costs by reducing uncertainty Wind resources spread over larger areas are less variable Diverse wind has very little variability on the minute-to-minute time scale Wind is easier to integrate on more flexible power systems Market/system operation reforms, such as control area consolidation, can significantly reduce wind integration costs, as can coordinated regional operations A robust transmission grid can significantly reduce integration costs Integrating wind is a cost issue, not a reliability issue
  • 45.
    The fact thatwind is not dispatchable does not mean that it makes economic sense to add storage to back up specific wind units Storage should be viewed as a system resource and should be evaluated on that basis. Generally there will be more cost-effective ways to add needed system flexibility than by adding storage technologies. No Study or Report shows that new storage is needed to achieve 20% energy production from wind energy Wind Power & Energy Storage
  • 46.
    Xcel Study RegardingWind Integration Costs In the Xcel analysis, wind integration costs are: $3.51 per MWh in the 10% wind penetration scenario $4.77 per MWh in the 15% scenario $5.13 per MWh in the 20% wind scenario
  • 47.
  • 48.
    The Way ForwardThe wind market has been one of the fastest growing segments of the economy over the past five years – an average annual growth rate of 32% This growth was achieved despite lack of stable, consistent federal policy support. The wind industry, similar to every other sector of the economy, has been hurt by the financial crisis. The wind industry is a capital-intensive industry The PTC is a key component of financing projects, and tax equity has been dramatically reduced by the crisis. Federal and state policy makers view wind and other renewables as key to our energy future and a foundation for job creation. A number of important policies were included in the economic stimulus bill. More pro-wind policies will be coming in the new energy bill. The industry is well situated strategically. Given growing concern about climate change, fossil fuel price volatility, national energy security, and the need to grow domestic jobs and economic development, the wind industry should see double digit growth for decades to come. If you want to be a part of this growing market, join AWEA and come to WINDPOWER 2010 (Dallas, May 23-26).
  • 49.
    Further Information AmericanWind Energy Association www.AWEA.org [email_address] 1501 M Street NW, Suite 1000 Washington, DC 20005

Editor's Notes

  • #6 This conference is a living symbol of the emergence of the wind industry at a new level. I expect wind’s market share of new generating capacity will continue to be significant for years to come. And we are well-positioned strategically. We are One of the most significant single options available for dealing with climate change; A very exciting new source of manufacturing and other jobs in this country; An effective hedge against the scary volatility we are seeing in fossil fuel prices. Aside from those advantages, when you look at the positions of coal, natural gas and nuclear, each is constrained in some very significant ways, leaving wind with an open field for years to come.
  • #20 Figure 12 shows that GE Energy continues to dominate the market, with 43% of the newly installed capacity in 2008 and over 48% of the over 5,000 turbines installed in 2008. The turbine market is still fairly concentrated, with the top eight companies accounting for over 98% of the new capacity added. Vestas and Siemens retained the second and third place spots in terms of installed capacity. New companies are entering the U.S. market each year, however. 2008 saw turbines installed in the U.S. by newcomers to the U.S. market Acciona WP, REPower, Fuhrlander, DeWind, and AWE.
  • #22 Only the 13 largest queues are included here – other utilities may have smaller queues that are not included Source: AWEA analysis of publicly available queue data
  • #23 From data for five largest queues as of March 2009, data for next 8 queues as of end of 2008, data for smaller utilities as of September 2009 Queues for smaller utilities excluded
  • #24 AWEA does not make industry forecasts or endorse any external forecasts
  • #27 20% Wind Scenario: Wind Energy Provides 20% of U.S. Electricity Needs by 2030 Key Issues to Examine: Does the nation have sufficient wind energy resources? What are the wind technology requirements? Does sufficient manufacturing capability exist? What are some of the key impacts? Can the electric network accommodate 20% wind? What are the environmental impacts? Is the scenario feasible? Assessment Participants: U.S. Department of Energy (DOE) Office of Energy Efficiency and Renewable Energy (EERE), Office of Electricity Delivery and Energy Reliability (OE), and Power Marketing Administrations (PMAs) National Renewable Energy Laboratory (NREL) Lawrence Berkeley National Laboratory (Berkeley Lab) Sandia National Laboratories (SNL) Black & Veatch engineering and consulting firm American Wind Energy Association (AWEA) Leading wind manufacturers and suppliers Developers and electric utilities Others in the wind industry
  • #28 Considerations in the 20% Wind Scenario Wind resources of varying quality exist across the United States and offshore. Although land-based resources are less expensive to capture, they are sometimes far from demand centers. Typically, wind power must be integrated into the electric grid with other generation sources. Technology and power market innovations would make it easier to handle a variable energy resource such as wind. New transmission lines would be required to connect new wind power sources to demand centers. Transmission costs add to the cost of delivered wind energy costs, but today’s U.S. grid requires significant upgrading and expansion under almost any scenario. Wind installations will require significant amounts of land, although actual tower footprints are relatively small. Domestic manufacturing capacity might not be sufficient to accommodate near-term rapid growth in U.S. wind generation capacity; the gap may be filled by other countries.
  • #31 The gas savings estimate is based on a mid-range estimate of gas price elasticity.  For low to high elasticities, the estimated savings range from $86 billion to $214 billion.
  • #32 The 20% Wind Scenario would require delivery of nearly 1.16 billion MWh of wind energy in 2030, altering U.S. electricity generation. In this scenario, wind would supply enough energy to displace about 50% of electric utility natural gas consumption and 18% of coal consumption by 2030. This amounts to an 11% reduction in natural gas across all industries. (Gas-fired generation would probably be displaced first, because it typically has a higher operating cost.) Talking Point : Even at 20%, wind still part of an overall portfolio
  • #42 The 20% Wind Scenario assumes that transmission planning and grid operations occur on several levels—planning at the national level, reserve margin constraint planning at the NERC level, and load growth planning and operations at the balancing area (BA) level. For visual clarity, these figures display wind capacity only at the balancing area level. The balancing areas, shaded in purple, depict the amount of locally installed wind, which is assumed to meet local load levels. Generally, the first wind system installed either uses the existing grid or is accompanied by a short transmission line built to supply local loads. In later years, as the existing grid capacity is filled, additional transmission lines are built. New transmission lines built to support load in a balancing area with wind resources within that same area are not pictured in this figure; only transmission lines that cross balancing area boundaries are illustrated. The blue arrows represent wind energy transported on existing transmission lines between balancing areas. The red arrows represent new transmission lines constructed to transport wind energy between balancing areas. The arrows originate and terminate at the centroid of a balancing area and do not represent the physical location of demand centers or wind resources. The location and relative number of red or blue arrows depend on the relative cost of using existing transmission lines or building new lines. Existing Transmission Lines: 71 GW New Capacity Lines within a WinDS region: 67 GW Over 12,000 miles of new transmission will be needed to support the 20% Wind Scenario.
  • #44 The fact that wind power installations can provide cost stability to a utility’s resource portfolio and bring income and tax benefits to rural communities is an obvious advantage of the technology. In addition, electricity produced with wind power does not emit harmful pollutants, generate waste or ash, or burn resources.