Download to read offline


![Formation of Y-Bus by Two rule method or
Inspection Method
Mr.C.Anandhakumar, AP / EEE, SRIT
POWER SYSTEM ANALYSIS
Introduction:
An interconnected power system represents an electric network with a multitude of branches and nodes.
The transmission lines constitute the branches.
In some of the buses power being injected into the network (Generator Bus)
Other buses power being tapped for loads (Load Bus)
Bus Matrix Classification:
Admittance Bus ( Y Bus) - Applications in Load flow and stability analysis.
Impedance Bus (Z bus) – Applications in Short Circuit analysis
The above said two bus matrix find the applications in power system planning and operational studies.
The injected bus currents and bus voltages of a power system under steady state condition can be regulated through
these matrices as
[V]
[Z][I]
[I]
[Y][V]
](https://image.slidesharecdn.com/powersystemanalysisslide-240614164954-f3222d87/85/Power-System-Analysis-introductionslide-pptx-13-320.jpg)


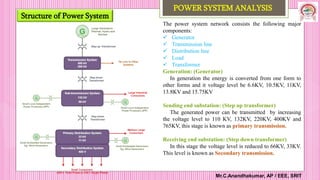
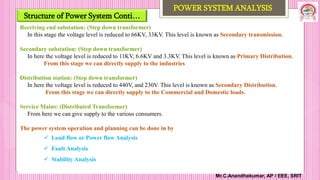
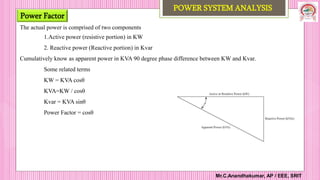
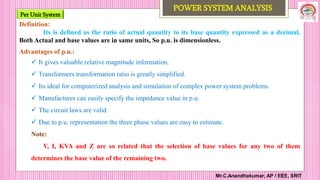
The document outlines the components and structure of a power system, detailing the processes of power generation, transmission, and distribution, along with voltage transformations at various substations. It explains key concepts such as active and reactive power, the per unit system for simplifying calculations, and methods for power system analysis including bus matrix classification. Various bus types, namely slack, p-v, and p-q are described, including their respective specifications and functionalities within the electrical network.