SlideShare a Scribd company logo
1 of 82
Download to read offline
EXPERIMENT 01 DATE:_______________
TO INVESTIGATE THE CONSTRUCTION, OPERATION AND CHARACTERISTICS OF SCR
Objective
1. Understanding the construction and characteristics of an SCR.
2. Understanding the operation of an SCR.
3. Measure an ACR with ohmmeter.
4. Understanding the gate triggering modes of SCR.
Discussion
The silicon-controlled rectifier (SCR) is the most important thyristor in the
family of PNPN devices. It was developed by General Electric in 1957. The SCR
acts as a switch in an AC power control circuit.
Fig. 7-1 SCR (a) circuit symbol (b) PNPN structure
SCR Operation
The SCR is a PNPN four-layer semiconductor device having three terminals:
anode (A), cathode (K), and gate (G). The symbol and construction for an SCR are
shown in Fig. 7-1. In most control applications, the control signal is applied between
the gate and the cathode while the load is connected to either the anode or the
cathode in series. The circuit symbol of the SCR is illustrated in Fig. 7-1(a). The
direction of arrow refers the direction of anode current.
The PNPN four-layer structure for the SCR, shown in Fig. 7-1(b), can be
considered as PNP and NPN transistor connected as the manner of Fig. 7-2. We will
discuss the operation of an SCR by referring to this equivalent two-transistor circuit.
Fig. 7-2 Two-transistor analogy of PNPN structure
When the gate is open and a forward voltage is applied between the anode and
cathode (terminal A is positive with respect to terminal K), the SCR is in off state due
to the absence of base currents of transistors Q1 and Q2. In such a situation only a
small leakage current flows through the SCR.
If a positive potential is applied to the SCR gate, the potential VG will
produce a gate current IG to turn Q2 on (IG=IB2). The collector current of Q2 will
then rise to a value sufficiently large to turn Q1 on (IB1=IC2). As Q1 turns on, IC1
will increase, resulting in a corresponding increase in IB2. The increase in base
current for Q2 will result in a further increase in IC2. The net result is a regenerative
increase in the collector current of each transistor. Transistors Q1 and Q2 will
conduct into saturation in a very short time. The resulting anode-to-cathode
resistance of an SCR is then very small so that a very large current flows from the
anode to cathode. Thus the SCR is turned on. Obviously, removal of the gate signal
will not result in the SCR turning off as long as there is sufficient forward anode-to-
cathode voltage to maintain a holding current IH. In other words, once conduction
has been initiated, the gate signal serves no useful purpose and may be removed.
The methods used to turn off the SCR will be introduced later.
SCR Characteristic Curves
The basic anode characteristic of the SCR is provided in Fig. 7-3 for IG = 0.
The reverse characteristic in quadrant III (the anode to the negative, the cathode to
the positive) is similar to the characteristic of a diode operating in reverse bias. The
peak reverse breakdown voltage (PRV) is defined as the maximum instantaneous
negative voltage that should ever be applied at the anode under any conditions. The
value of PRV depends on the coefficient of resistance of semiconductor and the
thickness of base of PNP transistor. When the applied reverse voltage is smaller than
the PRV value, the SCR is in off state and only small leakage current flows in the
anode. If the reverse voltage is greater than PRV, a large amount of current will flow
and result in the damage to the SCR.
Fig. 7-3 SCR characteristics
The characteristic of the SCR operating in the forward region is shown in
quadrant I of Fig. 7-3. When a small voltage is applied between the anode and
cathode, the SCR is not turned on and only small leakage current flows in the anode.
As the voltage between the anode and cathode (VAK) is increased to a specified
value called VBO, the SCR is turned on and a large amount of current flows in the
anode. The VBO is known as the forward break over voltage of the SCR at IG = 0.
The value of VBO depending n the values of internal transistors and PRV value is
given by
VBO = PRV(1 - 1 - 2)1/n
……………………… (7-1)
Where n is constant and lies between 2 and 3 for a silicon material. From Eq.
(7-1), it is seen that the magnitude of VBO should be slightly smaller than the PRV
rating for an ideal SCR. In practical applications, these two values are usually
considered as the same.
Consider the SCR conducting in its forward conduction region. A decrease in
the anode voltage VAK will cause the anode current to decrease, as indicated on the
line a of Fig. 7-3. When the anode current is smaller than the current value at point
P, the SCR is therefore turned off. The current value at P is called the holding
current, IHO, which is the minimum anode current to maintain the SCR in on state.
Fig. 7-4 SCR output characteristics with variable gate current
The SCR characteristic curve in Fig. 7-3 is plotted with the gate open. If the
external signal is applied to the gate, the gate current will change the forward break
over voltage of the SCR. As shown in Fig. 7-4, an increase in IG will cause the VBO
to decrease. That is, the greater the IG, the smaller the VBO. In other words, the
magnitude of gate current determines the voltage to fire the SCR.
SCR Triggering Characteristics
From the characteristics of the SCR mentioned above, it can be seen that two
conditions must be met to fire the SCR. They are:
(1) Anode voltage should be positive with respect to the cathode;
(2) Gate voltage should be positive with respect to the cathode.
We have found that successful gate triggering depends on the satisfaction of
three conditions:
(1) Trigger current and voltage must be within the triggering area;
(2) Power dissipation in gate circuit should be minimized;
(3) Trigger signal must be properly timed.
SCR Gate Triggering
Three basic types of gate triggering signals are usually used. These are dc
signals, pulse signals and ac shift signals. However, the pulse triggering is the most
popular type.
DC Triggering
DC triggering signal is rarely used in practical SCR applications. The circuit of
Fig. 7-5(a) shows an SCR operating with dc supply and dc triggering signal. When
switch S is closed, a sufficient gate current causes the SCR to turn on. The current-
limiting resistor R is used to ensure the gate dissipation within its rating. This circuit
acts as a dc switch, which uses a low power signal to control a high power load. If a
high power load such as a power relay is used, this circuit can control an ac power
with a dc signal.
Fig. 7-5 DC triggering circuits
Fig. 7-5 (b) shows the SCR circuit operating in ac supply and dc triggering.
The SCR conduct in the positive half cycle of ac supply voltage and cuts off in the
negative half cycle. Therefore the maximum conduction angle of the SCR is 180o
.
During the positive half cycle, the diode X1 is forward-biased and thus the gate
current turns on the SCR. The gate current is controlled by the variable resistor in
gate circuit. By adjusting the resistance value the firing angle can be changed
between the limits of 0 and 90o
.
Pulse Triggering
The gate-to-cathode junction of the SCR us essentially a PN junction.
Whenever voltage is applied at the junction such that a forward bias is achieved,
current flows across the junction and power is dissipated in the form of heat. Gate
power dissipation can be minimized by using a pulse triggering source rather than a
continuous signal.
Fig. 7-6 Waveforms in ac-controlled SCR circuit
Fig. 7-6 shows the relationship of the line voltage, anode voltage and
triggering pulses in an ac-controlled SCR circuit. One precaution that must be taken
in applying pulse sources at the gate of the SCR is that the reverse bias limit of the
gate is not exceeded. A common technique for limiting the negative voltage at the
gate is to clamp the gate to the forward drop across a diode.
This technique is illustrated in fig. 7-7. If a negative voltage is applied at the
gate, the clamping diode conducts and limits the gate voltage to approximately -0.7V.
Fig. 7-7 Clamping the gate reverse bias with a rectifier diode
Fig. 7-8 Relationship among td, tr, and ton
The application of a gate pulse to the gate of an SCR does not result in the
anode current. Initially, there is no significant increase in the anode current, this
interval is known as the delay time td, which is defined as the time interval between
the point where the gate current rises to 10 percent of its final value and the instant
when the device current has risen to 10 percent of the final value of anode current.
Similarly, the rise time tr is the time interval between when the anode current has
increased from 10 percent to 90 percent of its final value. The turn-on time ton is
equal to td+tr. and is approximately 2 s. The relationship among t d, tr and ton is
shown in Fig. 7-8.
Turn-on of SCR
An SCR may be triggered into conduction by:
(1) applying a positive triggering signal to the gate;
(2) exceeding the anode forward blocking voltage VFOM or VDRM;
(3) exceeding the maximum allowable temperature;
(4) excessive rate of change of anode voltage dv/dt.
The above methods of items (2), (3) and (4) are not used in normal operation
since the SCR might be damaged. In either case, the designer must be sure that the
current flow in the anode circuit does not increase too rapidly to the SCR might be
damaged. The maximum di/dt is usually specified by device manufacturers in amps
per microsecond, A/ S. The inductance inherent in many industrial loads such as
motors and transformer tends to limit the rate of change of current in the anode
circuit depending on the time constant L/R. If the load is highly resistive, then
switching an SCR at high voltages could result in excessive di/dt due to the
extremely short rise time of the SCR (typically 1~2 S). In such cases, an inductor is
frequently connected in anode circuit to limit di/dt as shown in Fig. 7-9.
Fig. 7-9 External inductance in the anode circuit to limit di/dt
An effective approach to suppress dv/dt is to use an RC snubber network in
parallel with the SCR, as shown in Fig. 7-10. The capacitor C absorbs the excess
transient energy and the resistor R1 (100 typical) limits the current.
Fig. 7-10 RC snubber network for dv/dt suppression
Turn-off of SCR
As mentioned above, the gate has no control over the SCR once it goes into
conduction. Turn-off must be achieved in the anode-to-cathode circuit. There are
three ways in which turn-off, or commutation as it is commonly called, can be
achieved by:
(1) reversing the anode-to-cathode voltage;
(2) reducing the anode current below the holding current level;
(3) forcing current in the anode circuit in the reverse direction.
When a sinusoidal voltage source is used, turn-off of the SCR occurs
automatically at the end of each positive half cycle of applied voltage. When a dc or
unidirectional voltage source is used, the anode current must be interrupted or a
passive energy storage element is used to attempt to force current through the anode
circuit in the reverse direction, which reverses the anode voltage. Since the SCR is a
PNPN junction semiconductor structure, a minimum time is required for the charges
to reverse at the junction after conduction has been interrupted. This time interval is
called the turn-off time of the SCR. The manufacturer will specify the minimum
turn-off time toff for each SCR under specified operating conditions. If forward
voltage is applied to the anode before the turn-off time is expired, the SCR will go
into conduction without a gate trigger signal. The turn-off time toff for SCRs is
typically 10 to 100 S.
Testing SCR with Ohmmeter
1. Set the range selector of ohmmeter to R x 100. Connect the black led to G
and the red lead to K. A low resistance reading should be indicated by the
pointer. Reversing the polarity, the reading is infinite. In most cases, the
anode of SCR is internally connected to heat sink.
2. With gate open, set the range selector of the ohmmeter to Rx1 position, and
connect the black lead to the anode A and the red lead to the cathode K. the
resistance reading should be infinite. At this time extend the black lead from
the anode to the gate, the reading should indicate a low value. Retract the
black lead from the gate and the reading should remain.
3. The above steps can be used to identify terminals and test an SCR with an
ohmmeter. In general, a standard VOM at R x 10 (15mA) range is suitable
for measuring the SCR whose holding current is less than 15mA. To measure
the SCR having a holding current greater than 15mA, the range of Rx1
(150mA) should be used.
4. When testing the characteristics of gate triggering, the magnitude of the gate
current must be considered. If the supplied gate current is too small, the
resistance between the anode and cathode will return to infinite when the
black lead is retracted from the gate in step 2. The gate voltage and current
can be read from the LV and LI scales on VOM, respectively.
Description of Experiment Circuit
As shown in Fig. 7-11, the experiment circuits contains two major section:
dc triggering and ac phase shift triggering. In dc triggering section, when the gate
voltage of SCR is 0V (VR1=0 ), the SCR is off. If the increase in resistance of VR1
rises the gate voltage VG to reach a sufficient level, the SCR will turn on. Once the
SCR turns on, the gate voltage is not able to turn off it.
The basic RC network, (VR2+R5) and C3, performs the function of ac phase
shifting. As mentioned above, the RC phase shift network varies the firing angles
between 0 and 90 degrees. The triggering angle can be calculated by the equation =
tan-1R C. To extend the range of firing angles to 180 degrees, the bridge RC
network must be used. The OPAMP U1 is used as a differential amplifier to amplify
the differential output of bridge network.
Fig 7.11
Equipment Required
1 – Power Supply Unit IT-9000
1 – Module IT-9003
1 – Analog Multimeter
1 – Dual-Trace Oscilloscope
Procedure
1. 1. Set the range selector of the ohmmeter to Rx1 position. Connect the black lead
to terminal A and the red lead to terminal G. Read and record the reading
indicated by the pointer. RAG = . Reversing the leads, RAG =
.
2. Connect the black lead to terminal G and the red lead to terminal K. Read and
record the reading indicated by the pointer.
RGK = .
Reversing the leads, RGK = .
3. Connect the black lead to A and the red lead to K. Read and record the reading
indicated by the pointer. RAK = . Reversing the leads,
RAK = .
4. Connect the black lead to A and the red lead to K. Connecting G to A with a
wire, read and record the resistance reading indicated by the pointer. RAK =
.
The SCR is (go or no go).
Read and record the voltage reading on LV scale as the forward voltage drop
between the anode and cathode.
VAK = V.
5. Connect 12V, +15V, -15VDC and 18VAC power supplies to Module IT-9003.
Place the 12-V lamp in RL socket.
6. Draw a circuit diagram by connecting points as shown in Fig 7-11. Turn VR1
fully CCW.
7. Observe and record the state of RL
Using the voltmeter, measure and record the anode and gate voltages. VA
= V
VG = V
The SCR is operating in (on or off) state.
8. Slowly turning VR1 to the right, observe and record the change of
VG. When the lamp lights, measure and record the gate voltage.
VG = V
The SCR is operating in (on or off) state.
9. Using the voltmeter, measure and record the anode voltage of the SCR. This
voltage is the forward voltage drop (VF) between the anode and cathode of the
SCR.
VF = V
10. Turn VR1 fully CW. Observe and record the states RL and SCR.
Turn VR1 fully CCW. Observe and record the states of RL and
SCR. Explain the changes.
11. Remove the connect plug from position 1 and then insert it back. Observe and
record the states of RL and SCR.
Fig 7.12
12. Draw Circuit diagram by making connection as in fig 7-12. Using the
oscilloscope, measure the voltage waveform across RL.
Turning VR2, observe and record the changes of the SCR conduction angle and
lamp brightness.
13. Turn VR2 to get maximum conduction angle.
= degrees.
Using the oscilloscope measure and record the voltage waveforms of VG and UK
in Table 7-1.
Table 7-1
VG VK
Fig 7.13
14. Draw a circuit diagram by connecting points as shown in Fig 7-13. Using the
oscilloscope, measure the voltage waveform across RL. Turning VR2, observe
and record the changes of the SCR conduction angle and lamp brightness.
15. Adjust VR2 to get the conduction angle of 90 degrees. Measure and record the
voltage waveforms of VG and VK in Table 7-2.
Table 7-2
VG VK
Fig 7.14
16. Now remove connection from diode and make connection as in fig 7-14.
Observe and record the changes of VG and VK.
Conclusion
You have experimented the dc triggering and ac phase shift triggering for the
SCR. When an SCR operates in dc voltage, a dc voltage to the gate will turn on the
SCR. The conducting SCR remains in on state even the gate signal is removed.
When ac voltage is applied, the SCR is turned on by the gate triggering signal and is
automatically turned off when the applied ac voltage reduces to zero voltage on each
half cycle.
Signature of Subject Engineer:
EXPERIMENT 02 Date_____/______/____________
SCR PHASE CONTROL
Objective
5. Understanding the principle of phase control.
6. Understanding the operation of RC phase control circuit.
7. Studying the application of UJT relaxation oscillator in SCR phase control.
Discussion
The basic purpose of industrial electronic controls is to regulate the transfer
of energy from a source to a load. It may be a weld control to control to control the
conversion of electrical energy to heat; it may be a motor control to control the
conversion of electrical energy to mechanical force; or it may be a safety alarm to
convert electrical energy to sound. If the energy transfer is at a constant rate, then
the control may be as simple as an ON-OFF switch. Quite often it is necessary to
adjust the rate of energy transfer to control the output, such as speed of a motor,
loudness of an alarm, or brightness of a lamp.
The most convenient way to control the rate of energy transfer from an ac
source is to control the portion of each cycle that current is allowed to flow into the
load. This is accomplished in SCR and TRIAC circuits by controlling the phase
angle at which the thyristor is turned on during each cycle of the ac voltage. The
technique is called phase shift control.
Basic Phase Control Circuits
There are many forms of phase control possible with the thyristor, as shown
in Fig. 8-1. The simplest form is the half-wave control of Fig. 8-1(a) which uses one
SCR for control of current flow in one direction only. This circuit is used for loads
which require power control from zero to one-half of full-wave maximum and which
also permit (or require) direct current. The addition of one rectifier diode D, Fig. 8-
1(b), provides a fixed half-cycle of power which shifts the power control range to
half-power minimum and full-power maximum but with strong dc component. The
use of two SCRs, Fig. 8-1(c), controls from zero to full-power and requires isolated
gate signals, either as two control circuits or pulse-transformer coupling form a
single control. Equal triggering angles of the two SCRs produce a symmetrical
output wave with no dc component. Reversible half-wave dc output is obtained by
controlling symmetry of triggering angle.
An alternate form of full-wave control is shown in Fig. 8-1(d). This circuit
has the advantage of a common cathode and gate connection for the two SCRs.
While the two rectifiers prevent reverse voltage from appearing across the SCRs,
they reduce circuit efficiency by their added power loss during conduction.
Fig. 8-1 Basic types of AC phase control
Fig. 8-2 SCR power control with RC phase shift circuit
The most flexible circuit, Fig. 8-1(e), uses one SCR inside a bridge rectifier
and may be used for control of either ac or full-wave rectified dc. When an AC load
is used, it must be connected between ac voltage and bridge rectifier. If a DC load is
desired, it should locate at the dotted block in Fig. 8-1(e). Losses in the rectifiers,
however, make this the least efficient circuit form, and commutation is sometimes a
problem.
By far the most simple method of controlling AC power is the use of the bi-
directional triode thyristor, the TRIAC, as shown in fig. 8-1(f). We will discuss the
operation of this circuit in the description of experiment circuit section.
Fig. 8-3 shows the UJT-SCR phase control circuit used in this experiment.
The bridge rectifier, D1 to D4, provides a pulsating dc form the 18V ac voltage.
Zener diode ZD1 clamps the pulsating dc voltage at 12V for the relaxation
oscillator. Resistor R1 protects the zener form over-current damage.
When no gate triggering pulse is applied to the gate of SCR, the SCR is in off
state and lamp is off. If the UJT relaxation oscillator operates, the pulses at base one will
trigger the SCR to conduction at each positive half cycle, the current thus flows through
the lamp. The load power is controlled by the conduction angle of SCR. In short, the
load power is inversely proportional to the period of triggering pulse.
Fig. 8.3
Equipment Required
1 – Power Supply Unit IT-9000
1 – Module IT-9002
1 – Oscilloscope
Procedure
(3) Locate the UJT trigger SCR shift control circuit, shown in Fig. 8-3, on Module
IT-9002. Apply 18V AC voltage to this circuit from Power Supply Unit IT-9000.
(4) Draw a circuit diagram by connecting points as shown in Fig 8-3. Rotate the
VR1 fully CCW to get the minimum resistance.
(5) Using the oscilloscope, measure the voltage waveform across the zener diode
ZD and record the result in Table 8-1.
Table 8-1
(4) Using the oscilloscope, measure the voltage waveforms at the B1 of UJT and
across the anode-cathode (A-K) of SCR, and record the results in Table 8-2.
Observe and record the brightness of lamp.
Table 8-2
(5) Set the VR1 to the midposition. Repeat step 4 and record the results in Table 8-3.
Observe and record the brightness of lamp.
Table 8-3
(4) Rotate the VR1 arbitrarily and observe the waveform of VAK and the brightness
of lamp. Record the variations of Lamp brightness and triggering angle.
Fig 8.4
5. Make connection as in fig 8-4. Repeat steps 4 and 5.
6. Rotate the VR1 arbitrarily and observe the waveform of VAK and the brightness
of lamp. Record the variations of lamp brightness and triggering angle.
Compare and comment the difference between this result and the result of step 6.
Fig 8.5
2. Make connection as shown in fig 8-5. Repeat steps 4 and 5.
3. Turn the VR1 arbitrarily and observe the waveform of VAK and the brightness
of lamp Record the variations of lamp brightness and triggering angle.
Compare and comment the difference between this result and the result of step 8.
Conclusion
In this experiment we found that as VR1 varies, the period of oscillation of UJT
relaxation oscillator varies so the conduction angle of SCR will vary. The emitter
voltage of UJT is a sawtooth wave and B1 voltage is the triggering pulse for SCR.
Signature of Subject Engineer
EXPERIMENT 03
Date: _____/______/____________
PUT-SCR POWER CONTROL
Objective
3. Understanding the operation of a PUT-SCR Power control circuit.
4. Constructing and measuring the automatic light control circuit.
Discussion
The PUT is flexible and suitable for the use of relaxation oscillator or delay
circuit since its important parameters are programmable. The SCR is an ideal ac
power switch. With appropriate gate triggering techniques, the SCR performs
excellent control function in ac power circuits. In this experiment, we combine the
PUT and SCR to form an ac power control circuit.
Fig. 9-1 shows the PUT-SCR ac power control circuit. The power applied to
the PUT oscillator is a pulsating dc voltage with the peak limited by zener diode.
The pulsating dc that comes from 18-V ac input voltage followed by bridge full-
wave rectifier D1-D4 is used to synchronize with ac line input.
Fig 9.1
The PUT acts as a relaxation oscillator. When the gate voltage VG is fixed,
the PUT switches on it its anode voltage is greater than VG plus VT. The anode
voltage is the capacitor voltage determined by the charging current and RC timing
network. The capacitor charges through R2 and VR2. When the capacitor voltage
reaches the value of VP, the PUT turns on and then a positive pulse is developed on
R6. The positive pulse is applied to the gate of SCR to fire the SCR.
The RC time constant network determines the period of oscillation, which
controls the firing angle of the SCR. In other words, the longer the time constant, the
larger the firing angle becomes. Since the load is a lamp, the conduction angle of the
SCR determines the power delivered to the load and the brightness.
The CDS connected to the gate of the PUT is used to vary the gate voltage
according to the light level. When the CDS is exposed to different light levels, the
different gate voltages determine the variation of the firing angle and therefore the
brightness of lamp is controlled by the light level.
Equipment Required
1 – Power Supply Unit IT-9000
1 – Module IT-9002
1 – Oscilloscope
1 – Multimeter
1 – 20-W Lamp
Procedure
Connect ac power supplies 18Vac and 110Vac from Power Supply Unit IT-9000
to Module IT-9002.
5. Install the 20-W lamp in the socket on IT-9002. Turn VR1 fully CW. Draw a
circuit diagram by connecting points as shown in Fig 9-1. Now locate these
components on the Module and complete the circuit diagram by connecting
the components using the leads with 2mm male pins.
6. Observe and record the state of LP.
Using the multimeter, measure and record the gate voltage of the PUT. VG =
V.
8. Slowly turning VR1 to the left, observe and record the state of LP.
Stop VR1 at midpoint. Using the oscilloscope, measure and record the
voltage waveform at the anode of PUT in Table 9-1.
Table 9-1
9. Measure and record the voltage waveforms of PUT cathode and SCR anode
in Table 9-2.
Table 9-2
10. Turn VR1 fully CCW. Observe and record the change of LP brightness.
Measure and record the voltage waveform of PUT anode in Table 9-3.
Table 9-3
12. Measure and record the voltage waveforms of PUT cathode and SCR anode
in Table 9-4.
Table 9-4
13. Turn VR1 randomly. Observe and record the change of LP
brightness. Is the power on the load controlled VR1?
Fig 9.2
16. Turn VR1 fully CW. Make connection as in fig 9-2. Repeat steps 3 and 4 and
record the result in Table 9-5.
Table 9-5
9. Repeat step 5 and record the results in Table 9-6.
Table 9-6
10. Repeat step 6 and record the result in Table 9-7.
Table 9-7
11. Repeat step 7 and record the results in Table 9-8.
Table 9-8
Fig 9.3
17. Turn VR1 fully CW. make connection as in fig 9-3. Repeat steps 3 through 7.
Observe and record the relationship among the waveforms.
18. Form the above steps, comment on the relationship between the capacitor and
conduction angle of SCR.
Fig 9.4
1. Turn VR1 fully CCW. Make connection as in fig 9-4.
2. Expose the CDS to normal light level. Measure and record the gate voltage of
PUT. VG = V.
Adjust VR1 to keep PUT in off state before conducting.
16. Cover the CDS window with your hand. Is the lamp lighting?
The PUT and SCR are (on or off).
17. Remove your hand from CDS window. Is the lamp lighting?
The PUT and SCR are ( on or off)
Conclusion
In this experiment the PUT oscillator is used to trigger the SCR with its pulse
output. The SCR controls the ac power delivered to the load with different conduction
angles. The firing angle is controlled by the RC network in the anode circuit of the PUT
relaxation oscillator. Adjusting either VR1 or capacitance can change the RC time
constant. The longer the period, the smaller the power on load becomes.
Automatic light control circuit in this experiment was built by the CDS
sensor and PUT-SCR power control circuit. The CDS changes the gate voltage of
PUT in the variation of light level. Therefore the power on the load is controlled by
the light level automatically.
Signature of Subject Engineer
EXPERIMENT: 04
DATE:____/____/_______
TO INVESTIGATE THE PHASE CONTROL THROUGH DIAC AND TRIAC
Objective
3. Understanding and measuring the characteristics of TRIAC.
4. Understanding and measuring the characteristics of DIAC.
5. Performing the DIAC-TRIAC phase control.
Discussion
TRIAC Characteristics
The triode AC switch (TRIAC), sometimes called triggering bi-directional
thyristor, is a three-terminal semiconductor device used in AC power control
applications. The operation of the TRIAC in AC circuits can be considered as
inverse parallel SCRs in AC circuits. Either positive or negative voltage is applied to
MT2 terminal, the TRIAC can be turned on by applying the gate triggering signal.
There are many types of TRIAC available in market such as low power type of RCA
2N5754 (2.4A, 100V) and high power type of RCA 40924 (80A, 600V).
TRIAC Construction
Fig. 11-1 TRIAC (a) structure, (b) circuit symbol
The TRIAC device was developed by General Electric. Fig. 11-1 (a) shows
the cross section of TRIAC. The region between terminals MT2 and MT1 is a PNPN
switch in parallel with an NPNP switch. The circuit symbol of TRIAC is shown in
Fig. 11-1(b). Its terminals are main terminal #2 (MT2) or anode 2, main terminal #1
(MT1) or anode 1, and gate. A practical structure of TRIAC is shown in Fig. 11-2.
Fig. 11-2 Typical TRIAC structure
(a) MT2 positive or negative, gate circuit open
In this mode the junction P1-N1 and N1-P2 re reverse-biased. The TRIAC is
turned off.
(b) MT2 positive, positive gate current
In this mode the TRIAC behaves strictly like an SCR. Active parts are P1-
N1-P2-N2 and the gate current flows through G-P2-N2-MT1.
(c) MT2 positive, negative gate current
Operation is analogous to the junction gate thyristor. P1-N1-P2-N2 is the
main structure, with N3 acting as the junction gate region
(d) MT2 negative, positive gate current
P2-N2 is forward biased and injects electrons, which are collected by P2-N1.
P2-N1 becomes more forward biased. Current through the P2-N1-P1-N4
portion increases and this section switches on. This mode, too, is also
analogous to remote gate operation.
(e) MT2 negative, negative gate current
Remote gate mode, P2-N1-P1-N4 is the main structure, with junction P2-N3
injecting electrons, which are collected by the P2-N1 junction.
TRIAC Characteristics
The TRIAC performs the function of the inverse parallel SCRs configuration.
Fig. 11-3(a) shows the anode characteristic of the TRIAC under zero gate current
condition. The TRIAC will block voltage of either polarity so long as the magnitude of
the voltage is less the forward break over voltage, VBOR or VFOM. The anode current is
limited to a very low leakage level, usually less than a few milliamperes under forward
blocking conditions. There is no reverse voltage specification for the TRIAC.
Parameters VFOM, PFV, VDRM, and VBR are defined exactly the same as SCR
specifications.
Fig. 11-3 TRIAC anode characteristics
From Fig. 11-3(b), it is found that the voltage applied to the gate of TRIAC
has no limitation in polarity. The breakover voltage reduces as the gate current
increase. The control of firing angle for a TRIAC on each half cycle of ac source is
similar to the SCR. Fig. 11-4(a) is a typical TRIAC control circuit. Fig. 11-4(c)
shows the load current waveform, the conduction angle , and the firing angle . The
total conduction angle is the sum of 1 and 2.
Fig. 11-4 (a) Typical TRIAC control circuit (b) AC source,
(c) load current with a resistive load
The operation of TRIAC is similar to two SCRs connected in reverse parallel. An
operation summary of the TRIAC is indicated below:
(1) With the gate open, the TRIAC will be in off-state as long as the MT2-to-MT1
voltage is less the forward break over voltage.
(2) When MT2-MT1 voltage is over 1.5volts, the TRIAC can be triggered to
conduct by applying a gate triggering signal.
(3) The gate signal can not control the TRIAC operating in on state.
(4) One method to turn off the TRIAC is to reduce the MT2 current below the
holding current IH, typically a few microamperes. TRIAC will turn off at the end
of each half cycle in AC circuits.
(5) The gate signal to turn TRIAC on has no limitation in polarity. The magnitude of
triggering current depends upon the polarity of triggering voltage.
(6) The MT2-to-MT1 voltage reduces to a small value of about 1.5V when TRIAC
turns on.
Triggering Characteristics of TRIAC
The difference between TRIAC and SCR triggering is in the polarity of gate
triggering signals. The SCR is triggered by applying a positive gate signal when the
anode voltage is positive. The TRIAC can be triggered under four gate conditions:
(1) I+ : MT2 positive, VG positive
(2) I- : MT2 positive, VG negative
(3) III+: MT2 negative, VG positive
(4) III- : MT2 negative, VG negative
Fig. 11-5 shows the typical triggering requirements for TRIAC. The gate
currents required triggering a TRIAC in I+ and III- modes are equal; That is, the
same gate current is required when the gate and MT1 voltages are in the same
polarity. Notice that the gate current required to trigger in the I- and III+ modes is
higher than the gate current required to trigger in the I+ and III- modes under the
same conditions. The significance of this property is that given a symmetrical gage
triggering source, either I+ and III- and I- and III+ modes should be used in order to
get symmetrical triggering. Other combinations will result in 1 being different than 2
and asymmetrical load current.
Fig. 11-5 Gate trigger current requirements
The turn-on time of TRIAC, typically 10 s, like that of SCR, slightly varies
with the amount of the gate triggering current. That is, the greater the gate current,
the smaller the turn-on time.
DIAC Construction and Characteristics
The di-electrode AC switch (DIAC) is a three-layer NPN semiconductor
device used as a trigger device for TRIAC in AC circuits. The circuit symbols and
structure are shown in Fig. 11-6.
Fig. 11-6 DIAC (a) and (b) circuit symbols, (c) NPN structure
Fig. 11-7 shows the V-I characteristics of the DIAC. When the voltage
applied to terminals is less than the breakover VBO, the DIAC is off and can be
considered as open. If the applied voltage reaches VBO, the DIAC will turn on and
the voltage drop between two terminals will reduce to about 10V. The VBO value of
the DIAC lies between 20V and 40V.
Fig. 11-7 DIAC characteristic
Two Transistors Simulating DIAC
Two-transistor configuration can be used to simulate the operation and
characteristics of the DIAC. We first recall and focus on the breakdown
characteristics of conventional BJTs as follows.
VCBO: The collector-to-base reverse breakdown voltage with the emitter open,
shown in Fig. 11-9(a), is the maximum breakdown voltage of transistor (see Fig. 11-
8). When breakdown occurs, the characteristic is like a zener diode.
Fig. 11-8 Comparison among breakdown voltages of transistor
VCEO: The collector-to-emitter breakdown voltage is measured with the base open as
shown Fig. 11-9(b). As shown in Fig. 11-8, the value of VCEO is less than the value of
VCBO.
VCES: The collector-to-emitter breakdown voltage is measured with the base and
emitter connected together as shown in Fig. 11-9(c). VCES VCBO.
VCER: The collector-to-emitter breakdown voltage is measured with connecting a
resistor in parallel between the base and emitter terminals. As shown in Fig. 11-8,
when the applied voltage reaches VCBO, the first breakdown occurs and then the
voltage reduces to
VCEO: called the second breakdown as the current increases. This characteristic is
the same as that of DIAC. The magnitude of VCER depends upon the resistance
between the base and emitter. For a large R the VCER is close to VCEO and is close
to VCES for a small R.
Fig. 11-9 Measurements of breakdown voltages
Two NPN transistors connected as shown in Fig. 11-10 form a simulating
circuit of DIAC. The V-I characteristics are similar to the DIAC. The breakdown
voltage VCBO of transistors should be less than 30 volts.
Fig. 11-10 Two-transistor configuration to simulate DIAC
DIAC Operation and Testing
The DIAC with negative resistance characteristic can be used in relaxation
oscillator circuit. As shown in Fig. 11-11(a), the DIAC acts as neon tube. When the
capacitor voltage is less than the breakover voltage of DIAC, the DIAC is off and
the capacitor charges through the resistor R. If the capacitor voltage reaches VP,
DIAC turns on and the capacitor discharges through DIAC. When the capacitor
voltage reduces to Vv, DIAC returns to off and a complete cycle is finished. The
voltage waveform is shown in Fig. 11-11(b). Fig. 11-11(c) shows the voltage
waveform when the applied voltage is in reversal polarity.
(a) DIAC relaxation oscillator (b) Voltage waveform with +V
applied
(C) Voltage waveform with –V applied
Fig. 11-11 DIAC relaxation oscillator
Testing a DIAC with an ohmmeter is made as shown in Fig. 11-12. Since the
internal battery voltage is less than VBO of DIAC, the resistance reading indicated
by the pointer is always infinite whenever the polarities are.
Fig. 11-12 Testing DIAC with ohmmeter
Description of Experiment Circuit
Fig 11.13
Fig. 11-13 shows the circuits used in the experiment. We will use the upper
circuit to perform the characteristic measurements of DIAC and TRIAC. The
characteristics of DIAC and TRIAC have been introduced above in detail. The
variable resistor VR2 is used to vary the dc voltage to the gate of the TRIAC for
plotting the V-I curve. D1 and C1 are used to supply a dc voltage to the DIAC from
36-Vac voltage. VR1 is to control the charging current to capacitor C2.
The lower circuit is a DIAC-TRIAC phase control circuit. As mentioned above,
this circuit has a disadvantage of hysteresis phenomenon. R9 and C4 are used to
improve the effect.
Equipment Required
1 – Power Supply Unit IT-9000
1 – Module IT-9003
1 – Oscilloscope
Procedure
1. Connect 36VAC supplies from Power Supply unit IT-9000 to Module IT-
9003. The 36VAC is supplied by connecting two 18VAC supplies in series.
2. Draw a circuit diagram by connecting points as shown in Fig 11-13. Now locate
these components on the Module and complete the circuit diagram by connecting
the components using the leads with 2mm male pins. Set the oscilloscope to X-Y
mode. Connect CH1 input to AC0V terminal, GND to the other terminal of load
R2, and CH2 input to AC36V terminal. Adjust scope controls to indicate the V-I
characteristic on scope display and plot it in
Table 11-1.
Table 11-1
3. From the V-I curve, DIAC VBO = volts,. the voltage
between two anodes = volts.
Fig 11.14
4. Turn off the power. Make connection as in fig 11-14. Turn on the power.
Measure and record the capacitor voltage of C1 using the multimeter.
VC1 = V
5. Set VR1 to its midposition. Using the oscilloscope, measure and record the
voltage waveform across the capacitor C2 in Table 11-2.
6. From Table 11-2, DIAC VP = volts; VV = Volts.
Fig 11.15
7. Make connection as in fig 11-15.Connect DC 12V supply from Power
Supply unit to Module IT-9000.
8. Set scope to X-Y mode. Connect GND to TRIAC T2 terminal, CH1 input to
the other terminal of load R7, and CH2 input to TRIAC T1 terminal. Adjust
scope controls to display V-I characteristic curve and plot the curve in Table
11-1.
9. Turning VR2, observe and record the change of V-I characteristic.
Table 11-2
10. Plot two V-I curves for VBO = 0V and VBO = 0V in Table 11-1 and mark the
voltage and current values.
Fig 11.16
11. Connect AC 36V from Power Supply unit to Module IT-9003. Make
connection as show in figure 11.16. Turning VR3, observe and record the
change of lamp brightness.
Set VR3 to its mid position. Using the oscilloscope, measure and record the
voltage waveforms of capacitor C3 and TRIAC2 T2 in Table 11-3.
Table 11-3
Fig 11.17
12. Make connection as in fig 11-17. Turning VR3, observe and record the
change of lamp brightness.
Set VR3 to its midposition. Using the oscilloscope, measure and record the
voltage waveforms of capacitor C3 and TRIAC T2 in Table 11-4.
Table 11-4
Fig 11.18
13. Make connection as in fig 11-18. Turning VR3, observe and record the
change of lam brightness.
Comparing to the results of step 11, is the hysteresis phenomenon improved?
Set VR3 to its midposition. Using the oscilloscope, measure and record the
voltage waveforms of capacitor C3 and TRIAC2 T2 in Table 11-5.
Table 11-5
Conclusion
In step 2, you have observed the characteristic curve of the DIAC using the
oscilloscope. The VP and VV values of DIAC are obtained from the waveform of V C2.
The VR2 is used to adjust the magnitude of the gate voltage of the TRIAC1
for TRIAC characteristic measurement. That is, the greater the VR2 resistance, the
greater the gate current becomes.
The operation of the DIAC-TRIAC phase control circuit is similar to SCR
phase control circuit. By changing VR3xC3 time constant, the conduction angle of
TRIAC2 and the output power on load are regulated. The components R9 and C4
are used to improve the hysteresis phenomenon found in step 11.
Signature of Subject Engineer
EXPERIMENT 5
Dated:_______________
SCR DC MOTOR FORWARD/REVERSE CONTROL
Objective
8. Understanding the construction and operation of electromagnetic relays.
9. Understanding the turn-off methods of SCRs.
10. Performing the direction of rotation control of a dc motor.
Discussion
SCRs with the features of unidirectional conduction and easy to control are
widely used to control the direction of rotation for dc motors.
Relay Applications
Relays are electrically operated switches. Relays, with the features of
amplification and remote control and signal conversion, are widely used in modern
industrial electronic circuits as remotely controlled mechanical switches to turn on
or off a sequence of events.
An electromagnetic relay utilizes a current through a coil winding to provide
a magnetic field that moves the switch contacts. If the current in the coil is
sufficient, the magnetic force attracts the armature that moves the movable contact
until it touches the stationary contact. If the current is disappeared from the coil, the
movable spring moves the movable contact apart from the stationary contact. The
mechanical construction and appearance of an electromagnetic relay are shown in
Fig. 10-1. It consists of the armature, yoke, coil, core, contacts, springs. The housing
either plastic or metal is used to protect the relay against the damage of foreign
objects and the interference of electromagnetic field.
The commonly used circuit symbols of relays are shown in Fig. 10-2. Either
circle or rectangle in Fig. 10-2(a) represents the relay coil. The normally open
contacts are often abbreviated NO as shown in Fig. 10-2(b). The NO contacts will
make when the coil is energized. The normally closed contacts (NC), shown in Fig.
10-2(c), will break when the coil is energized. Combination of two stationary
contacts and one movable contact which engages one stationary contact when the
coil is energized and the other stationary contact when the coil is not energized is
called a single-pole double-throw (SPDT) relay as shown in Fig. 10-2(d). The
movable contact is called common contact abbreviated as C. The normal contact (N)
is NC and the transfer contact (T) is NO.
Fig. 10-1 Electromagnetic relay
Fig. 10-2 Circuit symbols of relay
There are three popular driver circuits to control the operation of relay. Theses are:
(1) DC source driving
Applied a dc voltage to the relay coil will energize the relay as shown in Fig.
11-3(a). The applied voltage and current must be within the ratings.
(2) Transistor driving
Fig. 10-3(b0 shows a transistor driver used to energize the relay. The control
signal is applied to drive the transistor to conduct. The conducting transistor
provides sufficient current tot energize the relay.
(3) Thyristor driving
The thyristor such as an SCR can be used to drive a relay in dc circuits as
shown in Fig. 10-3(c). In this application a reset switch is often necessary to turn the
SCR off.
Fig. 10-3 Relay drivers
In most applications relays are used in electronic circuits as remotely
controlled mechanical switches used to control a large current load which is isolated
with the signal conditioning circuit. Fig. 10-4 shows an automatic light control
circuit which consists of a relay, CDS, and transistor R and CDS form a voltage
divider to provide a bias to the base of transistor Q. The value of R is designed to
equal ten times CDS resistance in normal light level. This arrangement causes the
transistor off in daylight so that the lamp off. At night, CDS resistance increases to
apply a forward bias driving the transistor to conduct. The collector current through
relay coil energizes the relay and the common contact is transferred to NO contact
so that the lamp lights.
To reverse the direction of rotation of a dc motor, it is simply to reverse that
polarity of applied voltage to the motor. In our experiment circuit we use two
electromagnetic relays to switch the polarity of applied voltage. Fig. 10-5 show a
typical electromagnetic relay with SPDT contacts. When the relay coil has no
current flow, COM contact connects to NC contact. If a sufficient current flows
though the relay coil, the COM contact is pulled to touch with NO contact.
Therefore the relay acts as a switch.
Fig. 10-4 Automatic lamp control circuit
Fig. 10-5 Electromagnetic relay
Turn-off of SCR
The turn-off methods of the SCR are discussed in experiment 7. Fore
convenience we summarize these turn-off methods as follows.
(6) Reduce the anode-to-cathode current IAK below the holding current IH.
(7) Short-circuit the anode and cathode terminals.
(8) Open-circuit the anode-cathode loop.
(9) Reverse the anode-to-cathode voltage.
(10)Use self-commutation technique.
In Fig. 10-6, when neither SCR is conducting, there is virtually no charge on the
capacitor C. if a triggering pulse is applied to the gate of the SCR1 current flows
through RL, R1 and SCR1. Current also flows through R2, C, and SCR1 to charge
the capacitor with the polarities of positive at the right-hand side and negative at the
left-hand side. When a gate triggering pulse is applied at the SCR2, SCR2 conducts
– dropping its anode voltage to approximately 1V. The capacitor voltage is then
placed across the anode to cathode of SCR1. This reverse anode-to-cathode voltage
causes SCR1 to turnoff. The capacitor discharge path is then RL, R1, and SCR2.
Current flows through R1 and SCR2 to charge the capacitor to the opposite polarity.
The circuit is now ready for a gate triggering signal at SCR1 and the cycle repeats.
Fig. 10-6 SCR self-commutation technique
Description of Experiment Circuit
Fig. 10-7 shows a dc motor forward/reverse control circuit. The SCR self-
commutation technique is used in this circuit to control the direction of rotation for a
dc motor. When the instant the dc power is applied, SCRs are off and relays are off.
The dc motor does not run since its two terminals are grounded through relay’s NC
contacts. If the light to CDS1 is blocked, the resistance of CDS1 increases to turn
SCR1 on and RELAY on. The COM1 transfer to NO1 contact, hence the dc motor
runs in forward direction. The capacitor C1 charges through RELAY2 coil and
SCR1. The negative charges are at the left terminal of C1. When the light to CDS2
is blocked, SCR2 begins to conduct and the negative potential at SCR1 anode turns
SCR1 off. The on SCR2 energizes RELAY2 and hence COM2 transfers to NO2
contact. Therefore the dc motor runs in reverse direction.
The SW switch is used to stop the motor by moving switch in downward position.
Fig 10.7
Equipment Required
1 – Power Supply Unit IT-9000
1 – Module IT 9004
1 – Multimeter
Procedure
(5) Connect DC12V power supply from Power Supply Unit IT-9000 to Module IT
9001.
(6) At this time the SCR should be off. Observe and record the state of LED.
Using the multimeter, measure and record the anode-to-cathode voltages of
SCR1 and SCR2.
VAK1 = V; VAK2 = V
Record the state of each SCR.
(6) Using the multimeter, measure an record the voltages at COM contacts of
RELAY1 and RELAY2.
VCOM1 = V; VCOM2 = V
4. Using the multimeter, measure and record the voltages across CDS1 and CDS2.
VCDS1 = V; VCDS2 = V
Record the state of each SCR.
(5) Expose CDS1 to high light level. Measure the voltage across CDS1 using the
ohmmeter. Is this voltage changed?
Measure the anode-to-cathode voltage of SCR1. Is SCR1 on or off?
Cover CDS1 window with your hand. Observe and record the state of relay.
Remove your hand from CDS1 window. Measure the voltage across CDS1 using
the ohmmeter. Is this voltage changed?
Measure the node-to-cathode voltage of SCR1. Is SCR1 on or off?
Measure and record the voltage at point
COM1. Does LEDf2 light?
(6) Using the multimeter, measure and record the voltage across the capacitor C1.
VC1 = V
The polarity of VC1 at the anode terminal of SCR1
is (positive or negative).
7. Cover CDS2 window with your hand. Does the LED2 extinguish?
Does the LED1 light?
Using the multimeter, measure the voltage across CDS2 and VAK of SCR2. Is
SCR2 on?
Measure VAK of SCR1. Is SCR1 off?
VCOM1 = V; VCOM2 = V
Remove your hand from CDS2 window. Observe and record the state of SCRs.
8. Using the multimeter, measure and record the capacitor voltage.
The polarity of capacitor voltage at SCR2 anode terminal is (positive
or negative). VC = V
7. Cover CDS1 window with your hand. Does the LED1
extinguish? Does the LED2 light?
Cover CDS2 window with your hand. Does the LED2
extinguish? Does the LED1 light?
8. Press S1 S1 to stop motor. Do the LED2 extinguish?
To start motor, cover any CDS with your hand.
Conclusion
You have experimented the operation of a dc motor control circuit for the
direction of rotation. The use of CDS is just an application example in this circuit.
You may use other sensors or switches to design a control circuit similar to this
application.
The self-commutation technique is very useful and widely used to turn off SCRs.
For normal operation the commutation time of the SCR should be short to avoid
SCRs conducting simultaneously. Since the commutation item of an SCR is
typically 10 S, it can be ignored in this circuit.
Signature of Subject Engineer
EXPERIMENT 06 DATED:
AUTOMATIC LAMP DIMMING CIRCUITS
Objective
11. Understanding the operation of TRIAC and SCR phase controls.
12. Understanding the operation of DIAC-TRIAC phase control circuit.
13. Performing an automatic lamp dimming control.
Discussion
TRIAC Phase Control
1. RC Phase Control
The TRIAC, like SCR, is often used in an AC circuit to control the power on
load. A TRIAC can operate in full-wave phase control circuits while an SCR can
operate in half-wave phase control circuits. Though the power rating of TRIACs is
less than that of SCRs, it is more convenient in AC applications.
Fig. 12-1 Basic RC phase control circuit.
Fig. 12-1 shows a basic RC phase control circuit. The capacitor voltage VC
lags behind VTT an angle depending upon RC time constant and the gate trigger
level required to fire the TRIAC as shown in Fig. 12-2.
On the positive half cycle of line voltage, the positive value of VC reaches
the trigger level at t1 and turns the TRIAC on. The angle 1 is called the firing angle
or triggering angle. This operates in I+ mode; that is, T2 positive and gate positive.
On the negative half cycle, the TRIAC is triggered at t3 with a triggering angle 2.
This mode is III-, or T2 negative and gate negative. Though the triggering sensitivity
in mode I+ is equal to mode III-, a slight difference exists between 1 and 2, 1 2.
Fig. 12-2 Relationship between VC and VTT in the circuit of Fig. 12-1
Fig. 12-3 Basic DIAC-TRIAC phase control circuit
The most elementary form of full-wave phase control is the simple DIAC-
TRIAC circuit of Fig. 12-3. When the capacitor voltage reaches the bleakover voltage
VBO, the DIAC turns on and then turn the TRIAC on. Since the values of VBO+ and
VBO- are nearly equal, therefore the triggering angles in positive and negative half
cycles are equal as shown in Fig. 12-4.
Fig. 12-4 Relationship between VC and VTT in the circuit of Fig. 12-3
The circuit of Fig. 12-3 is widely used in lamp dimming control and fan
speed control circuit. The disadvantage of this circuit is the range as firing angle less
than 180 degrees.
Fig. 12-5 Extended range phase control circuit
To extend the range of firing angle, it is a good solution to connect two
sections of RC phase shifting network in series as shown in Fig. 12-5. The capacitor
CF is used to limit the value of dv/dt, and the inductor LF is to limit value of di/dt.
2. Phase Control with Pulse triggering
Fig. 12-6 UJT relaxation oscillator in TRIAC phase control
Fig. 12-6 shows a pulse triggering circuit for the TRIAC. The trigger pulse is
generated by a UJT relaxation oscillator and coupled by the transformer to the gate
of the TRIAC.
Description of Experiment Circuit
The circuit of Fig. 12-7 is a lamp dimming control circuit used in this
experiment. A brief description is made as follows:
The DIAC is a useful trigger device for TRIAC power control applications. If the
applied voltage across two terminals reaches the breakover voltage of DIAC, the
DIAC is thus turned on. In the circuit of Fig. 12-7, when line voltage is applied, the
capacitor C1 charges through R1 and VR1 and builds a sufficient voltage to trigger
SCR or TRIAC to switch on. By adjusting VR1, the conduction angle of SCR or
TRIAC can be changed to achieve the function of lamp dimming control.
Fig 12.7
Similarly, if DIAC is used and C1 changes to reach the breakover voltage of
DIAC, DIAC turns on and triggers SCR or TRIAC to conduct. R2C2 network is used
to extend the range of firing angles. Diode D1 is to protect the SCR gate from the
negative triggering pulse.
The CDS is used to perform the function of automatic lamp dimming control.
In normal light level, the trigger potential is set at a low level that can not trigger
DIAC to turn on. Thus SCR or TRIAC and LP are off. When the light source is
blocked, an increase in CDS resistance causes a sufficient trigger potential to turn
the DIAC on SCR or TRIAC is then turn on and LP is on.
Equipment Required
1 – Power Supply Unit IT-9000
1 – Module IT-9006
1 – Oscilloscope
Procedure
(11)Connect 110VAC power supply from Power Supply Unit IT-9000 to
Module IT-9006. Install the lamp in the socket on module.
(12)Make connection as shown in fig 12-7. Now locate these components on the
Module and complete the circuit diagram by connecting the components
using the leads with
(13)2mm male pins. Repeat steps 2 and 3. Record the results in Table 12-1.
Table 12-1
Fig 12.8
(7) Make connection as shown in fig 12-8. Repeat steps 2 and 3. Record the
results in Table 12-2.
Table 12-2
Fig 12.9
(7) Make connection as shown in fig 12-9. Repeat steps 7 and 8 and record the
results in Table 12-3.
Table 12-3
Fig 12.10
(7) Make connection as shown in fig 12-10. Repeat steps 7 and 8. Record the
results in Table 12-4.
Table 12-4
9. Which of the trigger circuits is the best?
Which of the power control circuits has maximum power output?
Fig 12.11
4. Make connection as shown in fig 12-11. Expose CDS to normal light level.
Adjust VR1 to keep TRIAC in off state before conducting.
5. Observe and record the states of lamp, DIAC, and TRIAC.
6. Press and hold SW1. Observe and record the states of lamp, DIAC, and
TRIAC.
Conclusion
You have experimented the automatic lamp dimming control. Single section
of RC phase shifting control may cause a hysteresis phenomenon. This effect can be
eliminated by adding a RC network in series.
Since SCR conducts only during the positive half cycle of line voltage, the
power delivered to the load is smaller than the TRIAC control circuit. This effect
has been demonstrated by measuring the load voltages and observing the brightness
of the lamp. By the way, the CDS light control circuit can be used as a streetlight
control circuit.
SIGNATURE OF SUBJECT TEACHER:

More Related Content

Similar to Power Electronics Lab (part-1).docx

Turn on Methods of SCR.pdf
Turn on Methods of SCR.pdfTurn on Methods of SCR.pdf
Turn on Methods of SCR.pdfyogeshkute
 
Applications of power electronic device to power system
Applications of power electronic device to power systemApplications of power electronic device to power system
Applications of power electronic device to power systemswathiammu7
 
Introduction to scr thyristers
Introduction to scr thyristersIntroduction to scr thyristers
Introduction to scr thyristersiqtadar ali gilani
 
the silicon controled rectifier with diagram.pptx
the silicon controled rectifier with diagram.pptxthe silicon controled rectifier with diagram.pptx
the silicon controled rectifier with diagram.pptxyogeshkute7
 
Unit 1 thyristors protection
Unit 1 thyristors protectionUnit 1 thyristors protection
Unit 1 thyristors protectionEr.Meraj Akhtar
 
Thyristor Characteristics, Two Transistor Model Of Thyristor & Thyrisror Turn...
Thyristor Characteristics, Two Transistor Model Of Thyristor & Thyrisror Turn...Thyristor Characteristics, Two Transistor Model Of Thyristor & Thyrisror Turn...
Thyristor Characteristics, Two Transistor Model Of Thyristor & Thyrisror Turn...University of Gujrat, Pakistan
 
Silicon Controlled Rectifier
Silicon Controlled Rectifier Silicon Controlled Rectifier
Silicon Controlled Rectifier Nikhil Kumar
 
Thyristors,Commutayion of Thyristor, Power Electronics
Thyristors,Commutayion of Thyristor, Power ElectronicsThyristors,Commutayion of Thyristor, Power Electronics
Thyristors,Commutayion of Thyristor, Power ElectronicsDurgesh Singh
 
SCR_Firing_commutation
SCR_Firing_commutationSCR_Firing_commutation
SCR_Firing_commutationjayantmane
 
SCR NEW FOR TOMMOROW.pdf
SCR  NEW FOR TOMMOROW.pdfSCR  NEW FOR TOMMOROW.pdf
SCR NEW FOR TOMMOROW.pdfyogeshkute
 
International Refereed Journal of Engineering and Science (IRJES)
International Refereed Journal of Engineering and Science (IRJES)International Refereed Journal of Engineering and Science (IRJES)
International Refereed Journal of Engineering and Science (IRJES)irjes
 
59948408 ee-2304-pe-lab-manual-final2011
59948408 ee-2304-pe-lab-manual-final201159948408 ee-2304-pe-lab-manual-final2011
59948408 ee-2304-pe-lab-manual-final2011homeworkping4
 

Similar to Power Electronics Lab (part-1).docx (20)

Turn on Methods of SCR.pdf
Turn on Methods of SCR.pdfTurn on Methods of SCR.pdf
Turn on Methods of SCR.pdf
 
Applications of power electronic device to power system
Applications of power electronic device to power systemApplications of power electronic device to power system
Applications of power electronic device to power system
 
Module 2 thyristors
Module 2 thyristorsModule 2 thyristors
Module 2 thyristors
 
Thyristor
ThyristorThyristor
Thyristor
 
Module 2 thyristors
Module 2 thyristorsModule 2 thyristors
Module 2 thyristors
 
Introduction to scr thyristers
Introduction to scr thyristersIntroduction to scr thyristers
Introduction to scr thyristers
 
the silicon controled rectifier with diagram.pptx
the silicon controled rectifier with diagram.pptxthe silicon controled rectifier with diagram.pptx
the silicon controled rectifier with diagram.pptx
 
Unit 1 thyristors protection
Unit 1 thyristors protectionUnit 1 thyristors protection
Unit 1 thyristors protection
 
Thyristor Characteristics, Two Transistor Model Of Thyristor & Thyrisror Turn...
Thyristor Characteristics, Two Transistor Model Of Thyristor & Thyrisror Turn...Thyristor Characteristics, Two Transistor Model Of Thyristor & Thyrisror Turn...
Thyristor Characteristics, Two Transistor Model Of Thyristor & Thyrisror Turn...
 
Silicon Controlled Rectifier
Silicon Controlled Rectifier Silicon Controlled Rectifier
Silicon Controlled Rectifier
 
Thyristor
Thyristor Thyristor
Thyristor
 
Thyristors,Commutayion of Thyristor, Power Electronics
Thyristors,Commutayion of Thyristor, Power ElectronicsThyristors,Commutayion of Thyristor, Power Electronics
Thyristors,Commutayion of Thyristor, Power Electronics
 
SCR_Firing_commutation
SCR_Firing_commutationSCR_Firing_commutation
SCR_Firing_commutation
 
SCR NEW FOR TOMMOROW.pdf
SCR  NEW FOR TOMMOROW.pdfSCR  NEW FOR TOMMOROW.pdf
SCR NEW FOR TOMMOROW.pdf
 
International Refereed Journal of Engineering and Science (IRJES)
International Refereed Journal of Engineering and Science (IRJES)International Refereed Journal of Engineering and Science (IRJES)
International Refereed Journal of Engineering and Science (IRJES)
 
Scr firing circuits
Scr firing circuitsScr firing circuits
Scr firing circuits
 
Pex ppt.pdf
Pex ppt.pdfPex ppt.pdf
Pex ppt.pdf
 
59948408 ee-2304-pe-lab-manual-final2011
59948408 ee-2304-pe-lab-manual-final201159948408 ee-2304-pe-lab-manual-final2011
59948408 ee-2304-pe-lab-manual-final2011
 
Presentation1
Presentation1Presentation1
Presentation1
 
SCR-new.pptx
SCR-new.pptxSCR-new.pptx
SCR-new.pptx
 

Recently uploaded

Model Call Girl in Narela Delhi reach out to us at 🔝8264348440🔝
Model Call Girl in Narela Delhi reach out to us at 🔝8264348440🔝Model Call Girl in Narela Delhi reach out to us at 🔝8264348440🔝
Model Call Girl in Narela Delhi reach out to us at 🔝8264348440🔝soniya singh
 
chaitra-1.pptx fake news detection using machine learning
chaitra-1.pptx  fake news detection using machine learningchaitra-1.pptx  fake news detection using machine learning
chaitra-1.pptx fake news detection using machine learningmisbanausheenparvam
 
Porous Ceramics seminar and technical writing
Porous Ceramics seminar and technical writingPorous Ceramics seminar and technical writing
Porous Ceramics seminar and technical writingrakeshbaidya232001
 
(MEERA) Dapodi Call Girls Just Call 7001035870 [ Cash on Delivery ] Pune Escorts
(MEERA) Dapodi Call Girls Just Call 7001035870 [ Cash on Delivery ] Pune Escorts(MEERA) Dapodi Call Girls Just Call 7001035870 [ Cash on Delivery ] Pune Escorts
(MEERA) Dapodi Call Girls Just Call 7001035870 [ Cash on Delivery ] Pune Escortsranjana rawat
 
(SHREYA) Chakan Call Girls Just Call 7001035870 [ Cash on Delivery ] Pune Esc...
(SHREYA) Chakan Call Girls Just Call 7001035870 [ Cash on Delivery ] Pune Esc...(SHREYA) Chakan Call Girls Just Call 7001035870 [ Cash on Delivery ] Pune Esc...
(SHREYA) Chakan Call Girls Just Call 7001035870 [ Cash on Delivery ] Pune Esc...ranjana rawat
 
(PRIYA) Rajgurunagar Call Girls Just Call 7001035870 [ Cash on Delivery ] Pun...
(PRIYA) Rajgurunagar Call Girls Just Call 7001035870 [ Cash on Delivery ] Pun...(PRIYA) Rajgurunagar Call Girls Just Call 7001035870 [ Cash on Delivery ] Pun...
(PRIYA) Rajgurunagar Call Girls Just Call 7001035870 [ Cash on Delivery ] Pun...ranjana rawat
 
Architect Hassan Khalil Portfolio for 2024
Architect Hassan Khalil Portfolio for 2024Architect Hassan Khalil Portfolio for 2024
Architect Hassan Khalil Portfolio for 2024hassan khalil
 
What are the advantages and disadvantages of membrane structures.pptx
What are the advantages and disadvantages of membrane structures.pptxWhat are the advantages and disadvantages of membrane structures.pptx
What are the advantages and disadvantages of membrane structures.pptxwendy cai
 
(ANVI) Koregaon Park Call Girls Just Call 7001035870 [ Cash on Delivery ] Pun...
(ANVI) Koregaon Park Call Girls Just Call 7001035870 [ Cash on Delivery ] Pun...(ANVI) Koregaon Park Call Girls Just Call 7001035870 [ Cash on Delivery ] Pun...
(ANVI) Koregaon Park Call Girls Just Call 7001035870 [ Cash on Delivery ] Pun...ranjana rawat
 
High Profile Call Girls Nagpur Isha Call 7001035870 Meet With Nagpur Escorts
High Profile Call Girls Nagpur Isha Call 7001035870 Meet With Nagpur EscortsHigh Profile Call Girls Nagpur Isha Call 7001035870 Meet With Nagpur Escorts
High Profile Call Girls Nagpur Isha Call 7001035870 Meet With Nagpur Escortsranjana rawat
 
main PPT.pptx of girls hostel security using rfid
main PPT.pptx of girls hostel security using rfidmain PPT.pptx of girls hostel security using rfid
main PPT.pptx of girls hostel security using rfidNikhilNagaraju
 
SPICE PARK APR2024 ( 6,793 SPICE Models )
SPICE PARK APR2024 ( 6,793 SPICE Models )SPICE PARK APR2024 ( 6,793 SPICE Models )
SPICE PARK APR2024 ( 6,793 SPICE Models )Tsuyoshi Horigome
 
Introduction and different types of Ethernet.pptx
Introduction and different types of Ethernet.pptxIntroduction and different types of Ethernet.pptx
Introduction and different types of Ethernet.pptxupamatechverse
 
HARMONY IN THE NATURE AND EXISTENCE - Unit-IV
HARMONY IN THE NATURE AND EXISTENCE - Unit-IVHARMONY IN THE NATURE AND EXISTENCE - Unit-IV
HARMONY IN THE NATURE AND EXISTENCE - Unit-IVRajaP95
 
GDSC ASEB Gen AI study jams presentation
GDSC ASEB Gen AI study jams presentationGDSC ASEB Gen AI study jams presentation
GDSC ASEB Gen AI study jams presentationGDSCAESB
 
Call for Papers - African Journal of Biological Sciences, E-ISSN: 2663-2187, ...
Call for Papers - African Journal of Biological Sciences, E-ISSN: 2663-2187, ...Call for Papers - African Journal of Biological Sciences, E-ISSN: 2663-2187, ...
Call for Papers - African Journal of Biological Sciences, E-ISSN: 2663-2187, ...Christo Ananth
 
Call Girls Service Nagpur Tanvi Call 7001035870 Meet With Nagpur Escorts
Call Girls Service Nagpur Tanvi Call 7001035870 Meet With Nagpur EscortsCall Girls Service Nagpur Tanvi Call 7001035870 Meet With Nagpur Escorts
Call Girls Service Nagpur Tanvi Call 7001035870 Meet With Nagpur EscortsCall Girls in Nagpur High Profile
 

Recently uploaded (20)

Call Us -/9953056974- Call Girls In Vikaspuri-/- Delhi NCR
Call Us -/9953056974- Call Girls In Vikaspuri-/- Delhi NCRCall Us -/9953056974- Call Girls In Vikaspuri-/- Delhi NCR
Call Us -/9953056974- Call Girls In Vikaspuri-/- Delhi NCR
 
Model Call Girl in Narela Delhi reach out to us at 🔝8264348440🔝
Model Call Girl in Narela Delhi reach out to us at 🔝8264348440🔝Model Call Girl in Narela Delhi reach out to us at 🔝8264348440🔝
Model Call Girl in Narela Delhi reach out to us at 🔝8264348440🔝
 
chaitra-1.pptx fake news detection using machine learning
chaitra-1.pptx  fake news detection using machine learningchaitra-1.pptx  fake news detection using machine learning
chaitra-1.pptx fake news detection using machine learning
 
DJARUM4D - SLOT GACOR ONLINE | SLOT DEMO ONLINE
DJARUM4D - SLOT GACOR ONLINE | SLOT DEMO ONLINEDJARUM4D - SLOT GACOR ONLINE | SLOT DEMO ONLINE
DJARUM4D - SLOT GACOR ONLINE | SLOT DEMO ONLINE
 
Porous Ceramics seminar and technical writing
Porous Ceramics seminar and technical writingPorous Ceramics seminar and technical writing
Porous Ceramics seminar and technical writing
 
(MEERA) Dapodi Call Girls Just Call 7001035870 [ Cash on Delivery ] Pune Escorts
(MEERA) Dapodi Call Girls Just Call 7001035870 [ Cash on Delivery ] Pune Escorts(MEERA) Dapodi Call Girls Just Call 7001035870 [ Cash on Delivery ] Pune Escorts
(MEERA) Dapodi Call Girls Just Call 7001035870 [ Cash on Delivery ] Pune Escorts
 
(SHREYA) Chakan Call Girls Just Call 7001035870 [ Cash on Delivery ] Pune Esc...
(SHREYA) Chakan Call Girls Just Call 7001035870 [ Cash on Delivery ] Pune Esc...(SHREYA) Chakan Call Girls Just Call 7001035870 [ Cash on Delivery ] Pune Esc...
(SHREYA) Chakan Call Girls Just Call 7001035870 [ Cash on Delivery ] Pune Esc...
 
(PRIYA) Rajgurunagar Call Girls Just Call 7001035870 [ Cash on Delivery ] Pun...
(PRIYA) Rajgurunagar Call Girls Just Call 7001035870 [ Cash on Delivery ] Pun...(PRIYA) Rajgurunagar Call Girls Just Call 7001035870 [ Cash on Delivery ] Pun...
(PRIYA) Rajgurunagar Call Girls Just Call 7001035870 [ Cash on Delivery ] Pun...
 
Architect Hassan Khalil Portfolio for 2024
Architect Hassan Khalil Portfolio for 2024Architect Hassan Khalil Portfolio for 2024
Architect Hassan Khalil Portfolio for 2024
 
What are the advantages and disadvantages of membrane structures.pptx
What are the advantages and disadvantages of membrane structures.pptxWhat are the advantages and disadvantages of membrane structures.pptx
What are the advantages and disadvantages of membrane structures.pptx
 
(ANVI) Koregaon Park Call Girls Just Call 7001035870 [ Cash on Delivery ] Pun...
(ANVI) Koregaon Park Call Girls Just Call 7001035870 [ Cash on Delivery ] Pun...(ANVI) Koregaon Park Call Girls Just Call 7001035870 [ Cash on Delivery ] Pun...
(ANVI) Koregaon Park Call Girls Just Call 7001035870 [ Cash on Delivery ] Pun...
 
High Profile Call Girls Nagpur Isha Call 7001035870 Meet With Nagpur Escorts
High Profile Call Girls Nagpur Isha Call 7001035870 Meet With Nagpur EscortsHigh Profile Call Girls Nagpur Isha Call 7001035870 Meet With Nagpur Escorts
High Profile Call Girls Nagpur Isha Call 7001035870 Meet With Nagpur Escorts
 
main PPT.pptx of girls hostel security using rfid
main PPT.pptx of girls hostel security using rfidmain PPT.pptx of girls hostel security using rfid
main PPT.pptx of girls hostel security using rfid
 
SPICE PARK APR2024 ( 6,793 SPICE Models )
SPICE PARK APR2024 ( 6,793 SPICE Models )SPICE PARK APR2024 ( 6,793 SPICE Models )
SPICE PARK APR2024 ( 6,793 SPICE Models )
 
Introduction and different types of Ethernet.pptx
Introduction and different types of Ethernet.pptxIntroduction and different types of Ethernet.pptx
Introduction and different types of Ethernet.pptx
 
HARMONY IN THE NATURE AND EXISTENCE - Unit-IV
HARMONY IN THE NATURE AND EXISTENCE - Unit-IVHARMONY IN THE NATURE AND EXISTENCE - Unit-IV
HARMONY IN THE NATURE AND EXISTENCE - Unit-IV
 
9953056974 Call Girls In South Ex, Escorts (Delhi) NCR.pdf
9953056974 Call Girls In South Ex, Escorts (Delhi) NCR.pdf9953056974 Call Girls In South Ex, Escorts (Delhi) NCR.pdf
9953056974 Call Girls In South Ex, Escorts (Delhi) NCR.pdf
 
GDSC ASEB Gen AI study jams presentation
GDSC ASEB Gen AI study jams presentationGDSC ASEB Gen AI study jams presentation
GDSC ASEB Gen AI study jams presentation
 
Call for Papers - African Journal of Biological Sciences, E-ISSN: 2663-2187, ...
Call for Papers - African Journal of Biological Sciences, E-ISSN: 2663-2187, ...Call for Papers - African Journal of Biological Sciences, E-ISSN: 2663-2187, ...
Call for Papers - African Journal of Biological Sciences, E-ISSN: 2663-2187, ...
 
Call Girls Service Nagpur Tanvi Call 7001035870 Meet With Nagpur Escorts
Call Girls Service Nagpur Tanvi Call 7001035870 Meet With Nagpur EscortsCall Girls Service Nagpur Tanvi Call 7001035870 Meet With Nagpur Escorts
Call Girls Service Nagpur Tanvi Call 7001035870 Meet With Nagpur Escorts
 

Power Electronics Lab (part-1).docx

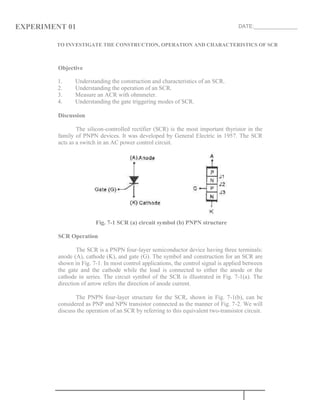
  • 1. EXPERIMENT 01 DATE:_______________ TO INVESTIGATE THE CONSTRUCTION, OPERATION AND CHARACTERISTICS OF SCR Objective 1. Understanding the construction and characteristics of an SCR. 2. Understanding the operation of an SCR. 3. Measure an ACR with ohmmeter. 4. Understanding the gate triggering modes of SCR. Discussion The silicon-controlled rectifier (SCR) is the most important thyristor in the family of PNPN devices. It was developed by General Electric in 1957. The SCR acts as a switch in an AC power control circuit. Fig. 7-1 SCR (a) circuit symbol (b) PNPN structure SCR Operation The SCR is a PNPN four-layer semiconductor device having three terminals: anode (A), cathode (K), and gate (G). The symbol and construction for an SCR are shown in Fig. 7-1. In most control applications, the control signal is applied between the gate and the cathode while the load is connected to either the anode or the cathode in series. The circuit symbol of the SCR is illustrated in Fig. 7-1(a). The direction of arrow refers the direction of anode current. The PNPN four-layer structure for the SCR, shown in Fig. 7-1(b), can be considered as PNP and NPN transistor connected as the manner of Fig. 7-2. We will discuss the operation of an SCR by referring to this equivalent two-transistor circuit.
  • 2. Fig. 7-2 Two-transistor analogy of PNPN structure When the gate is open and a forward voltage is applied between the anode and cathode (terminal A is positive with respect to terminal K), the SCR is in off state due to the absence of base currents of transistors Q1 and Q2. In such a situation only a small leakage current flows through the SCR. If a positive potential is applied to the SCR gate, the potential VG will produce a gate current IG to turn Q2 on (IG=IB2). The collector current of Q2 will then rise to a value sufficiently large to turn Q1 on (IB1=IC2). As Q1 turns on, IC1 will increase, resulting in a corresponding increase in IB2. The increase in base current for Q2 will result in a further increase in IC2. The net result is a regenerative increase in the collector current of each transistor. Transistors Q1 and Q2 will conduct into saturation in a very short time. The resulting anode-to-cathode resistance of an SCR is then very small so that a very large current flows from the anode to cathode. Thus the SCR is turned on. Obviously, removal of the gate signal will not result in the SCR turning off as long as there is sufficient forward anode-to- cathode voltage to maintain a holding current IH. In other words, once conduction has been initiated, the gate signal serves no useful purpose and may be removed. The methods used to turn off the SCR will be introduced later. SCR Characteristic Curves The basic anode characteristic of the SCR is provided in Fig. 7-3 for IG = 0. The reverse characteristic in quadrant III (the anode to the negative, the cathode to the positive) is similar to the characteristic of a diode operating in reverse bias. The peak reverse breakdown voltage (PRV) is defined as the maximum instantaneous negative voltage that should ever be applied at the anode under any conditions. The value of PRV depends on the coefficient of resistance of semiconductor and the thickness of base of PNP transistor. When the applied reverse voltage is smaller than the PRV value, the SCR is in off state and only small leakage current flows in the anode. If the reverse voltage is greater than PRV, a large amount of current will flow and result in the damage to the SCR.
  • 3. Fig. 7-3 SCR characteristics The characteristic of the SCR operating in the forward region is shown in quadrant I of Fig. 7-3. When a small voltage is applied between the anode and cathode, the SCR is not turned on and only small leakage current flows in the anode. As the voltage between the anode and cathode (VAK) is increased to a specified value called VBO, the SCR is turned on and a large amount of current flows in the anode. The VBO is known as the forward break over voltage of the SCR at IG = 0. The value of VBO depending n the values of internal transistors and PRV value is given by VBO = PRV(1 - 1 - 2)1/n ……………………… (7-1) Where n is constant and lies between 2 and 3 for a silicon material. From Eq. (7-1), it is seen that the magnitude of VBO should be slightly smaller than the PRV rating for an ideal SCR. In practical applications, these two values are usually considered as the same. Consider the SCR conducting in its forward conduction region. A decrease in the anode voltage VAK will cause the anode current to decrease, as indicated on the line a of Fig. 7-3. When the anode current is smaller than the current value at point P, the SCR is therefore turned off. The current value at P is called the holding current, IHO, which is the minimum anode current to maintain the SCR in on state.
  • 4. Fig. 7-4 SCR output characteristics with variable gate current The SCR characteristic curve in Fig. 7-3 is plotted with the gate open. If the external signal is applied to the gate, the gate current will change the forward break over voltage of the SCR. As shown in Fig. 7-4, an increase in IG will cause the VBO to decrease. That is, the greater the IG, the smaller the VBO. In other words, the magnitude of gate current determines the voltage to fire the SCR. SCR Triggering Characteristics From the characteristics of the SCR mentioned above, it can be seen that two conditions must be met to fire the SCR. They are: (1) Anode voltage should be positive with respect to the cathode; (2) Gate voltage should be positive with respect to the cathode. We have found that successful gate triggering depends on the satisfaction of three conditions: (1) Trigger current and voltage must be within the triggering area; (2) Power dissipation in gate circuit should be minimized; (3) Trigger signal must be properly timed. SCR Gate Triggering Three basic types of gate triggering signals are usually used. These are dc signals, pulse signals and ac shift signals. However, the pulse triggering is the most popular type. DC Triggering DC triggering signal is rarely used in practical SCR applications. The circuit of Fig. 7-5(a) shows an SCR operating with dc supply and dc triggering signal. When switch S is closed, a sufficient gate current causes the SCR to turn on. The current- limiting resistor R is used to ensure the gate dissipation within its rating. This circuit acts as a dc switch, which uses a low power signal to control a high power load. If a
  • 5. high power load such as a power relay is used, this circuit can control an ac power with a dc signal. Fig. 7-5 DC triggering circuits Fig. 7-5 (b) shows the SCR circuit operating in ac supply and dc triggering. The SCR conduct in the positive half cycle of ac supply voltage and cuts off in the negative half cycle. Therefore the maximum conduction angle of the SCR is 180o . During the positive half cycle, the diode X1 is forward-biased and thus the gate current turns on the SCR. The gate current is controlled by the variable resistor in gate circuit. By adjusting the resistance value the firing angle can be changed between the limits of 0 and 90o . Pulse Triggering The gate-to-cathode junction of the SCR us essentially a PN junction. Whenever voltage is applied at the junction such that a forward bias is achieved, current flows across the junction and power is dissipated in the form of heat. Gate power dissipation can be minimized by using a pulse triggering source rather than a continuous signal. Fig. 7-6 Waveforms in ac-controlled SCR circuit
  • 6. Fig. 7-6 shows the relationship of the line voltage, anode voltage and triggering pulses in an ac-controlled SCR circuit. One precaution that must be taken in applying pulse sources at the gate of the SCR is that the reverse bias limit of the gate is not exceeded. A common technique for limiting the negative voltage at the gate is to clamp the gate to the forward drop across a diode. This technique is illustrated in fig. 7-7. If a negative voltage is applied at the gate, the clamping diode conducts and limits the gate voltage to approximately -0.7V. Fig. 7-7 Clamping the gate reverse bias with a rectifier diode Fig. 7-8 Relationship among td, tr, and ton The application of a gate pulse to the gate of an SCR does not result in the anode current. Initially, there is no significant increase in the anode current, this interval is known as the delay time td, which is defined as the time interval between the point where the gate current rises to 10 percent of its final value and the instant when the device current has risen to 10 percent of the final value of anode current. Similarly, the rise time tr is the time interval between when the anode current has increased from 10 percent to 90 percent of its final value. The turn-on time ton is equal to td+tr. and is approximately 2 s. The relationship among t d, tr and ton is shown in Fig. 7-8.
  • 7. Turn-on of SCR An SCR may be triggered into conduction by: (1) applying a positive triggering signal to the gate; (2) exceeding the anode forward blocking voltage VFOM or VDRM; (3) exceeding the maximum allowable temperature; (4) excessive rate of change of anode voltage dv/dt. The above methods of items (2), (3) and (4) are not used in normal operation since the SCR might be damaged. In either case, the designer must be sure that the current flow in the anode circuit does not increase too rapidly to the SCR might be damaged. The maximum di/dt is usually specified by device manufacturers in amps per microsecond, A/ S. The inductance inherent in many industrial loads such as motors and transformer tends to limit the rate of change of current in the anode circuit depending on the time constant L/R. If the load is highly resistive, then switching an SCR at high voltages could result in excessive di/dt due to the extremely short rise time of the SCR (typically 1~2 S). In such cases, an inductor is frequently connected in anode circuit to limit di/dt as shown in Fig. 7-9. Fig. 7-9 External inductance in the anode circuit to limit di/dt An effective approach to suppress dv/dt is to use an RC snubber network in parallel with the SCR, as shown in Fig. 7-10. The capacitor C absorbs the excess transient energy and the resistor R1 (100 typical) limits the current. Fig. 7-10 RC snubber network for dv/dt suppression
  • 8. Turn-off of SCR As mentioned above, the gate has no control over the SCR once it goes into conduction. Turn-off must be achieved in the anode-to-cathode circuit. There are three ways in which turn-off, or commutation as it is commonly called, can be achieved by: (1) reversing the anode-to-cathode voltage; (2) reducing the anode current below the holding current level; (3) forcing current in the anode circuit in the reverse direction. When a sinusoidal voltage source is used, turn-off of the SCR occurs automatically at the end of each positive half cycle of applied voltage. When a dc or unidirectional voltage source is used, the anode current must be interrupted or a passive energy storage element is used to attempt to force current through the anode circuit in the reverse direction, which reverses the anode voltage. Since the SCR is a PNPN junction semiconductor structure, a minimum time is required for the charges to reverse at the junction after conduction has been interrupted. This time interval is called the turn-off time of the SCR. The manufacturer will specify the minimum turn-off time toff for each SCR under specified operating conditions. If forward voltage is applied to the anode before the turn-off time is expired, the SCR will go into conduction without a gate trigger signal. The turn-off time toff for SCRs is typically 10 to 100 S. Testing SCR with Ohmmeter 1. Set the range selector of ohmmeter to R x 100. Connect the black led to G and the red lead to K. A low resistance reading should be indicated by the pointer. Reversing the polarity, the reading is infinite. In most cases, the anode of SCR is internally connected to heat sink. 2. With gate open, set the range selector of the ohmmeter to Rx1 position, and connect the black lead to the anode A and the red lead to the cathode K. the resistance reading should be infinite. At this time extend the black lead from the anode to the gate, the reading should indicate a low value. Retract the black lead from the gate and the reading should remain. 3. The above steps can be used to identify terminals and test an SCR with an ohmmeter. In general, a standard VOM at R x 10 (15mA) range is suitable for measuring the SCR whose holding current is less than 15mA. To measure the SCR having a holding current greater than 15mA, the range of Rx1 (150mA) should be used. 4. When testing the characteristics of gate triggering, the magnitude of the gate current must be considered. If the supplied gate current is too small, the resistance between the anode and cathode will return to infinite when the black lead is retracted from the gate in step 2. The gate voltage and current can be read from the LV and LI scales on VOM, respectively.
  • 9. Description of Experiment Circuit As shown in Fig. 7-11, the experiment circuits contains two major section: dc triggering and ac phase shift triggering. In dc triggering section, when the gate voltage of SCR is 0V (VR1=0 ), the SCR is off. If the increase in resistance of VR1 rises the gate voltage VG to reach a sufficient level, the SCR will turn on. Once the SCR turns on, the gate voltage is not able to turn off it. The basic RC network, (VR2+R5) and C3, performs the function of ac phase shifting. As mentioned above, the RC phase shift network varies the firing angles between 0 and 90 degrees. The triggering angle can be calculated by the equation = tan-1R C. To extend the range of firing angles to 180 degrees, the bridge RC network must be used. The OPAMP U1 is used as a differential amplifier to amplify the differential output of bridge network.
  • 11. Equipment Required 1 – Power Supply Unit IT-9000 1 – Module IT-9003 1 – Analog Multimeter 1 – Dual-Trace Oscilloscope Procedure 1. 1. Set the range selector of the ohmmeter to Rx1 position. Connect the black lead to terminal A and the red lead to terminal G. Read and record the reading indicated by the pointer. RAG = . Reversing the leads, RAG = . 2. Connect the black lead to terminal G and the red lead to terminal K. Read and record the reading indicated by the pointer. RGK = . Reversing the leads, RGK = . 3. Connect the black lead to A and the red lead to K. Read and record the reading indicated by the pointer. RAK = . Reversing the leads, RAK = . 4. Connect the black lead to A and the red lead to K. Connecting G to A with a wire, read and record the resistance reading indicated by the pointer. RAK = . The SCR is (go or no go). Read and record the voltage reading on LV scale as the forward voltage drop between the anode and cathode. VAK = V. 5. Connect 12V, +15V, -15VDC and 18VAC power supplies to Module IT-9003. Place the 12-V lamp in RL socket. 6. Draw a circuit diagram by connecting points as shown in Fig 7-11. Turn VR1 fully CCW. 7. Observe and record the state of RL Using the voltmeter, measure and record the anode and gate voltages. VA = V VG = V The SCR is operating in (on or off) state. 8. Slowly turning VR1 to the right, observe and record the change of VG. When the lamp lights, measure and record the gate voltage.
  • 12. VG = V The SCR is operating in (on or off) state. 9. Using the voltmeter, measure and record the anode voltage of the SCR. This voltage is the forward voltage drop (VF) between the anode and cathode of the SCR. VF = V 10. Turn VR1 fully CW. Observe and record the states RL and SCR. Turn VR1 fully CCW. Observe and record the states of RL and SCR. Explain the changes. 11. Remove the connect plug from position 1 and then insert it back. Observe and record the states of RL and SCR.
  • 14. 12. Draw Circuit diagram by making connection as in fig 7-12. Using the oscilloscope, measure the voltage waveform across RL. Turning VR2, observe and record the changes of the SCR conduction angle and lamp brightness. 13. Turn VR2 to get maximum conduction angle. = degrees. Using the oscilloscope measure and record the voltage waveforms of VG and UK in Table 7-1. Table 7-1 VG VK
  • 16. 14. Draw a circuit diagram by connecting points as shown in Fig 7-13. Using the oscilloscope, measure the voltage waveform across RL. Turning VR2, observe and record the changes of the SCR conduction angle and lamp brightness. 15. Adjust VR2 to get the conduction angle of 90 degrees. Measure and record the voltage waveforms of VG and VK in Table 7-2. Table 7-2 VG VK
  • 18. 16. Now remove connection from diode and make connection as in fig 7-14. Observe and record the changes of VG and VK. Conclusion You have experimented the dc triggering and ac phase shift triggering for the SCR. When an SCR operates in dc voltage, a dc voltage to the gate will turn on the SCR. The conducting SCR remains in on state even the gate signal is removed. When ac voltage is applied, the SCR is turned on by the gate triggering signal and is automatically turned off when the applied ac voltage reduces to zero voltage on each half cycle. Signature of Subject Engineer:
  • 19. EXPERIMENT 02 Date_____/______/____________ SCR PHASE CONTROL Objective 5. Understanding the principle of phase control. 6. Understanding the operation of RC phase control circuit. 7. Studying the application of UJT relaxation oscillator in SCR phase control. Discussion The basic purpose of industrial electronic controls is to regulate the transfer of energy from a source to a load. It may be a weld control to control to control the conversion of electrical energy to heat; it may be a motor control to control the conversion of electrical energy to mechanical force; or it may be a safety alarm to convert electrical energy to sound. If the energy transfer is at a constant rate, then the control may be as simple as an ON-OFF switch. Quite often it is necessary to adjust the rate of energy transfer to control the output, such as speed of a motor, loudness of an alarm, or brightness of a lamp. The most convenient way to control the rate of energy transfer from an ac source is to control the portion of each cycle that current is allowed to flow into the load. This is accomplished in SCR and TRIAC circuits by controlling the phase angle at which the thyristor is turned on during each cycle of the ac voltage. The technique is called phase shift control. Basic Phase Control Circuits There are many forms of phase control possible with the thyristor, as shown in Fig. 8-1. The simplest form is the half-wave control of Fig. 8-1(a) which uses one SCR for control of current flow in one direction only. This circuit is used for loads which require power control from zero to one-half of full-wave maximum and which also permit (or require) direct current. The addition of one rectifier diode D, Fig. 8- 1(b), provides a fixed half-cycle of power which shifts the power control range to half-power minimum and full-power maximum but with strong dc component. The use of two SCRs, Fig. 8-1(c), controls from zero to full-power and requires isolated gate signals, either as two control circuits or pulse-transformer coupling form a single control. Equal triggering angles of the two SCRs produce a symmetrical output wave with no dc component. Reversible half-wave dc output is obtained by controlling symmetry of triggering angle. An alternate form of full-wave control is shown in Fig. 8-1(d). This circuit has the advantage of a common cathode and gate connection for the two SCRs. While the two rectifiers prevent reverse voltage from appearing across the SCRs, they reduce circuit efficiency by their added power loss during conduction.
  • 20. Fig. 8-1 Basic types of AC phase control Fig. 8-2 SCR power control with RC phase shift circuit
  • 21. The most flexible circuit, Fig. 8-1(e), uses one SCR inside a bridge rectifier and may be used for control of either ac or full-wave rectified dc. When an AC load is used, it must be connected between ac voltage and bridge rectifier. If a DC load is desired, it should locate at the dotted block in Fig. 8-1(e). Losses in the rectifiers, however, make this the least efficient circuit form, and commutation is sometimes a problem. By far the most simple method of controlling AC power is the use of the bi- directional triode thyristor, the TRIAC, as shown in fig. 8-1(f). We will discuss the operation of this circuit in the description of experiment circuit section. Fig. 8-3 shows the UJT-SCR phase control circuit used in this experiment. The bridge rectifier, D1 to D4, provides a pulsating dc form the 18V ac voltage. Zener diode ZD1 clamps the pulsating dc voltage at 12V for the relaxation oscillator. Resistor R1 protects the zener form over-current damage. When no gate triggering pulse is applied to the gate of SCR, the SCR is in off state and lamp is off. If the UJT relaxation oscillator operates, the pulses at base one will trigger the SCR to conduction at each positive half cycle, the current thus flows through the lamp. The load power is controlled by the conduction angle of SCR. In short, the load power is inversely proportional to the period of triggering pulse.
  • 23. Equipment Required 1 – Power Supply Unit IT-9000 1 – Module IT-9002 1 – Oscilloscope Procedure (3) Locate the UJT trigger SCR shift control circuit, shown in Fig. 8-3, on Module IT-9002. Apply 18V AC voltage to this circuit from Power Supply Unit IT-9000. (4) Draw a circuit diagram by connecting points as shown in Fig 8-3. Rotate the VR1 fully CCW to get the minimum resistance. (5) Using the oscilloscope, measure the voltage waveform across the zener diode ZD and record the result in Table 8-1. Table 8-1 (4) Using the oscilloscope, measure the voltage waveforms at the B1 of UJT and across the anode-cathode (A-K) of SCR, and record the results in Table 8-2. Observe and record the brightness of lamp. Table 8-2 (5) Set the VR1 to the midposition. Repeat step 4 and record the results in Table 8-3. Observe and record the brightness of lamp.
  • 24. Table 8-3 (4) Rotate the VR1 arbitrarily and observe the waveform of VAK and the brightness of lamp. Record the variations of Lamp brightness and triggering angle.
  • 26. 5. Make connection as in fig 8-4. Repeat steps 4 and 5. 6. Rotate the VR1 arbitrarily and observe the waveform of VAK and the brightness of lamp. Record the variations of lamp brightness and triggering angle. Compare and comment the difference between this result and the result of step 6.
  • 28. 2. Make connection as shown in fig 8-5. Repeat steps 4 and 5. 3. Turn the VR1 arbitrarily and observe the waveform of VAK and the brightness of lamp Record the variations of lamp brightness and triggering angle. Compare and comment the difference between this result and the result of step 8. Conclusion In this experiment we found that as VR1 varies, the period of oscillation of UJT relaxation oscillator varies so the conduction angle of SCR will vary. The emitter voltage of UJT is a sawtooth wave and B1 voltage is the triggering pulse for SCR. Signature of Subject Engineer
  • 29. EXPERIMENT 03 Date: _____/______/____________ PUT-SCR POWER CONTROL Objective 3. Understanding the operation of a PUT-SCR Power control circuit. 4. Constructing and measuring the automatic light control circuit. Discussion The PUT is flexible and suitable for the use of relaxation oscillator or delay circuit since its important parameters are programmable. The SCR is an ideal ac power switch. With appropriate gate triggering techniques, the SCR performs excellent control function in ac power circuits. In this experiment, we combine the PUT and SCR to form an ac power control circuit. Fig. 9-1 shows the PUT-SCR ac power control circuit. The power applied to the PUT oscillator is a pulsating dc voltage with the peak limited by zener diode. The pulsating dc that comes from 18-V ac input voltage followed by bridge full- wave rectifier D1-D4 is used to synchronize with ac line input.
  • 31. The PUT acts as a relaxation oscillator. When the gate voltage VG is fixed, the PUT switches on it its anode voltage is greater than VG plus VT. The anode voltage is the capacitor voltage determined by the charging current and RC timing network. The capacitor charges through R2 and VR2. When the capacitor voltage reaches the value of VP, the PUT turns on and then a positive pulse is developed on R6. The positive pulse is applied to the gate of SCR to fire the SCR. The RC time constant network determines the period of oscillation, which controls the firing angle of the SCR. In other words, the longer the time constant, the larger the firing angle becomes. Since the load is a lamp, the conduction angle of the SCR determines the power delivered to the load and the brightness. The CDS connected to the gate of the PUT is used to vary the gate voltage according to the light level. When the CDS is exposed to different light levels, the different gate voltages determine the variation of the firing angle and therefore the brightness of lamp is controlled by the light level. Equipment Required 1 – Power Supply Unit IT-9000 1 – Module IT-9002 1 – Oscilloscope 1 – Multimeter 1 – 20-W Lamp Procedure Connect ac power supplies 18Vac and 110Vac from Power Supply Unit IT-9000 to Module IT-9002. 5. Install the 20-W lamp in the socket on IT-9002. Turn VR1 fully CW. Draw a circuit diagram by connecting points as shown in Fig 9-1. Now locate these components on the Module and complete the circuit diagram by connecting the components using the leads with 2mm male pins. 6. Observe and record the state of LP. Using the multimeter, measure and record the gate voltage of the PUT. VG = V. 8. Slowly turning VR1 to the left, observe and record the state of LP. Stop VR1 at midpoint. Using the oscilloscope, measure and record the voltage waveform at the anode of PUT in Table 9-1.
  • 32. Table 9-1 9. Measure and record the voltage waveforms of PUT cathode and SCR anode in Table 9-2. Table 9-2 10. Turn VR1 fully CCW. Observe and record the change of LP brightness. Measure and record the voltage waveform of PUT anode in Table 9-3.
  • 33. Table 9-3 12. Measure and record the voltage waveforms of PUT cathode and SCR anode in Table 9-4. Table 9-4 13. Turn VR1 randomly. Observe and record the change of LP brightness. Is the power on the load controlled VR1?
  • 35. 16. Turn VR1 fully CW. Make connection as in fig 9-2. Repeat steps 3 and 4 and record the result in Table 9-5. Table 9-5 9. Repeat step 5 and record the results in Table 9-6. Table 9-6 10. Repeat step 6 and record the result in Table 9-7.
  • 36. Table 9-7 11. Repeat step 7 and record the results in Table 9-8. Table 9-8
  • 38. 17. Turn VR1 fully CW. make connection as in fig 9-3. Repeat steps 3 through 7. Observe and record the relationship among the waveforms. 18. Form the above steps, comment on the relationship between the capacitor and conduction angle of SCR.
  • 40. 1. Turn VR1 fully CCW. Make connection as in fig 9-4. 2. Expose the CDS to normal light level. Measure and record the gate voltage of PUT. VG = V. Adjust VR1 to keep PUT in off state before conducting. 16. Cover the CDS window with your hand. Is the lamp lighting? The PUT and SCR are (on or off). 17. Remove your hand from CDS window. Is the lamp lighting? The PUT and SCR are ( on or off) Conclusion In this experiment the PUT oscillator is used to trigger the SCR with its pulse output. The SCR controls the ac power delivered to the load with different conduction angles. The firing angle is controlled by the RC network in the anode circuit of the PUT relaxation oscillator. Adjusting either VR1 or capacitance can change the RC time constant. The longer the period, the smaller the power on load becomes. Automatic light control circuit in this experiment was built by the CDS sensor and PUT-SCR power control circuit. The CDS changes the gate voltage of PUT in the variation of light level. Therefore the power on the load is controlled by the light level automatically. Signature of Subject Engineer
  • 41. EXPERIMENT: 04 DATE:____/____/_______ TO INVESTIGATE THE PHASE CONTROL THROUGH DIAC AND TRIAC Objective 3. Understanding and measuring the characteristics of TRIAC. 4. Understanding and measuring the characteristics of DIAC. 5. Performing the DIAC-TRIAC phase control. Discussion TRIAC Characteristics The triode AC switch (TRIAC), sometimes called triggering bi-directional thyristor, is a three-terminal semiconductor device used in AC power control applications. The operation of the TRIAC in AC circuits can be considered as inverse parallel SCRs in AC circuits. Either positive or negative voltage is applied to MT2 terminal, the TRIAC can be turned on by applying the gate triggering signal. There are many types of TRIAC available in market such as low power type of RCA 2N5754 (2.4A, 100V) and high power type of RCA 40924 (80A, 600V). TRIAC Construction Fig. 11-1 TRIAC (a) structure, (b) circuit symbol The TRIAC device was developed by General Electric. Fig. 11-1 (a) shows the cross section of TRIAC. The region between terminals MT2 and MT1 is a PNPN switch in parallel with an NPNP switch. The circuit symbol of TRIAC is shown in Fig. 11-1(b). Its terminals are main terminal #2 (MT2) or anode 2, main terminal #1 (MT1) or anode 1, and gate. A practical structure of TRIAC is shown in Fig. 11-2.
  • 42. Fig. 11-2 Typical TRIAC structure (a) MT2 positive or negative, gate circuit open In this mode the junction P1-N1 and N1-P2 re reverse-biased. The TRIAC is turned off. (b) MT2 positive, positive gate current In this mode the TRIAC behaves strictly like an SCR. Active parts are P1- N1-P2-N2 and the gate current flows through G-P2-N2-MT1. (c) MT2 positive, negative gate current Operation is analogous to the junction gate thyristor. P1-N1-P2-N2 is the main structure, with N3 acting as the junction gate region (d) MT2 negative, positive gate current P2-N2 is forward biased and injects electrons, which are collected by P2-N1. P2-N1 becomes more forward biased. Current through the P2-N1-P1-N4 portion increases and this section switches on. This mode, too, is also analogous to remote gate operation. (e) MT2 negative, negative gate current Remote gate mode, P2-N1-P1-N4 is the main structure, with junction P2-N3 injecting electrons, which are collected by the P2-N1 junction. TRIAC Characteristics The TRIAC performs the function of the inverse parallel SCRs configuration. Fig. 11-3(a) shows the anode characteristic of the TRIAC under zero gate current condition. The TRIAC will block voltage of either polarity so long as the magnitude of the voltage is less the forward break over voltage, VBOR or VFOM. The anode current is limited to a very low leakage level, usually less than a few milliamperes under forward blocking conditions. There is no reverse voltage specification for the TRIAC. Parameters VFOM, PFV, VDRM, and VBR are defined exactly the same as SCR specifications.
  • 43. Fig. 11-3 TRIAC anode characteristics From Fig. 11-3(b), it is found that the voltage applied to the gate of TRIAC has no limitation in polarity. The breakover voltage reduces as the gate current increase. The control of firing angle for a TRIAC on each half cycle of ac source is similar to the SCR. Fig. 11-4(a) is a typical TRIAC control circuit. Fig. 11-4(c) shows the load current waveform, the conduction angle , and the firing angle . The total conduction angle is the sum of 1 and 2. Fig. 11-4 (a) Typical TRIAC control circuit (b) AC source, (c) load current with a resistive load The operation of TRIAC is similar to two SCRs connected in reverse parallel. An operation summary of the TRIAC is indicated below: (1) With the gate open, the TRIAC will be in off-state as long as the MT2-to-MT1 voltage is less the forward break over voltage. (2) When MT2-MT1 voltage is over 1.5volts, the TRIAC can be triggered to conduct by applying a gate triggering signal. (3) The gate signal can not control the TRIAC operating in on state. (4) One method to turn off the TRIAC is to reduce the MT2 current below the holding current IH, typically a few microamperes. TRIAC will turn off at the end of each half cycle in AC circuits.
  • 44. (5) The gate signal to turn TRIAC on has no limitation in polarity. The magnitude of triggering current depends upon the polarity of triggering voltage. (6) The MT2-to-MT1 voltage reduces to a small value of about 1.5V when TRIAC turns on. Triggering Characteristics of TRIAC The difference between TRIAC and SCR triggering is in the polarity of gate triggering signals. The SCR is triggered by applying a positive gate signal when the anode voltage is positive. The TRIAC can be triggered under four gate conditions: (1) I+ : MT2 positive, VG positive (2) I- : MT2 positive, VG negative (3) III+: MT2 negative, VG positive (4) III- : MT2 negative, VG negative Fig. 11-5 shows the typical triggering requirements for TRIAC. The gate currents required triggering a TRIAC in I+ and III- modes are equal; That is, the same gate current is required when the gate and MT1 voltages are in the same polarity. Notice that the gate current required to trigger in the I- and III+ modes is higher than the gate current required to trigger in the I+ and III- modes under the same conditions. The significance of this property is that given a symmetrical gage triggering source, either I+ and III- and I- and III+ modes should be used in order to get symmetrical triggering. Other combinations will result in 1 being different than 2 and asymmetrical load current. Fig. 11-5 Gate trigger current requirements The turn-on time of TRIAC, typically 10 s, like that of SCR, slightly varies with the amount of the gate triggering current. That is, the greater the gate current, the smaller the turn-on time.
  • 45. DIAC Construction and Characteristics The di-electrode AC switch (DIAC) is a three-layer NPN semiconductor device used as a trigger device for TRIAC in AC circuits. The circuit symbols and structure are shown in Fig. 11-6. Fig. 11-6 DIAC (a) and (b) circuit symbols, (c) NPN structure Fig. 11-7 shows the V-I characteristics of the DIAC. When the voltage applied to terminals is less than the breakover VBO, the DIAC is off and can be considered as open. If the applied voltage reaches VBO, the DIAC will turn on and the voltage drop between two terminals will reduce to about 10V. The VBO value of the DIAC lies between 20V and 40V. Fig. 11-7 DIAC characteristic Two Transistors Simulating DIAC Two-transistor configuration can be used to simulate the operation and characteristics of the DIAC. We first recall and focus on the breakdown characteristics of conventional BJTs as follows. VCBO: The collector-to-base reverse breakdown voltage with the emitter open, shown in Fig. 11-9(a), is the maximum breakdown voltage of transistor (see Fig. 11- 8). When breakdown occurs, the characteristic is like a zener diode.
  • 46. Fig. 11-8 Comparison among breakdown voltages of transistor VCEO: The collector-to-emitter breakdown voltage is measured with the base open as shown Fig. 11-9(b). As shown in Fig. 11-8, the value of VCEO is less than the value of VCBO. VCES: The collector-to-emitter breakdown voltage is measured with the base and emitter connected together as shown in Fig. 11-9(c). VCES VCBO. VCER: The collector-to-emitter breakdown voltage is measured with connecting a resistor in parallel between the base and emitter terminals. As shown in Fig. 11-8, when the applied voltage reaches VCBO, the first breakdown occurs and then the voltage reduces to VCEO: called the second breakdown as the current increases. This characteristic is the same as that of DIAC. The magnitude of VCER depends upon the resistance between the base and emitter. For a large R the VCER is close to VCEO and is close to VCES for a small R. Fig. 11-9 Measurements of breakdown voltages Two NPN transistors connected as shown in Fig. 11-10 form a simulating circuit of DIAC. The V-I characteristics are similar to the DIAC. The breakdown voltage VCBO of transistors should be less than 30 volts.
  • 47. Fig. 11-10 Two-transistor configuration to simulate DIAC DIAC Operation and Testing The DIAC with negative resistance characteristic can be used in relaxation oscillator circuit. As shown in Fig. 11-11(a), the DIAC acts as neon tube. When the capacitor voltage is less than the breakover voltage of DIAC, the DIAC is off and the capacitor charges through the resistor R. If the capacitor voltage reaches VP, DIAC turns on and the capacitor discharges through DIAC. When the capacitor voltage reduces to Vv, DIAC returns to off and a complete cycle is finished. The voltage waveform is shown in Fig. 11-11(b). Fig. 11-11(c) shows the voltage waveform when the applied voltage is in reversal polarity. (a) DIAC relaxation oscillator (b) Voltage waveform with +V applied (C) Voltage waveform with –V applied Fig. 11-11 DIAC relaxation oscillator
  • 48. Testing a DIAC with an ohmmeter is made as shown in Fig. 11-12. Since the internal battery voltage is less than VBO of DIAC, the resistance reading indicated by the pointer is always infinite whenever the polarities are. Fig. 11-12 Testing DIAC with ohmmeter Description of Experiment Circuit
  • 50. Fig. 11-13 shows the circuits used in the experiment. We will use the upper circuit to perform the characteristic measurements of DIAC and TRIAC. The characteristics of DIAC and TRIAC have been introduced above in detail. The variable resistor VR2 is used to vary the dc voltage to the gate of the TRIAC for plotting the V-I curve. D1 and C1 are used to supply a dc voltage to the DIAC from 36-Vac voltage. VR1 is to control the charging current to capacitor C2. The lower circuit is a DIAC-TRIAC phase control circuit. As mentioned above, this circuit has a disadvantage of hysteresis phenomenon. R9 and C4 are used to improve the effect. Equipment Required 1 – Power Supply Unit IT-9000 1 – Module IT-9003 1 – Oscilloscope Procedure 1. Connect 36VAC supplies from Power Supply unit IT-9000 to Module IT- 9003. The 36VAC is supplied by connecting two 18VAC supplies in series. 2. Draw a circuit diagram by connecting points as shown in Fig 11-13. Now locate these components on the Module and complete the circuit diagram by connecting the components using the leads with 2mm male pins. Set the oscilloscope to X-Y mode. Connect CH1 input to AC0V terminal, GND to the other terminal of load R2, and CH2 input to AC36V terminal. Adjust scope controls to indicate the V-I characteristic on scope display and plot it in Table 11-1. Table 11-1 3. From the V-I curve, DIAC VBO = volts,. the voltage between two anodes = volts.
  • 52. 4. Turn off the power. Make connection as in fig 11-14. Turn on the power. Measure and record the capacitor voltage of C1 using the multimeter. VC1 = V 5. Set VR1 to its midposition. Using the oscilloscope, measure and record the voltage waveform across the capacitor C2 in Table 11-2. 6. From Table 11-2, DIAC VP = volts; VV = Volts.
  • 54. 7. Make connection as in fig 11-15.Connect DC 12V supply from Power Supply unit to Module IT-9000. 8. Set scope to X-Y mode. Connect GND to TRIAC T2 terminal, CH1 input to the other terminal of load R7, and CH2 input to TRIAC T1 terminal. Adjust scope controls to display V-I characteristic curve and plot the curve in Table 11-1. 9. Turning VR2, observe and record the change of V-I characteristic. Table 11-2 10. Plot two V-I curves for VBO = 0V and VBO = 0V in Table 11-1 and mark the voltage and current values.
  • 56. 11. Connect AC 36V from Power Supply unit to Module IT-9003. Make connection as show in figure 11.16. Turning VR3, observe and record the change of lamp brightness. Set VR3 to its mid position. Using the oscilloscope, measure and record the voltage waveforms of capacitor C3 and TRIAC2 T2 in Table 11-3. Table 11-3
  • 58. 12. Make connection as in fig 11-17. Turning VR3, observe and record the change of lamp brightness. Set VR3 to its midposition. Using the oscilloscope, measure and record the voltage waveforms of capacitor C3 and TRIAC T2 in Table 11-4. Table 11-4
  • 60. 13. Make connection as in fig 11-18. Turning VR3, observe and record the change of lam brightness. Comparing to the results of step 11, is the hysteresis phenomenon improved? Set VR3 to its midposition. Using the oscilloscope, measure and record the voltage waveforms of capacitor C3 and TRIAC2 T2 in Table 11-5. Table 11-5 Conclusion In step 2, you have observed the characteristic curve of the DIAC using the oscilloscope. The VP and VV values of DIAC are obtained from the waveform of V C2. The VR2 is used to adjust the magnitude of the gate voltage of the TRIAC1 for TRIAC characteristic measurement. That is, the greater the VR2 resistance, the greater the gate current becomes. The operation of the DIAC-TRIAC phase control circuit is similar to SCR phase control circuit. By changing VR3xC3 time constant, the conduction angle of TRIAC2 and the output power on load are regulated. The components R9 and C4 are used to improve the hysteresis phenomenon found in step 11. Signature of Subject Engineer
  • 61. EXPERIMENT 5 Dated:_______________ SCR DC MOTOR FORWARD/REVERSE CONTROL Objective 8. Understanding the construction and operation of electromagnetic relays. 9. Understanding the turn-off methods of SCRs. 10. Performing the direction of rotation control of a dc motor. Discussion SCRs with the features of unidirectional conduction and easy to control are widely used to control the direction of rotation for dc motors. Relay Applications Relays are electrically operated switches. Relays, with the features of amplification and remote control and signal conversion, are widely used in modern industrial electronic circuits as remotely controlled mechanical switches to turn on or off a sequence of events. An electromagnetic relay utilizes a current through a coil winding to provide a magnetic field that moves the switch contacts. If the current in the coil is sufficient, the magnetic force attracts the armature that moves the movable contact until it touches the stationary contact. If the current is disappeared from the coil, the movable spring moves the movable contact apart from the stationary contact. The mechanical construction and appearance of an electromagnetic relay are shown in Fig. 10-1. It consists of the armature, yoke, coil, core, contacts, springs. The housing either plastic or metal is used to protect the relay against the damage of foreign objects and the interference of electromagnetic field. The commonly used circuit symbols of relays are shown in Fig. 10-2. Either circle or rectangle in Fig. 10-2(a) represents the relay coil. The normally open contacts are often abbreviated NO as shown in Fig. 10-2(b). The NO contacts will make when the coil is energized. The normally closed contacts (NC), shown in Fig. 10-2(c), will break when the coil is energized. Combination of two stationary contacts and one movable contact which engages one stationary contact when the coil is energized and the other stationary contact when the coil is not energized is called a single-pole double-throw (SPDT) relay as shown in Fig. 10-2(d). The movable contact is called common contact abbreviated as C. The normal contact (N) is NC and the transfer contact (T) is NO.
  • 62. Fig. 10-1 Electromagnetic relay Fig. 10-2 Circuit symbols of relay There are three popular driver circuits to control the operation of relay. Theses are: (1) DC source driving Applied a dc voltage to the relay coil will energize the relay as shown in Fig. 11-3(a). The applied voltage and current must be within the ratings. (2) Transistor driving Fig. 10-3(b0 shows a transistor driver used to energize the relay. The control signal is applied to drive the transistor to conduct. The conducting transistor provides sufficient current tot energize the relay. (3) Thyristor driving The thyristor such as an SCR can be used to drive a relay in dc circuits as shown in Fig. 10-3(c). In this application a reset switch is often necessary to turn the SCR off.
  • 63. Fig. 10-3 Relay drivers In most applications relays are used in electronic circuits as remotely controlled mechanical switches used to control a large current load which is isolated with the signal conditioning circuit. Fig. 10-4 shows an automatic light control circuit which consists of a relay, CDS, and transistor R and CDS form a voltage divider to provide a bias to the base of transistor Q. The value of R is designed to equal ten times CDS resistance in normal light level. This arrangement causes the transistor off in daylight so that the lamp off. At night, CDS resistance increases to apply a forward bias driving the transistor to conduct. The collector current through relay coil energizes the relay and the common contact is transferred to NO contact so that the lamp lights. To reverse the direction of rotation of a dc motor, it is simply to reverse that polarity of applied voltage to the motor. In our experiment circuit we use two electromagnetic relays to switch the polarity of applied voltage. Fig. 10-5 show a typical electromagnetic relay with SPDT contacts. When the relay coil has no current flow, COM contact connects to NC contact. If a sufficient current flows though the relay coil, the COM contact is pulled to touch with NO contact. Therefore the relay acts as a switch. Fig. 10-4 Automatic lamp control circuit
  • 64. Fig. 10-5 Electromagnetic relay Turn-off of SCR The turn-off methods of the SCR are discussed in experiment 7. Fore convenience we summarize these turn-off methods as follows. (6) Reduce the anode-to-cathode current IAK below the holding current IH. (7) Short-circuit the anode and cathode terminals. (8) Open-circuit the anode-cathode loop. (9) Reverse the anode-to-cathode voltage. (10)Use self-commutation technique. In Fig. 10-6, when neither SCR is conducting, there is virtually no charge on the capacitor C. if a triggering pulse is applied to the gate of the SCR1 current flows through RL, R1 and SCR1. Current also flows through R2, C, and SCR1 to charge the capacitor with the polarities of positive at the right-hand side and negative at the left-hand side. When a gate triggering pulse is applied at the SCR2, SCR2 conducts – dropping its anode voltage to approximately 1V. The capacitor voltage is then placed across the anode to cathode of SCR1. This reverse anode-to-cathode voltage causes SCR1 to turnoff. The capacitor discharge path is then RL, R1, and SCR2. Current flows through R1 and SCR2 to charge the capacitor to the opposite polarity. The circuit is now ready for a gate triggering signal at SCR1 and the cycle repeats. Fig. 10-6 SCR self-commutation technique
  • 65. Description of Experiment Circuit Fig. 10-7 shows a dc motor forward/reverse control circuit. The SCR self- commutation technique is used in this circuit to control the direction of rotation for a dc motor. When the instant the dc power is applied, SCRs are off and relays are off. The dc motor does not run since its two terminals are grounded through relay’s NC contacts. If the light to CDS1 is blocked, the resistance of CDS1 increases to turn SCR1 on and RELAY on. The COM1 transfer to NO1 contact, hence the dc motor runs in forward direction. The capacitor C1 charges through RELAY2 coil and SCR1. The negative charges are at the left terminal of C1. When the light to CDS2 is blocked, SCR2 begins to conduct and the negative potential at SCR1 anode turns SCR1 off. The on SCR2 energizes RELAY2 and hence COM2 transfers to NO2 contact. Therefore the dc motor runs in reverse direction. The SW switch is used to stop the motor by moving switch in downward position.
  • 67. Equipment Required 1 – Power Supply Unit IT-9000 1 – Module IT 9004 1 – Multimeter Procedure (5) Connect DC12V power supply from Power Supply Unit IT-9000 to Module IT 9001. (6) At this time the SCR should be off. Observe and record the state of LED. Using the multimeter, measure and record the anode-to-cathode voltages of SCR1 and SCR2. VAK1 = V; VAK2 = V Record the state of each SCR. (6) Using the multimeter, measure an record the voltages at COM contacts of RELAY1 and RELAY2. VCOM1 = V; VCOM2 = V 4. Using the multimeter, measure and record the voltages across CDS1 and CDS2. VCDS1 = V; VCDS2 = V Record the state of each SCR. (5) Expose CDS1 to high light level. Measure the voltage across CDS1 using the ohmmeter. Is this voltage changed? Measure the anode-to-cathode voltage of SCR1. Is SCR1 on or off? Cover CDS1 window with your hand. Observe and record the state of relay. Remove your hand from CDS1 window. Measure the voltage across CDS1 using the ohmmeter. Is this voltage changed? Measure the node-to-cathode voltage of SCR1. Is SCR1 on or off? Measure and record the voltage at point COM1. Does LEDf2 light? (6) Using the multimeter, measure and record the voltage across the capacitor C1. VC1 = V The polarity of VC1 at the anode terminal of SCR1 is (positive or negative). 7. Cover CDS2 window with your hand. Does the LED2 extinguish?
  • 68. Does the LED1 light? Using the multimeter, measure the voltage across CDS2 and VAK of SCR2. Is SCR2 on? Measure VAK of SCR1. Is SCR1 off? VCOM1 = V; VCOM2 = V Remove your hand from CDS2 window. Observe and record the state of SCRs. 8. Using the multimeter, measure and record the capacitor voltage. The polarity of capacitor voltage at SCR2 anode terminal is (positive or negative). VC = V 7. Cover CDS1 window with your hand. Does the LED1 extinguish? Does the LED2 light? Cover CDS2 window with your hand. Does the LED2 extinguish? Does the LED1 light? 8. Press S1 S1 to stop motor. Do the LED2 extinguish? To start motor, cover any CDS with your hand. Conclusion You have experimented the operation of a dc motor control circuit for the direction of rotation. The use of CDS is just an application example in this circuit. You may use other sensors or switches to design a control circuit similar to this application. The self-commutation technique is very useful and widely used to turn off SCRs. For normal operation the commutation time of the SCR should be short to avoid SCRs conducting simultaneously. Since the commutation item of an SCR is typically 10 S, it can be ignored in this circuit. Signature of Subject Engineer
  • 69. EXPERIMENT 06 DATED: AUTOMATIC LAMP DIMMING CIRCUITS Objective 11. Understanding the operation of TRIAC and SCR phase controls. 12. Understanding the operation of DIAC-TRIAC phase control circuit. 13. Performing an automatic lamp dimming control. Discussion TRIAC Phase Control 1. RC Phase Control The TRIAC, like SCR, is often used in an AC circuit to control the power on load. A TRIAC can operate in full-wave phase control circuits while an SCR can operate in half-wave phase control circuits. Though the power rating of TRIACs is less than that of SCRs, it is more convenient in AC applications. Fig. 12-1 Basic RC phase control circuit. Fig. 12-1 shows a basic RC phase control circuit. The capacitor voltage VC lags behind VTT an angle depending upon RC time constant and the gate trigger level required to fire the TRIAC as shown in Fig. 12-2. On the positive half cycle of line voltage, the positive value of VC reaches the trigger level at t1 and turns the TRIAC on. The angle 1 is called the firing angle or triggering angle. This operates in I+ mode; that is, T2 positive and gate positive. On the negative half cycle, the TRIAC is triggered at t3 with a triggering angle 2. This mode is III-, or T2 negative and gate negative. Though the triggering sensitivity in mode I+ is equal to mode III-, a slight difference exists between 1 and 2, 1 2.
  • 70. Fig. 12-2 Relationship between VC and VTT in the circuit of Fig. 12-1 Fig. 12-3 Basic DIAC-TRIAC phase control circuit The most elementary form of full-wave phase control is the simple DIAC- TRIAC circuit of Fig. 12-3. When the capacitor voltage reaches the bleakover voltage VBO, the DIAC turns on and then turn the TRIAC on. Since the values of VBO+ and VBO- are nearly equal, therefore the triggering angles in positive and negative half cycles are equal as shown in Fig. 12-4. Fig. 12-4 Relationship between VC and VTT in the circuit of Fig. 12-3
  • 71. The circuit of Fig. 12-3 is widely used in lamp dimming control and fan speed control circuit. The disadvantage of this circuit is the range as firing angle less than 180 degrees. Fig. 12-5 Extended range phase control circuit To extend the range of firing angle, it is a good solution to connect two sections of RC phase shifting network in series as shown in Fig. 12-5. The capacitor CF is used to limit the value of dv/dt, and the inductor LF is to limit value of di/dt. 2. Phase Control with Pulse triggering Fig. 12-6 UJT relaxation oscillator in TRIAC phase control Fig. 12-6 shows a pulse triggering circuit for the TRIAC. The trigger pulse is generated by a UJT relaxation oscillator and coupled by the transformer to the gate of the TRIAC. Description of Experiment Circuit The circuit of Fig. 12-7 is a lamp dimming control circuit used in this experiment. A brief description is made as follows:
  • 72. The DIAC is a useful trigger device for TRIAC power control applications. If the applied voltage across two terminals reaches the breakover voltage of DIAC, the DIAC is thus turned on. In the circuit of Fig. 12-7, when line voltage is applied, the capacitor C1 charges through R1 and VR1 and builds a sufficient voltage to trigger SCR or TRIAC to switch on. By adjusting VR1, the conduction angle of SCR or TRIAC can be changed to achieve the function of lamp dimming control.
  • 74. Similarly, if DIAC is used and C1 changes to reach the breakover voltage of DIAC, DIAC turns on and triggers SCR or TRIAC to conduct. R2C2 network is used to extend the range of firing angles. Diode D1 is to protect the SCR gate from the negative triggering pulse. The CDS is used to perform the function of automatic lamp dimming control. In normal light level, the trigger potential is set at a low level that can not trigger DIAC to turn on. Thus SCR or TRIAC and LP are off. When the light source is blocked, an increase in CDS resistance causes a sufficient trigger potential to turn the DIAC on SCR or TRIAC is then turn on and LP is on. Equipment Required 1 – Power Supply Unit IT-9000 1 – Module IT-9006 1 – Oscilloscope Procedure (11)Connect 110VAC power supply from Power Supply Unit IT-9000 to Module IT-9006. Install the lamp in the socket on module. (12)Make connection as shown in fig 12-7. Now locate these components on the Module and complete the circuit diagram by connecting the components using the leads with (13)2mm male pins. Repeat steps 2 and 3. Record the results in Table 12-1. Table 12-1
  • 76. (7) Make connection as shown in fig 12-8. Repeat steps 2 and 3. Record the results in Table 12-2. Table 12-2
  • 78. (7) Make connection as shown in fig 12-9. Repeat steps 7 and 8 and record the results in Table 12-3. Table 12-3
  • 80. (7) Make connection as shown in fig 12-10. Repeat steps 7 and 8. Record the results in Table 12-4. Table 12-4 9. Which of the trigger circuits is the best? Which of the power control circuits has maximum power output?
  • 82. 4. Make connection as shown in fig 12-11. Expose CDS to normal light level. Adjust VR1 to keep TRIAC in off state before conducting. 5. Observe and record the states of lamp, DIAC, and TRIAC. 6. Press and hold SW1. Observe and record the states of lamp, DIAC, and TRIAC. Conclusion You have experimented the automatic lamp dimming control. Single section of RC phase shifting control may cause a hysteresis phenomenon. This effect can be eliminated by adding a RC network in series. Since SCR conducts only during the positive half cycle of line voltage, the power delivered to the load is smaller than the TRIAC control circuit. This effect has been demonstrated by measuring the load voltages and observing the brightness of the lamp. By the way, the CDS light control circuit can be used as a streetlight control circuit. SIGNATURE OF SUBJECT TEACHER: