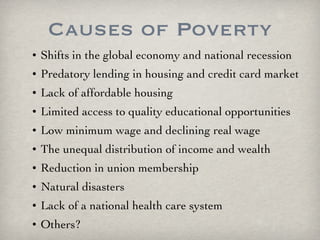
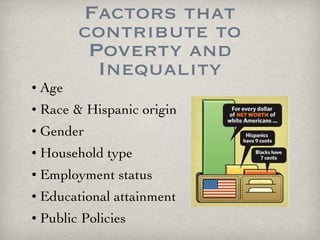
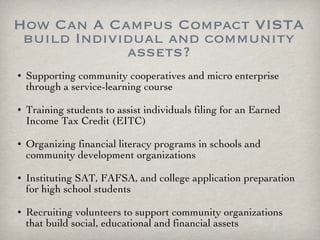
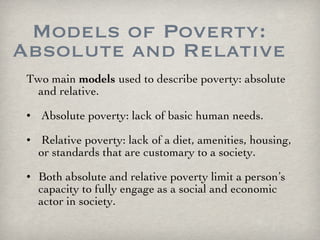
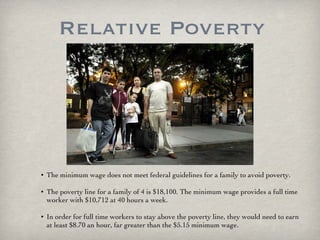
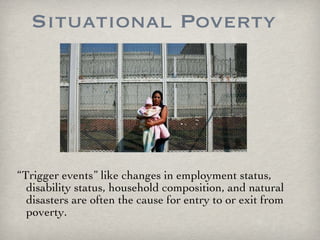
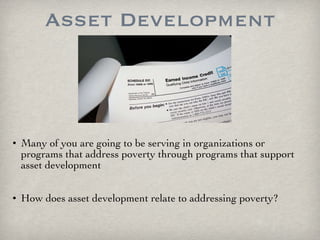
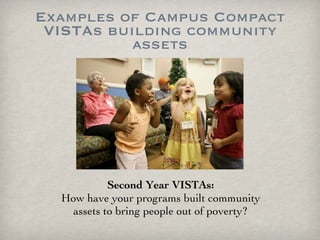
This document discusses poverty, including its causes, models, and government policies to address it. It outlines how Campus Compact VISTAs can help build individual and community assets to enhance opportunities and reduce poverty. Causes mentioned include shifts in the economy, predatory lending, lack of affordable housing, limited education, low wages, income inequality, and lack of healthcare. Models of poverty discussed are absolute, relative, and situational/generational poverty. The document suggests VISTAs can support asset development through initiatives like financial literacy programs, tax preparation assistance, and education support.
** If this presentation wins, all proceeds will go to ChristmasFuture TM **
This Christmas, change the world for good! ChristmasFuture empowers you to give a new kind of holiday gift—one that helps eradicate extreme poverty and changes the way we all think about giving.
I heard about this contest from slideshare
Presentation on Poverty and its causes as well as effects due to it to the world
► Connect with me!
• Facebook - http://goo.gl/q3KRRn
• Twitter - http://goo.gl/Jtzs1c
• Youtube - http://goo.gl/m9hJJw
Changing The Disability Poverty Paradigm(1)Allison Wohl
Check out presentation that CPSD\'s Executive Director, Serena Lowe, gave today at the NDI Real Economic Impact Tour today at the Boston Federal Reserve
The Power of Overcoming Poverty_ A Journey to Success.pdfajaymangire007
Poverty is a pervasive issue that affects millions of people worldwide. It strips individuals of their power, voice, and opportunities, trapping them in a cycle of deprivation. However, many individuals have managed to rise above their circumstances and achieve success. In this article, we will explore the inspiring stories of those who have overcome poverty and become successful. We will delve into the multidimensional nature of poverty, the specific challenges faced by different social groups, and the powerlessness and voicelessness experienced by the poor. Join us on this journey of resilience and triumph.
THE RECENT SLOWDOWN IN THE WAR ON POVERTY 50 Y.docxAASTHA76
THE RECENT SLOWDOWN IN
THE WAR ON POVERTY 50
YEARS LATER:
A PROGRESS REPORT
The Council of Economic Advisers
January 2014
2
Executive Summary
“Unfortunately, many Americans live on the outskirts of hope—some because of their poverty,
and some because of their color, and all too many because of both. Our task is to help replace
their despair with opportunity. This administration today, here and now, declares unconditional
war on poverty in America. I urge this Congress and all Americans to join with me in that effort.”
- President Lyndon B. Johnson, January 8, 1964
Fifty years ago, in January of 1964, President Lyndon B. Johnson declared a “War on Poverty”
and introduced initiatives designed to improve the education, health, skills, jobs, and access to
economic resources of those struggling to make ends meet. While there is more work to do, in
the ensuing decades we have strengthened and reformed many of these programs and had
significant success in reducing poverty. In this report, the Council of Economic Advisers presents
evidence of the progress made possible by decades of bipartisan efforts to fight poverty by
expanding economic opportunity and rewarding hard work. We also document some of the
key steps the Obama Administration has taken to further increase opportunity and economic
security by improving key programs while ensuring greater efficiency and integrity. These steps
prevented millions of hardworking Americans from slipping into poverty during the worst
economic crisis since the Great Depression.
Poverty has declined by more than one-third since 1967.
The percent of the population in poverty when measured to include tax credits and
other benefits has declined from 25.8 percent in 1967 to 16.0 percent in 2012.
These figures use new historical estimates of the Census Bureau’s Supplemental Poverty
Measure (SPM) anchored to today’s poverty thresholds. The SPM is widely
acknowledged to measure poverty more accurately than the official poverty measure,
which excludes the value of refundable tax credits and benefits like nutrition assistance
and has other limitations.
By anchoring the measure to today’s poverty standards we are able to ask how many
people in each year since 1967 would have had inflation-adjusted family resources
below the 2012 SPM poverty thresholds.
Despite real progress in the War on Poverty, there is more work to do.
In 2012, there were 49.7 million Americans grappling with the economic and social
hardships of living below the poverty line, including 13.4 million children.
While the United States is often seen as the land of economic opportunity, only about
half of low-income Americans make it out of the lowest income distribution quintile
over a 20-year period. About 40 percent of the differences in parents’ income are
3
reflected in children’s income as they become adults, pointing to strong lingerin.
FULL TITLE:
A Deeper Look at Programs that Work with the Ultra-Poor, Including Youth and People with Disabilities
ROOM: Tsavo A
Translated session: English & French
PANEL:
Chair: Mr. Mohammed Khaled, Middle East & North Africa (MENA) Regional Representative, CGAP, Palestine
Panelist: Ms. Janet Bett, Manager, Tumaini Department, Jamii Bora Trust, Kenya
Panelist: Ms. Yetnayet Girmaw, Deputy Chief of Party, CARE Ethiopia, Ethiopia
DISASTERS AND THE CYCLE OF POVERTY: UNDERSTANDING URBAN, RURAL, AND GENDER ASPECTS OF SOCIAL VULNERABILITY by Kathy Lynn, Associate Director Resource Innovations, University of Oregon’s Institute for a Sustainable Environment September 2005
This presentation on poverty is a core orientation training module for all AmeriCorps*VISTAs. We have adapted the traditional training for the needs of Campus Compact VISTAs and incorporated a section on government policies that alleviate poverty and build assets. If you have any questions during the presentation, feel free to interrupt us. We are also counting on you to share your expertise and experiences, if you feel comfortable doing so. Your fellow VISTAs will remember your insights much longer that they will remember our presentation!
we have several learning objectives for this presentation.
Flipchart
Explain to participants that there are many lenses through which we can discuss poverty. The causes of poverty are complex and people in poverty are not a homogeneous group. The term includes people ranging from the homeless to the working poor. We could spend the entire session on how the distribution of wealth impacts poverty, or how poverty is built into the structure of our capitalist economy, or the implications of tax laws. The hope is that you will be better prepared to address poverty as VISTAs once you understand the context in which you are working: VISTA is the only national service program whose mission is to address poverty. Campus Compact VISTAs work specifically on creating long-term partnerships, educating lifelong citizens, and making institutional changes in higher education to alleviate poverty.
Age: Children comprise the greatest numbers and percentages of people in poverty. Race & Hispanic origin: The highest numbers of people in poverty are white; however, people of color have the highest percentages of their population in poverty. The African American unemployment rate is historically double that of the white unemployment rate. In the first quarter of 2009, black unemployment was 13.6% compared to the white unemployment rate of 8.2%. This is particularly clear when examining wealth. African Americans own only 7 cents for every dollar of net worth that white Americans own; for Hispanics the figure is only slightly higher at 9 cents for every dollar. Household type: Out of the large number of married households, a small percentage of them live in poverty. Out of the small number of female-headed households, a large percentage of them live in poverty. 2/3 of adults in poverty are women, 44% of single mothers remain below the poverty level. Employment status: The total number of people in poverty who worked full time or part time is higher than those who did not work at all. Educational attainment: The more advanced one’s education is, the less likely it is that he/she will experience high rates of poverty.
Understanding poverty is an important anchor for your year as a Campus Compact VISTA. Institutional politics, the diverse missions of community partners or campus offices may make it a challenge to remember your anti-poverty mission for the year. Sometimes investing in long-term transformation, like incorporating community partnerships into a curriculum, seem less important than getting out there and addressing pressing community problems. But at the core of every one of your work plans is the anti-poverty mission.
The organizations and campus offices where you will work may have programs to address both relative and absolute poverty, from tutoring programs that help narrow the education gap to collecting food for homeless shelters.
Relative poverty is also about comparative access to health, education, public safety, and other public resources. European countries do not use an absolute poverty measurement like ours to measure inequality. They measure a person’s distance from the median income, which captures the notion that we are poor or rich within the context of our community.
There are many paths into and out of poverty; many events throw people into poverty and many events help people exit from poverty. Responding to trigger events may be central to your work on campus, from planning alternative break trips to areas affected by hurricane Katrina to tutoring programs for children of incarcerated parents.
The fact that most people in poverty work full time indicates that there are structural and institutional factors that prevent many households from leaving poverty. Unfortunately, America is steeped in a tradition of splitting people in poverty into the “worthy” and “unworthy,” and people in generational poverty are often blamed for not pulling themselves out of poverty.
Theoretical models are helpful for us to begin to absorb the realities and nuances of the communities where we will live and serve. Every community is at a different intersection of these larger state, national, and global issues, so solutions have to be appropriate for specific communities. Nevertheless, it’s important for you to understand poverty at an systemic level, because you are responsible for making sustainable, systematic change. As a VISTA, you’ll be grappling with the big picture to protect and secure economic stability for your community.
Income supports like TANF and food stamps protect some families from absolute poverty. Helping families develop assets above basic consumption needs helps protect against economic shocks and may break the cycle of generational poverty. For the vast majority of households, the pathway out of poverty is through savings and accumulation, so families can plan beyond one paycheck or emergency.
We often think of government welfare as income transfers to low-income families with children. However, a broad range of government programs redistribute tax funds to low and moderate income families. It is helpful to understand government welfare as three general categories: fiscal, occupational, and social. First, government programs that support fiscal welfare include taxation, monetary and fiscal policies. Income, property, estate, capital gains, and corporate income taxes can all be tools for wealth and income redistribution. The Earned Income Tax Credit is an example of fiscal welfare that offers benefit to low-income working families. Second, occupational welfare includes jobs, wages, and unions, like the Workforce Investment Act, or Welfare to Work programs. VISTA could also be considered an occupational welfare program! There are two kinds of social welfare programs, social insurance and social assistance. Social insurance programs, including Social Security, Medicare, and Unemployment Insurance, are contribution based and offer benefits for workers across the income spectrum. Social insurance programs require workers to pay for care through payroll taxes, thus creating more equity of income throughout a person’s life. Unlike social insurance programs, social assistance programs do not require a contribution, and are more redistributive to low-income citizens. Social assistance programs are means-tested, which means that a client must prove that they earn less than a particular income. Basic need programs include Medicaid, programs that subsidize housing costs, and Food Stamps. What other Social Welfare programs are designed to alleviate poverty and build assets? Unemployment Insurance Social Security Social Security Disability Insurance ADFC/TANF: Temporary Aid to Needy Families Food Stamps and WIC Heating Assistance and weatherization services Child Care Subsidies State Children’s Health Insurance Program (SCHIP) Section 8 Rent Allowances (vouchers) EITC: Earned Income Tax Credits IDAs: Individual Development Accounts Tax Codes, bankruptcy, property laws, home mortgage deductions The GI Bill
We’ll be breaking out into small groups soon. Does anyone have any questions or thoughts now about models of poverty, asset-building as an anti-poverty strategy, or redistributive government policies? Second years, VISTA leaders, and program directors, do you have anything to add before our next activity?
Groups present out their ideas to address regional poverty-related issues